


by Liz Ann Sonders, Chief Investment Strategist, Charles Schwab & Company Ltd.
Key Points
- Investor sentiment is both wildly/speculatively bullish and more skeptical; it just depends on who you’re tracking.
- Shorter-term traders (likely skewing younger) are buying equity call options and VIX put options; while longer-term investors are skittish and selling equity funds.
- The net is that sentiment is currently a mixed bag.
Perhaps the most descriptive statement ever made about the stock market came from the late-great Sir John Templeton (whom I had the great pleasure of meeting on the set of Wall $treet Week With Louis Rukeyser): “Bull markets are born on pessimism, grow on skepticism, mature on optimism and die on euphoria.” Notice there is not a single reference to economic statistics, earnings growth, interest rates or valuations. The truth in the statement lies in those omissions, in that emotions and behavior are what actually drive markets—even if trends in the economy and earnings help shape those emotions. In fact, as I’ve often noted, investors think of valuation as a “fundamental” indicator in the sense that most valuation metrics—including P/E ratios—have quantifiable components. The reality is that valuation is more of a sentiment indicator than it is a fundamental indicator.
In addition to understanding investor sentiment as a market cycle driver, it’s important to understand the relationship (and differences) between attitudinal and behavioral measures of sentiment. There are many unique characteristics of the most recent market cycle—not least being the speed with which the COVID crisis took stocks from an all-time high on February 19 to a -34% bear market decline by March 23, and back to all-time highs by September 2. Another unique characteristic is the, at times, vast spread between behavioral and attitudinal measures of sentiment.
Rise of the retail trader and the “big 5”
The stock market has been increasingly driven by the activities of individual traders/investors—with a consensus estimate that they represent at least 20% of trading volume recently. There are likely feeder impacts as well; with the retail investor taking on the role of the horse, and institutions taking on the role of the cart. As discussed below, retail traders have been active buying call options on individual stocks. The market makers selling those traders the calls then have to turn around and purchase the underlying stocks.
Much of that activity has been among the largest stocks in the S&P 500—including the “big 5” largest companies in the index: Apple, Microsoft, Amazon, Google and Facebook. Since the COVID-19 bear market began on February 19, those five stocks are up nearly 33%, while the other 495 stocks are down nearly 1% (through Friday’s close). Separate from market makers are other institutional traders/investors that have the S&P 500 as at least a partial benchmark. Given that the big 5 stocks represent about 23% of the overall S&P 500 index on a capitalization-weighted basis; not owning them is likely a peril to performance.
This set of powerful forces has elicited many comparisons to the end of the tech boom era in 2000. The difference is that although the largest five stocks represented a lesser 18% of the overall S&P 500 index at the peak in 2000, their valuations are significantly less stretched (an average forward P/E of more than 60 then vs. about half of that today). Another important difference is that investor sentiment in 2000 was universally euphoric; while today it’s arguable a mixed bag. Read on.
Who is smart?
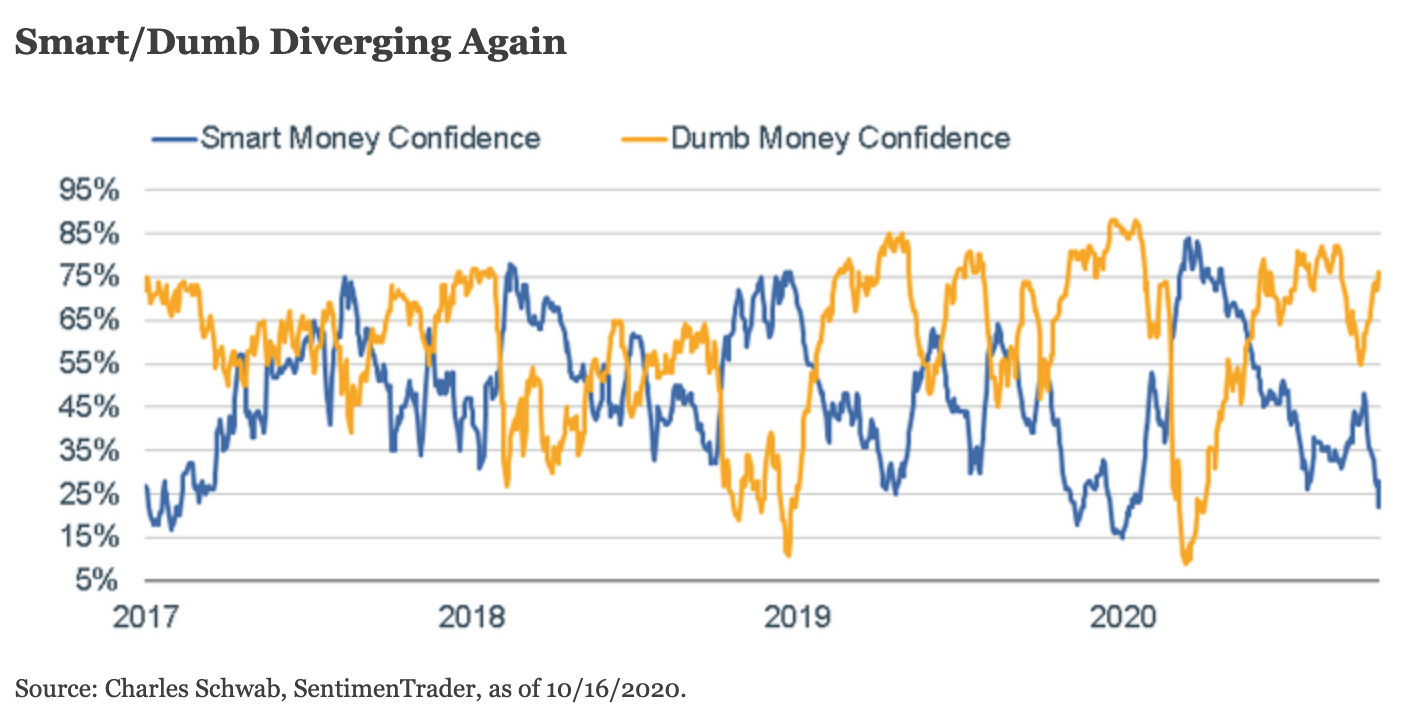
Let’s start with behavioral measures of sentiment. One of my closely-watched indicators is courtesy of SentimenTrader (ST), who tracks the difference between what the “smart money” (SM) is doing vs. the “dumb money” (DM). ST tracks indicators such as the S&P 100 (OEX) put/call and open interest ratios, as well as commercial hedger positions in the equity index futures to create its SM confidence index—typically a non-contrarian indicator (especially at extremes). On the other hand, ST tracks indicators such as the equity-only put/call ratio, the flow into and out of the Rydex (bull/bear) series of index mutual funds, and small speculators in equity index futures contracts to create its DM confidence index—typically a contrarian indicator (especially at extremes).
As you can see below, dumb money confidence is rebounding again; and at north of 75% is approaching the prior highs over the past couple of years. Conversely, smart money confidence has again sunk to near its lows over the past couple of years. The DM-over-SM spread is not quite at the extreme of early 2020 (a precursor to the February peak in stocks); but clearly moving in the opposite direction relative to the SM-over-DM spread of mid-March 2020 (a precursor to the March trough in stocks). Important caveat: for now, the “dumb money” has been right.
Options speculation
Related to ST’s readings above, is the recent extreme spread between the volume in equity options and index options. As of last Wednesday, according to ST, the three-day average of the CBOE index put/call ratio was in the top 95% of its range over the past year. Conversely, the average of the equity put/call ratio was in the bottom 5% of its one-year range. Going back more than two decades, this never happened at the same time. Since then, the index put/call has reversed most of its recent spike; while the equity put/call is only up marginally from its recent low. You can see both charts below.

It appears that traders had been establishing hedges on major indexes as a check against some bets that individual stocks will keep rising. Although not historically at the same level as what we saw last week; when traders behaved this way in the past two decades, there actually tended to be a higher chance of subsequent market gains (with the exception of experiences in late-2001 and mid-2007).
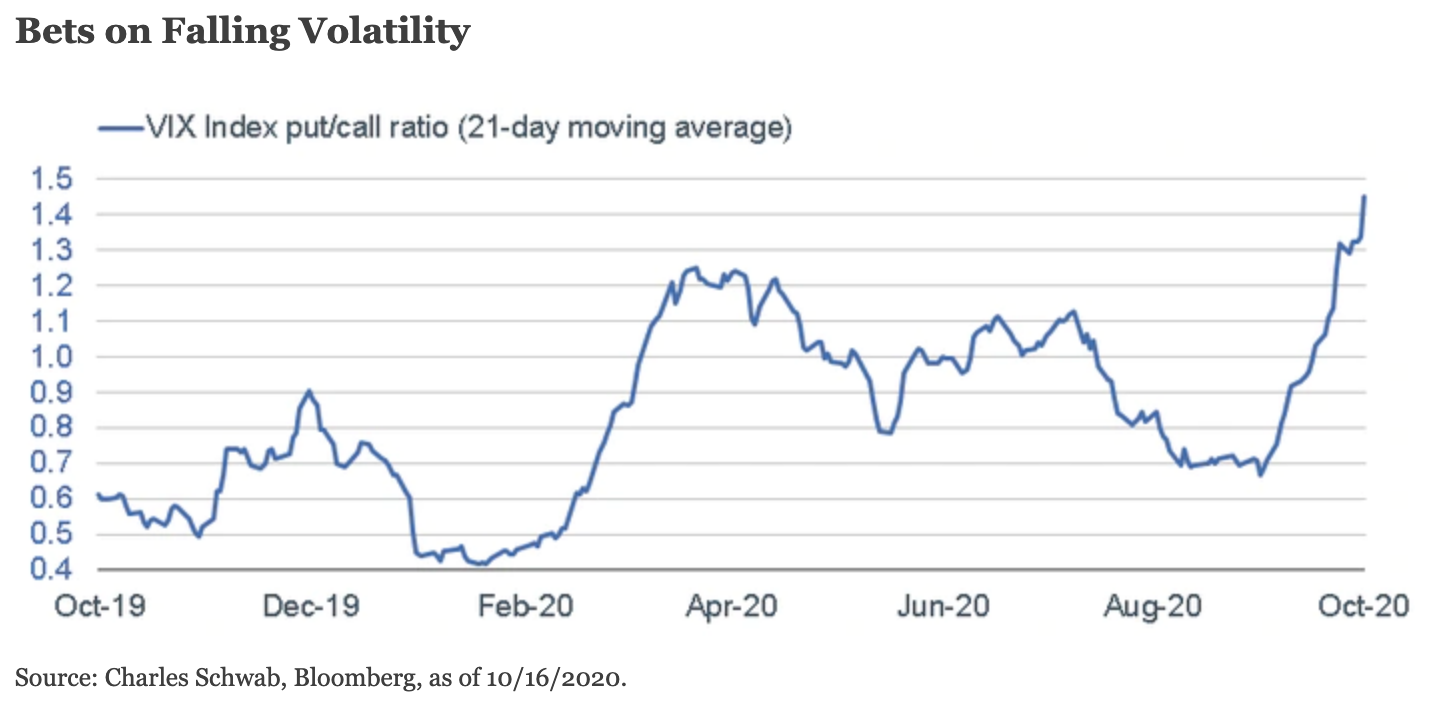
Bets on higher stocks/lower volatility
There has also been a lot of action in speculative positions in VIX (volatility index) futures. As shown in the chart below, the 21-day average of the VIX (volume) put/call ratio has been moving in the opposite direction of the equity put/call (as well as the stock market). In addition, using Commodity Futures Trading Commission (CFTC) weekly data, VIX non-commercial speculative positions are net short. As a percentage of total open interest, net shorts are more extended than the months prior to “Volmageddon” in 2018’s first quarter (when volatility spiked and wiped out many “short vol” investments), and the near-bear market in 2018’s fourth quarter. Basically, investors are forgoing downside protection while betting on stocks’ upside; suggesting some near-term risk for higher volatility and/or weaker market performance.
Do vs. say
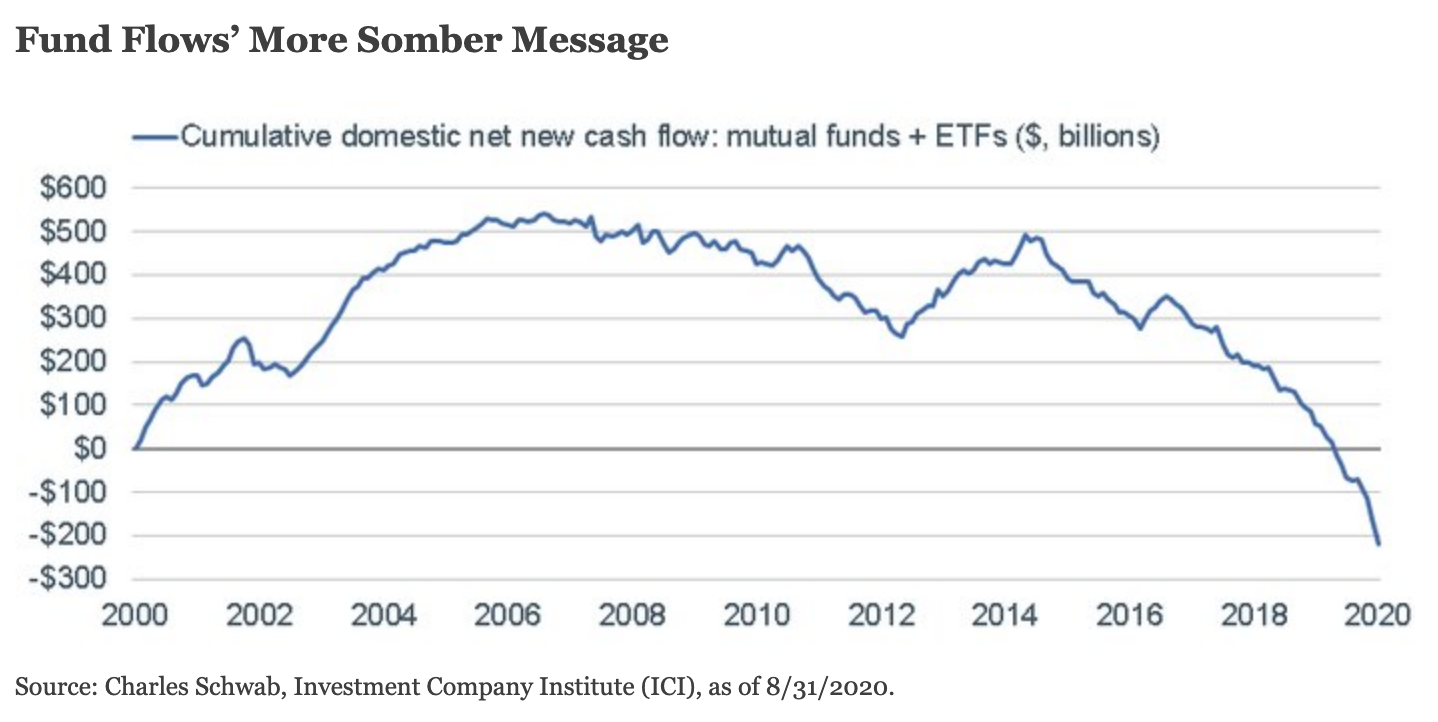
Although there is extreme speculation occurring by some cohorts of investors—especially within the options market—the same can’t be said about all behavioral measures of sentiment. Case in point would be equity mutual fund and exchange-traded fund (ETF) flows. As you can see in the chart below, there has been a steady cumulative downdraft in flows since the beginning of 2015—belying the extremes witnessed more recently in the options market. I will speculate that there may be an age/demographic bias at play; with younger traders/investors betting on a rising market (or at least a rise in the stocks on which they’re betting with call options), and older investors less sanguine.
Skepticism can also be seen in a key attitudinal measure of investor sentiment. The American Association of Individual Investors (AAII) conducts a weekly survey of their members—typically longer-term investors, not short-term traders. Consistently this year, the percentage saying they’re bearish has exceeded the percentage saying they’re bullish. They have recently converged and are nearly connected; but not to anything resembling a bullish extreme (like was the case in early 2018; prior to the aforementioned “Volmageddon” plunge).
Mixed bag
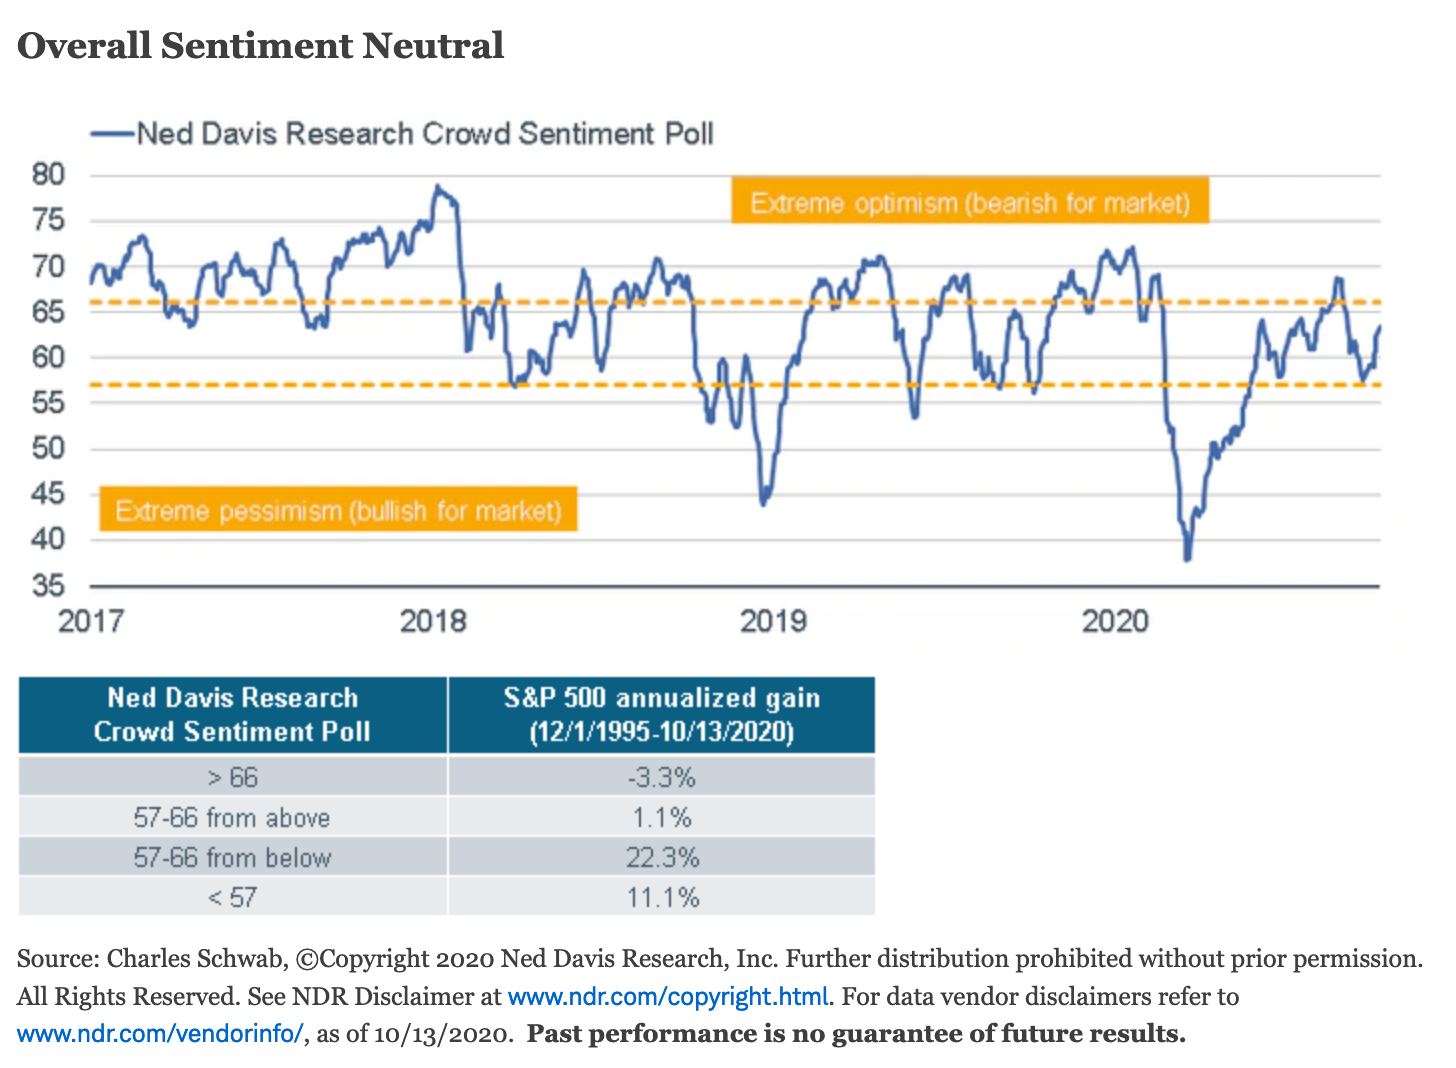
The net is that sentiment is a mixed bag. Ned Davis Research tracks their Crowd Sentiment Poll by amalgamating a handful of both attitudinal and behavioral measures of sentiment. As you can see in the chart below, sentiment has become a bit more optimistic; but remains in the neutral zone. As the accompanying chart shows, once it moves into the “extreme optimism” zone, that’s when returns tended to be weakest historically.
Stocks disconnected from economy?
I never try to time the market; even when sentiment is universally stretched (in either direction)—even if it’s proven to be a strong contrarian signal. To many investors, the market’s ascent since March is disconnected from the perils of the COVID-19 virus on the economy. But the aforementioned bias in performance of the largest companies vs. the rest of the market may actually be telling a more connected story than people realize. In fact, even with the major indexes again in shouting distance of all-time highs, 37% of stocks within the S&P 500 remain down more than 20% from their 52-week highs.
I will be keeping a close eye on those sentiment indicators still showing skepticism. Those could soon give way to the stock market’s ascent and start to show extreme bullishness; which when connected to the euphoria already on display by shorter-term traders, could mean a sentiment extreme that suggests some contrarian downside risk for stocks. In the meantime, our advice remains the same: remain disciplined around diversification and periodic (and perhaps volatility-based) rebalancing.
I’ll conclude where I started with an additional favorite quote from legendary investor Jack Bogle (with whom I also had the great pleasure of sharing the camera on Wall $treet Week With Louis Rukeyser): “Your success in investing will depend in part on your character and guts and in part on your ability to realize, at the height of ebullience and the depth of despair alike, that this too, shall pass.”
Copyright © Charles Schwab & Company Ltd.


