
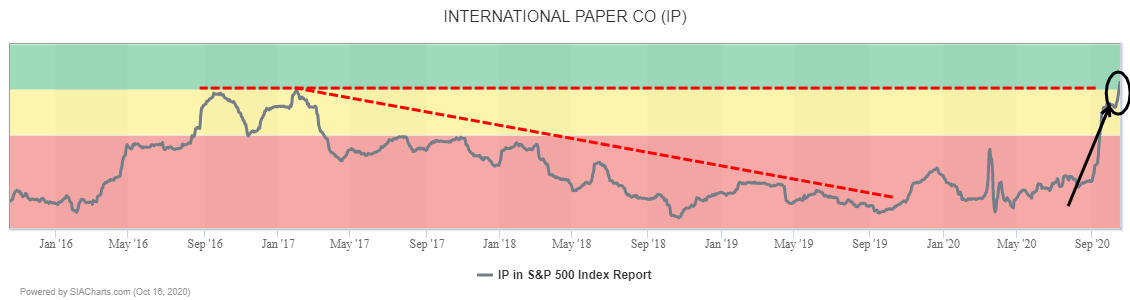
For the first time since 2013, International Paper (IP) returned to the Green Favored Zone of the SIA S&P 500 Index Report on Friday after climbing 18 spots in one day and 84 places in the last month.
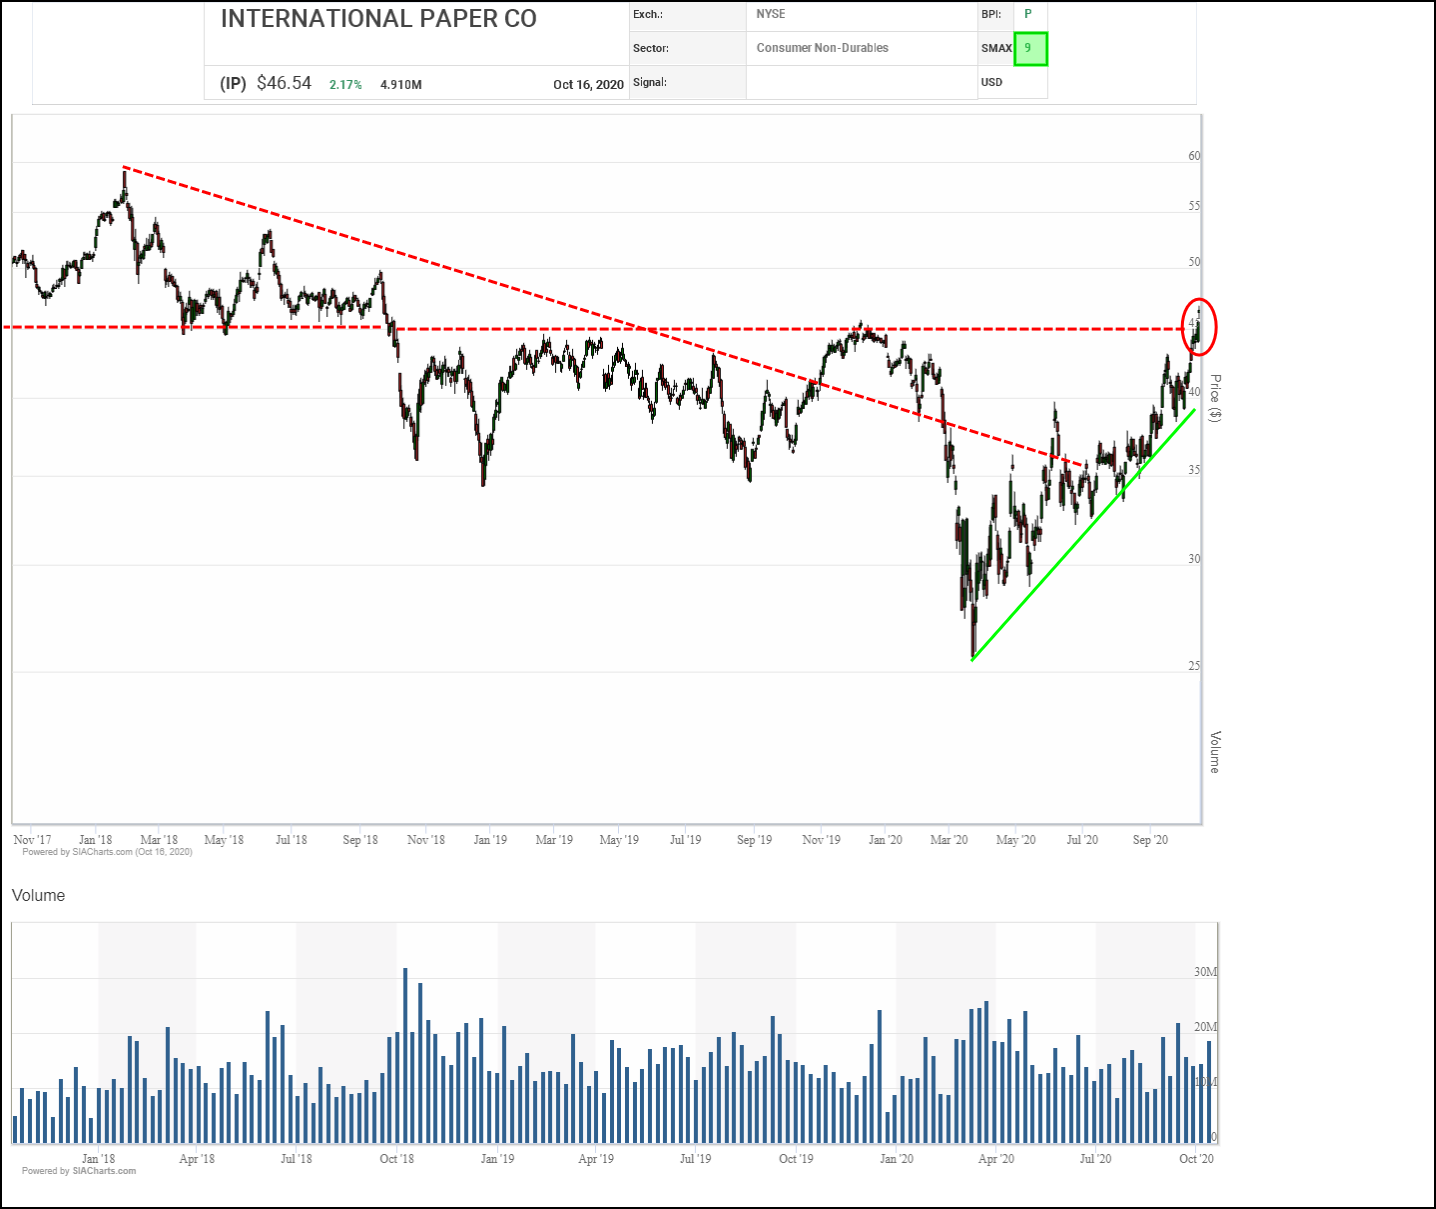
Late last year, International Paper (IP) snapped out of a long-term downtrend but faltered short of $45.00 and turned downward again. Since bottoming out in March, the shares have been under renewed accumulation, climbing in a rising channel of higher highs and higher lows. The shares once again have broken out of their long-term downtrend, and this time, they have also broken out over $45.00, confirming that a new uptrend is underway.
Next potential upside resistance tests on trend appear near the $50.00 round number, then prior peaks near $54.00 and $59.00. Initial support moves up toward $44.00 from the $39.00 to $40.00 area.
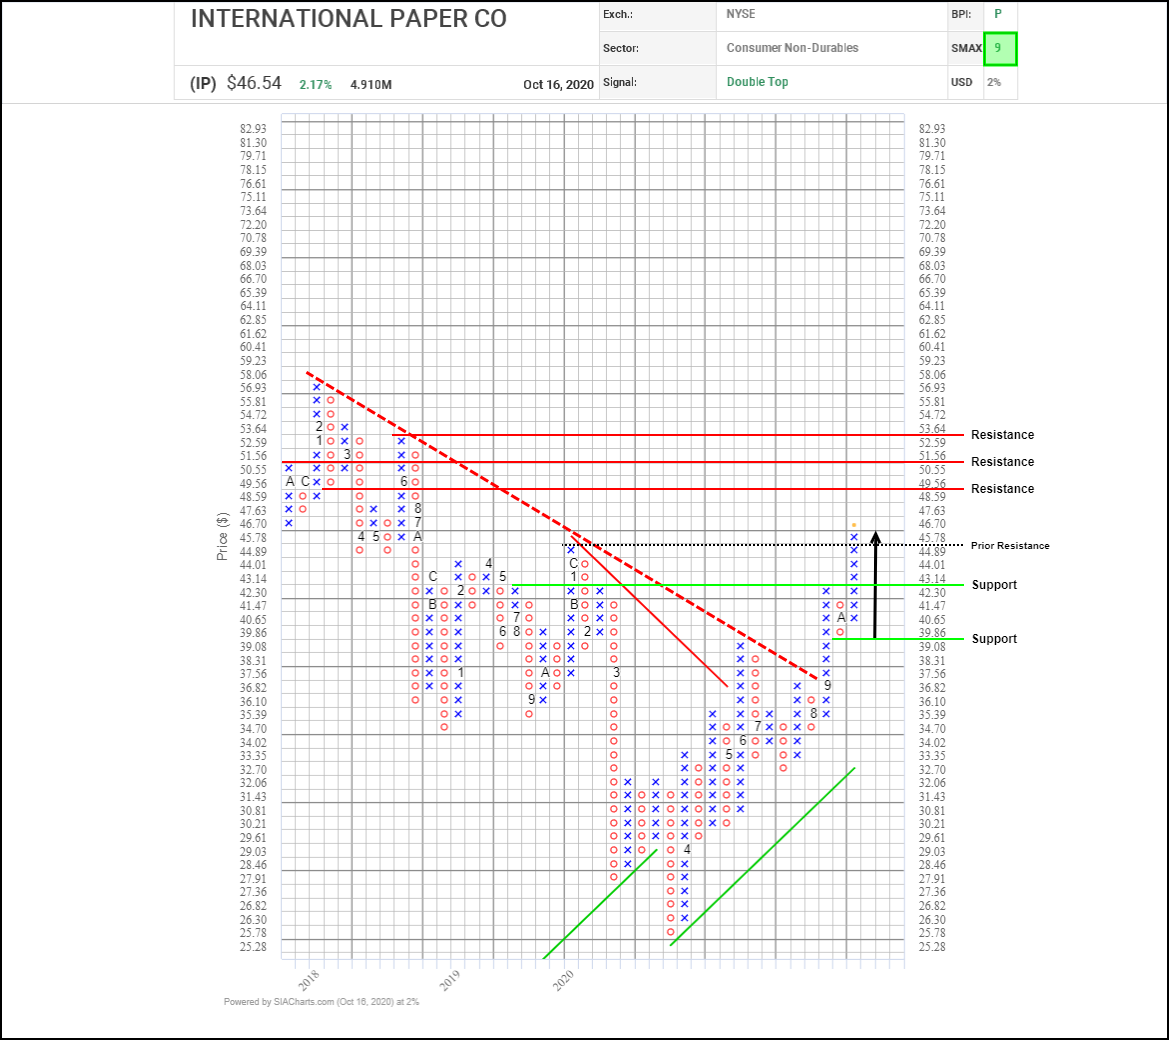
Back in September, International Paper (IP) snapped out of a downtrend, clearing $37.50, signaling the start of a new uptrend which has continued with the shares completing a bullish Spread Double Top sandwiched by two bullish Double Tops. Last week, the shares broke through previous resistance near $45.00, confirming that accumulation continues.
Next potential upside resistance appears in the $49.50 to $51.50 area where vertical/horizontal counts converge with the $50.00 round number, followed on trend by previous column highs near $53.65 and $58.00. Initial support appears near $42.30 where a 3-box reversal converges with a previous breakout point.
With a bullish SMAX score of 9, IP is exhibiting near-term strength against the asset classes.
Disclaimer: SIACharts Inc. specifically represents that it does not give investment advice or advocate the purchase or sale of any security or investment whatsoever. This information has been prepared without regard to any particular investors investment objectives, financial situation, and needs. None of the information contained in this document constitutes an offer to sell or the solicitation of an offer to buy any security or other investment or an offer to provide investment services of any kind. As such, advisors and their clients should not act on any recommendation (express or implied) or information in this report without obtaining specific advice in relation to their accounts and should not rely on information herein as the primary basis for their investment decisions. Information contained herein is based on data obtained from recognized statistical services, issuer reports or communications, or other sources, believed to be reliable. SIACharts Inc. nor its third party content providers make any representations or warranties or take any responsibility as to the accuracy or completeness of any recommendation or information contained herein and shall not be liable for any errors, inaccuracies or delays in content, or for any actions taken in reliance thereon. Any statements nonfactual in nature constitute only current opinions, which are subject to change without notice.