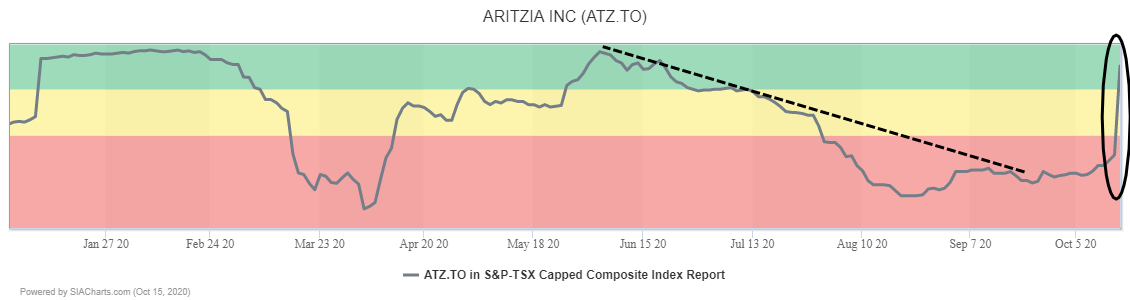
A positive reaction among investors to specialty retailer Aritzia’s (ATZ.TO) sparked a 13.8% rally in its shares yesterday. These gains drove Aritzia up 108 spots in the SIA S&P/TSX Composite Index Report yesterday moving directly from the red zone to the Green Favored Zone in one day.
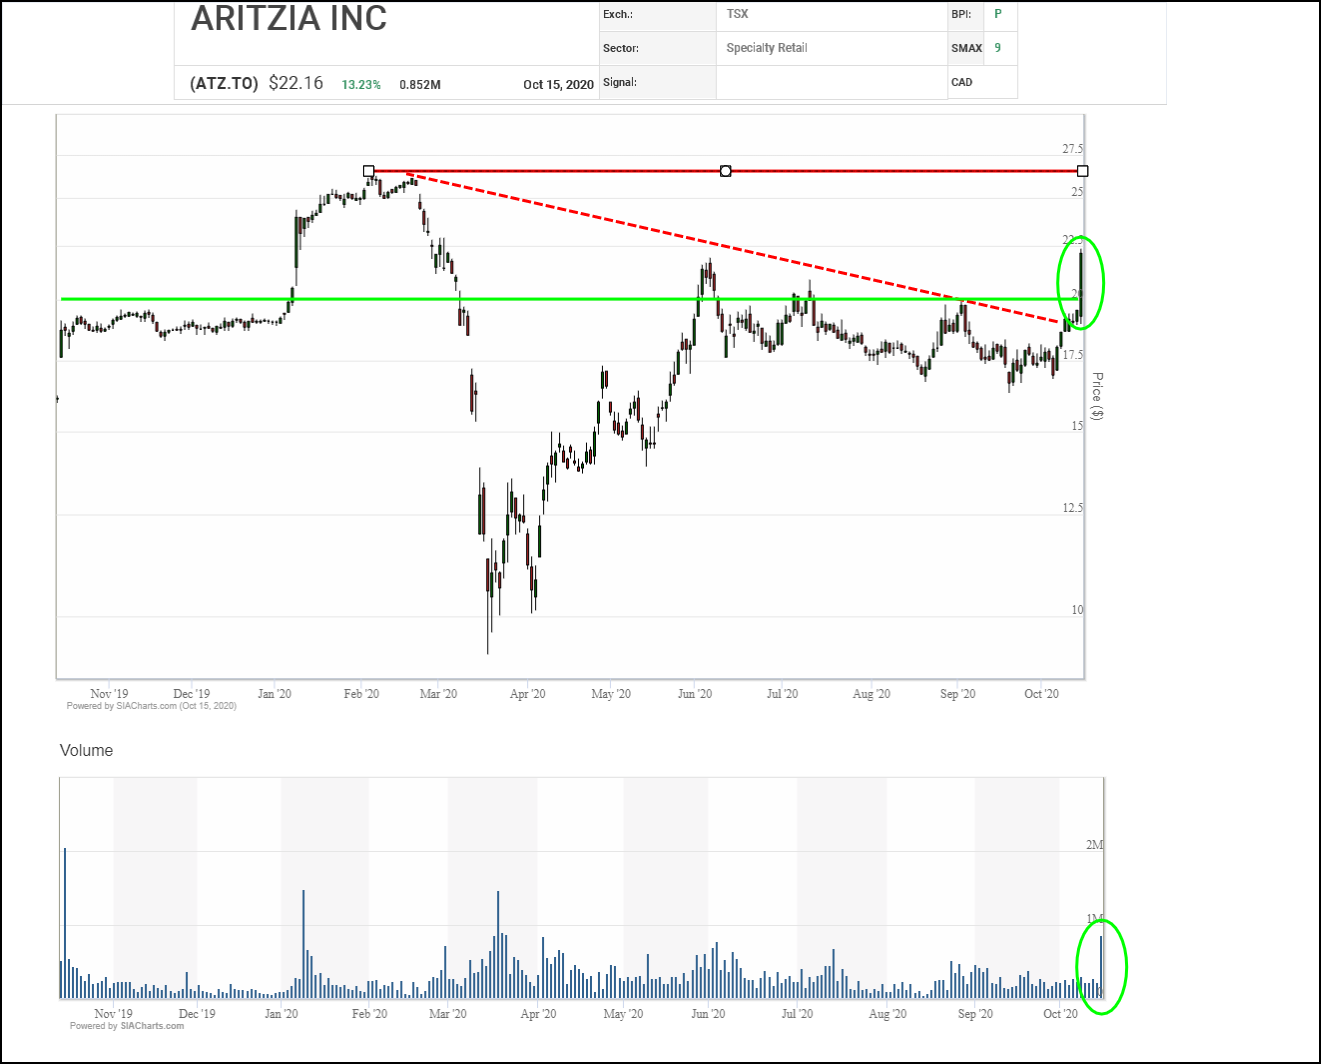
Aritzia (ATZ.TO) shares recently snapped out of a downtrend, and yesterday they decisively embarked on a new uptrend with a big breakout rally on a spike in volume indicating renewed accumulation. The shares are currently bumping up against initial resistance near $22.50 but if they can get through there, next potential upside resistance appears near the $25.00 round number and then $26.50 where a previous high and a measured move converge. The $20.00 breakout point reverses polarity to become initial support.
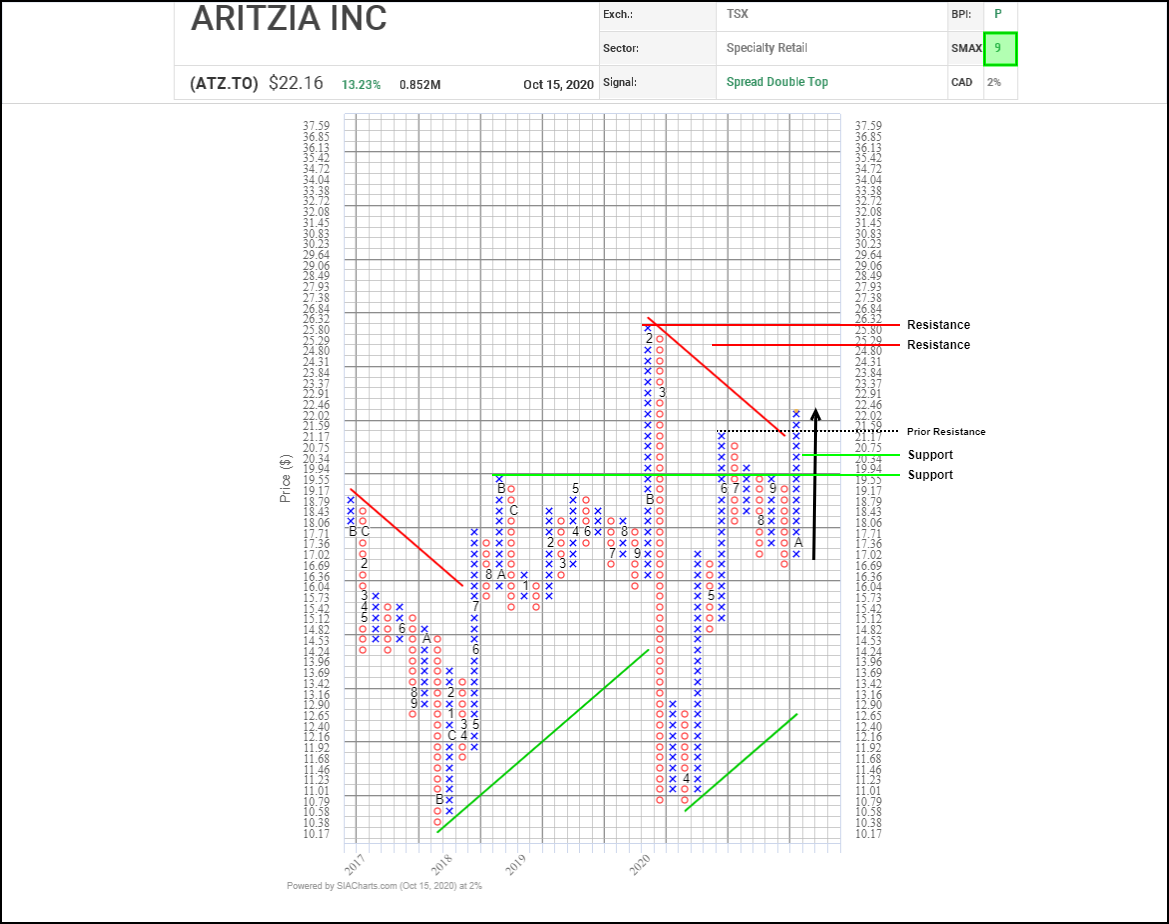
Fashion retailer Aritzia (ATZ.TO) staged a major breakout yesterday, blasting through the $20.00 level as it soared from near $19.00 to above $22.00. Along the way it completed a bullish Double Top and two bullish Spread Double Top breakouts and snapped a downtrend line, all combining to signal the start of a new uptrend.
Next potential upside resistance appears near the $25.00 round number, then $25.80 based on a horizontal count, and the 52-week peak near $26.35. Initial support appears near $20.35 based on a 3-box reversal.
With a bullish SMAX score of 9, ATZ.TO is exhibiting near-term strength against the asset classes.
Disclaimer: SIACharts Inc. specifically represents that it does not give investment advice or advocate the purchase or sale of any security or investment whatsoever. This information has been prepared without regard to any particular investors investment objectives, financial situation, and needs. None of the information contained in this document constitutes an offer to sell or the solicitation of an offer to buy any security or other investment or an offer to provide investment services of any kind. As such, advisors and their clients should not act on any recommendation (express or implied) or information in this report without obtaining specific advice in relation to their accounts and should not rely on information herein as the primary basis for their investment decisions. Information contained herein is based on data obtained from recognized statistical services, issuer reports or communications, or other sources, believed to be reliable. SIACharts Inc. nor its third party content providers make any representations or warranties or take any responsibility as to the accuracy or completeness of any recommendation or information contained herein and shall not be liable for any errors, inaccuracies or delays in content, or for any actions taken in reliance thereon. Any statements nonfactual in nature constitute only current opinions, which are subject to change without notice.