
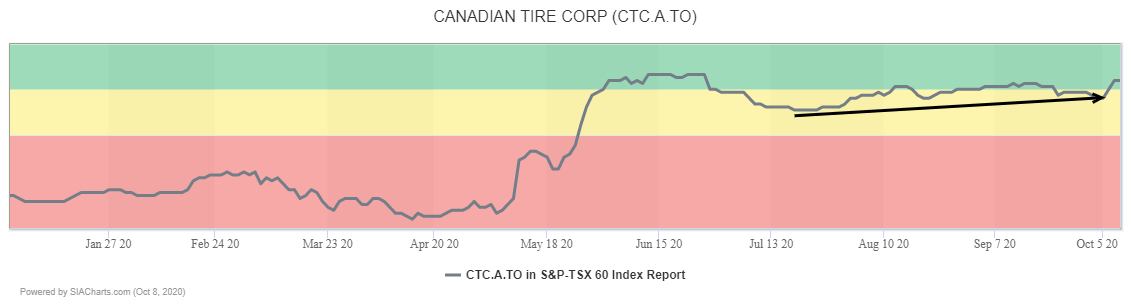
Canadian Tire (CTC.A.TO) popped back into the Green Favored Zone of the SIA S&P/TSX 60 Index Report earlier this week and is currently sitting in 13th place.
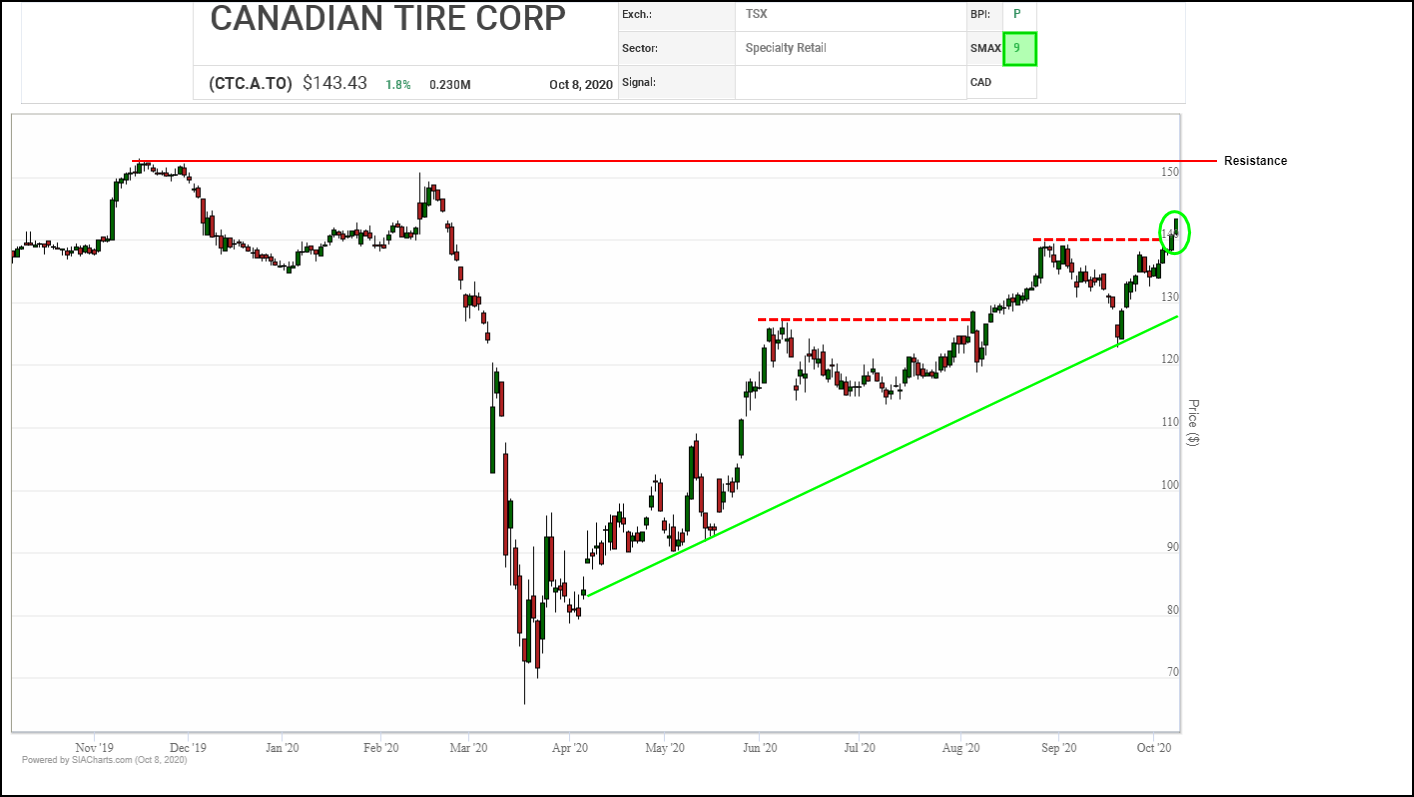
A major breakout is underway in Canadian Tire (CTC.A) shares this week which have cleared the top of a $126.00-$140.00 trading range to signal the start of a new upleg within its ongoing recovery trend. Next potential upside resistance appears in two areas, $150.00-$152.50 between a round number and the shares previous high, then $155.00 to $156.00 where two measured moves converge. Initial support moves up to the $140.00 breakout point from $132.50.
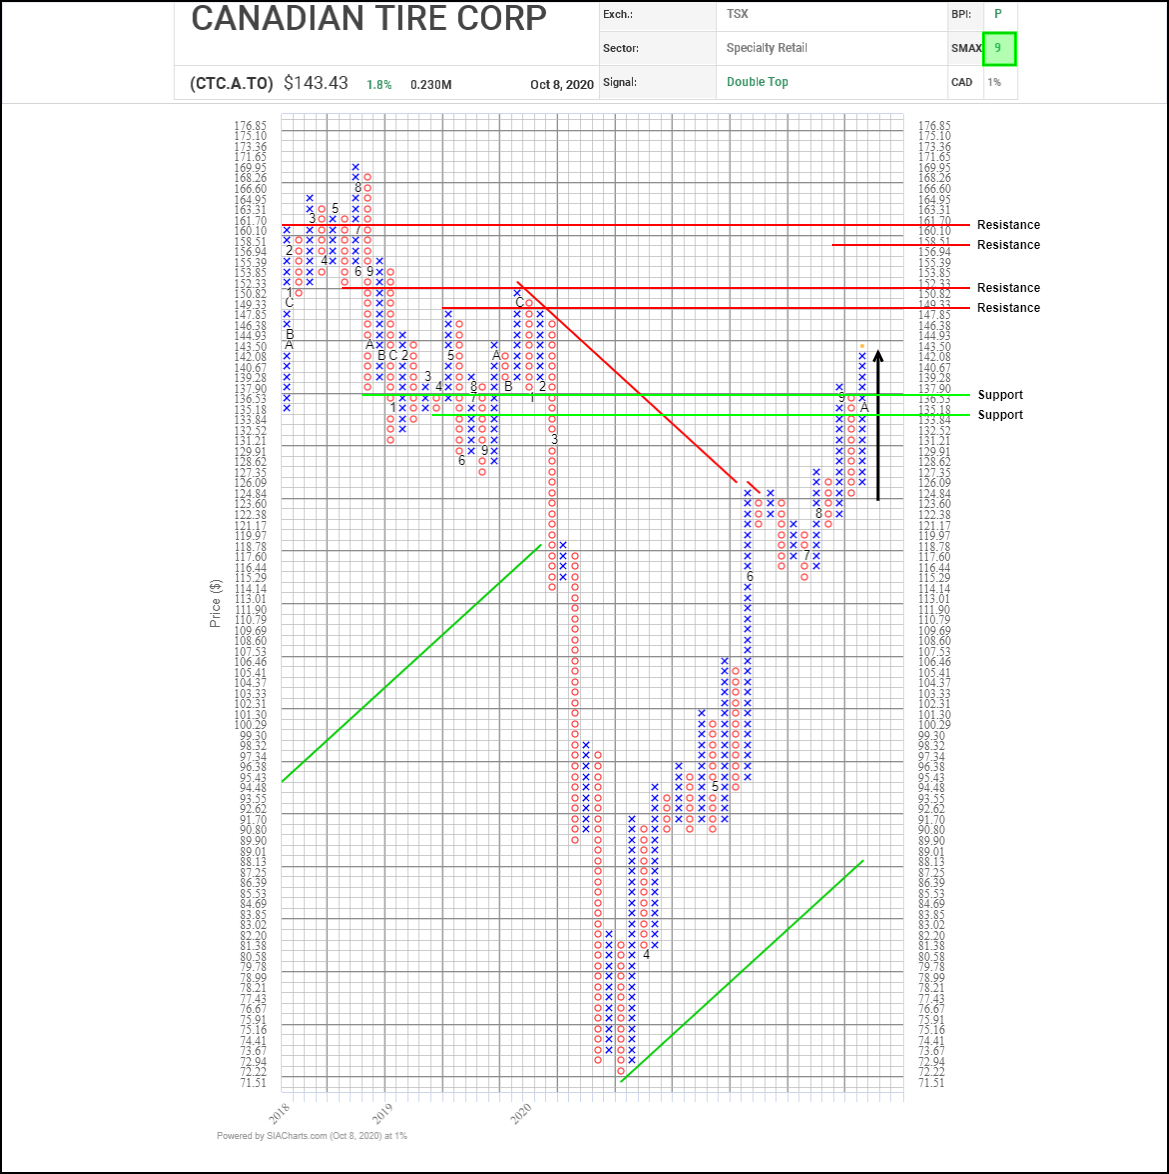
After rallying in the spring and consolidating through the summer, Canadian Tire (CTC.A.TO) has resumed its upward course in the last few weeks. A bullish Double Top breakout this month has signaled the start of a new upleg on trend. Initial upside resistance may appear in two zones, $149.30 to $153.30, and then $158.50 to $161.70, both of which are clusters where previous column highs/lows, vertical/horizontal counts, and round numbers converge. Initial support appears near $136.50 based on a 3-box reversal.
With a bullish SMAX score of 9, CTC.A.TO is exhibiting near-term strength against the asset classes.
Disclaimer: SIACharts Inc. specifically represents that it does not give investment advice or advocate the purchase or sale of any security or investment whatsoever. This information has been prepared without regard to any particular investors investment objectives, financial situation, and needs. None of the information contained in this document constitutes an offer to sell or the solicitation of an offer to buy any security or other investment or an offer to provide investment services of any kind. As such, advisors and their clients should not act on any recommendation (express or implied) or information in this report without obtaining specific advice in relation to their accounts and should not rely on information herein as the primary basis for their investment decisions. Information contained herein is based on data obtained from recognized statistical services, issuer reports or communications, or other sources, believed to be reliable. SIACharts Inc. nor its third party content providers make any representations or warranties or take any responsibility as to the accuracy or completeness of any recommendation or information contained herein and shall not be liable for any errors, inaccuracies or delays in content, or for any actions taken in reliance thereon. Any statements nonfactual in nature constitute only current opinions, which are subject to change without notice.