


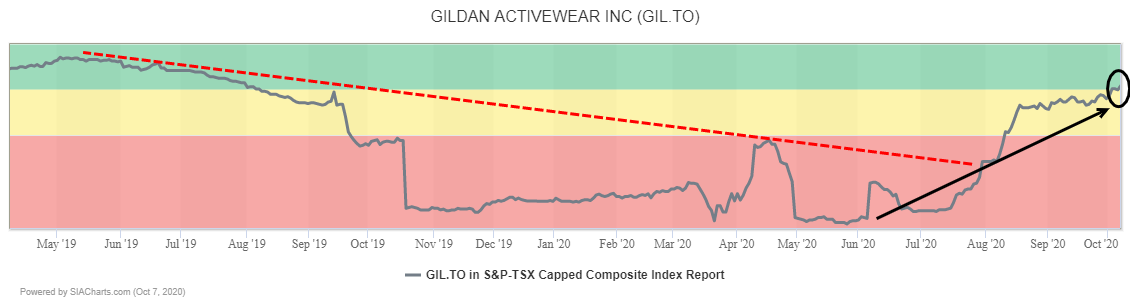
Gildan Activewear (GIL.TO) has returned to the Green Favored Zone of the SIA S&P/TSX Composite Index Report for the first time since July of 2019 after moving up 5 spots yesterday and 16 spots in the last month. Gildan currently sits in 5th place in the SIA S&P/TSX 60 Index Report near the top of the Green Favored Zone.
Since bottoming out back in March, Gildan Activewear (GIL.TO) has been under steady accumulation, climbing in a step pattern of rallies followed by consolidation at higher levels, completing a series of bullish Ascending Triangle breakouts, building an uptrend line of consistently higher lows, and holding above their 50-day and 200-day averages following breakouts.
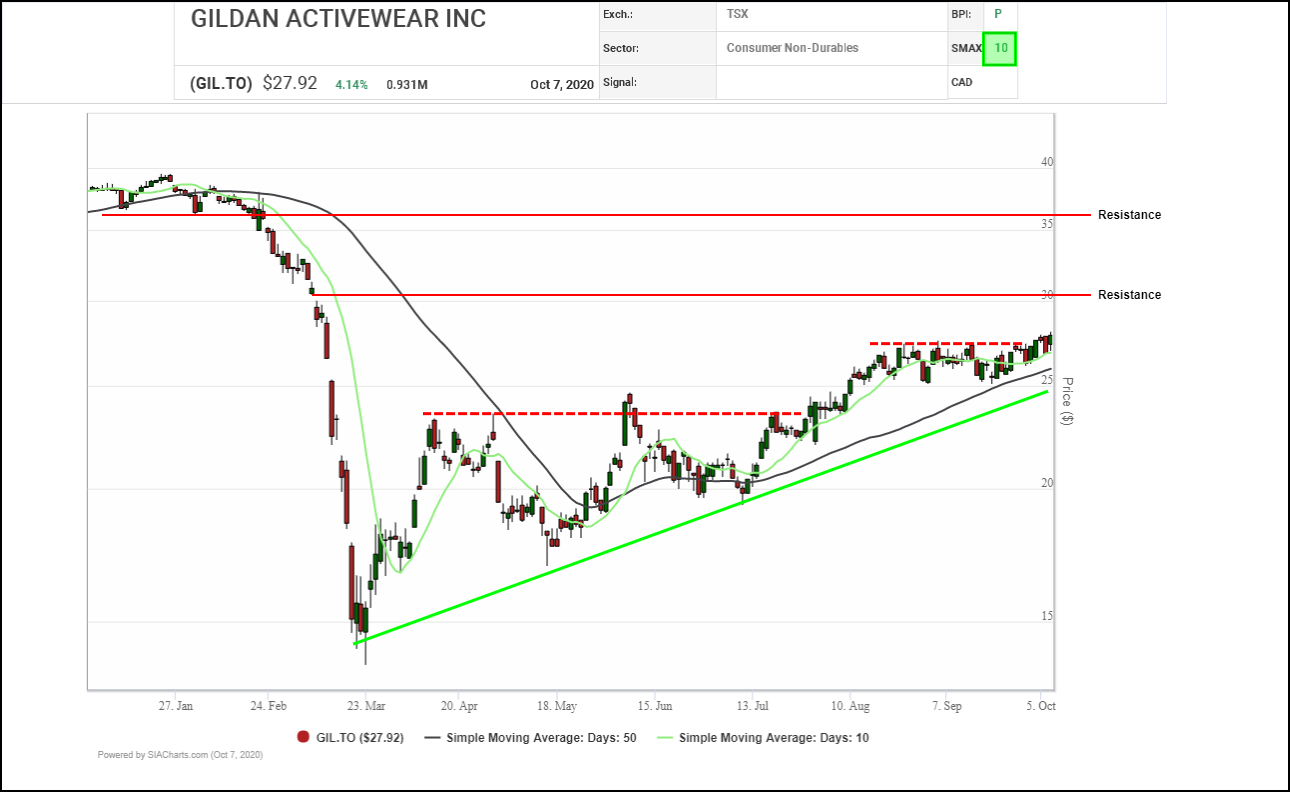
Next potential resistance on trend appears in the $30.00 to $31.00 area where a round number, measured move and a previous gap cluster, followed by the $35.00 to $36.00 area where a round number and an old support level converge. Initial support appears in the $25.00 to $26.00 zone between a round number and the 200-day moving average.
Back in the spring, Gildan Activewear (GIL.TO) shares completed a major selloff, which had started in the summer of 2019, and staged an initial recovery bounce. Following a few months of base-building, a new recovery trend got underway in earnest in August with a bullish Spread Double Top breakout. Since then, with the exception of a brief 3-box correction, the shares have been steadily climbing and recently completed a bullish Double Top to signal the start of a new upleg and confirm that its current uptrend continues.
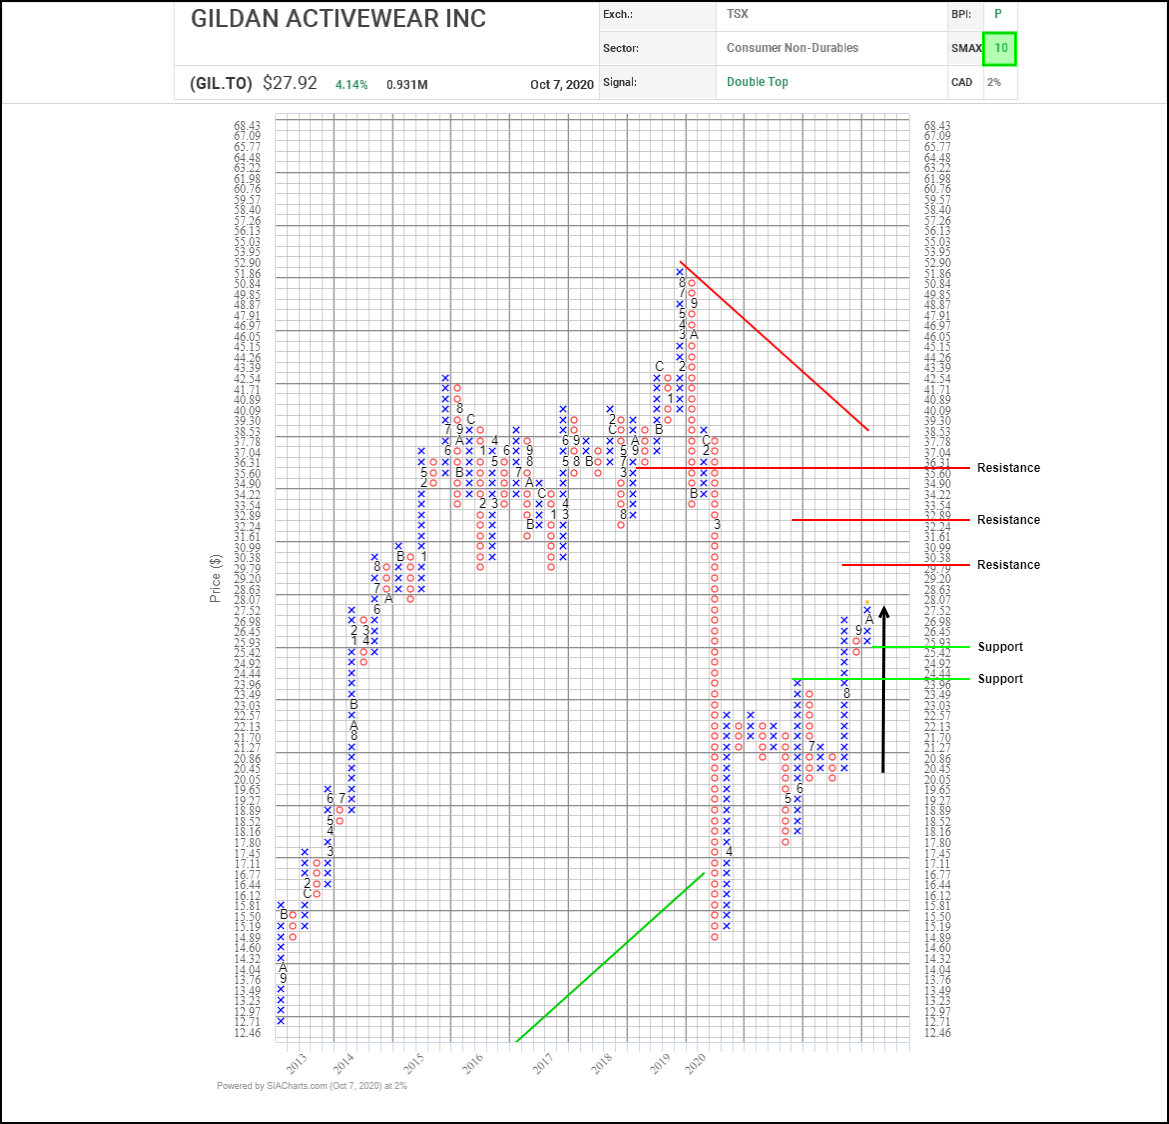
Next potential upside resistance tests on trend appear near $30.40, $32.90, and $36.30, based on a series of vertical and horizontal counts. Initial support appears near $25.40 based on a 3-box reversal, then the $25.00 round number.
With a perfect SMAX score of 10, GIL.TO is exhibiting near-term strength across the asset classes.
Disclaimer: SIACharts Inc. specifically represents that it does not give investment advice or advocate the purchase or sale of any security or investment whatsoever. This information has been prepared without regard to any particular investors investment objectives, financial situation, and needs. None of the information contained in this document constitutes an offer to sell or the solicitation of an offer to buy any security or other investment or an offer to provide investment services of any kind. As such, advisors and their clients should not act on any recommendation (express or implied) or information in this report without obtaining specific advice in relation to their accounts and should not rely on information herein as the primary basis for their investment decisions. Information contained herein is based on data obtained from recognized statistical services, issuer reports or communications, or other sources, believed to be reliable. SIACharts Inc. nor its third party content providers make any representations or warranties or take any responsibility as to the accuracy or completeness of any recommendation or information contained herein and shall not be liable for any errors, inaccuracies or delays in content, or for any actions taken in reliance thereon. Any statements nonfactual in nature constitute only current opinions, which are subject to change without notice.


