
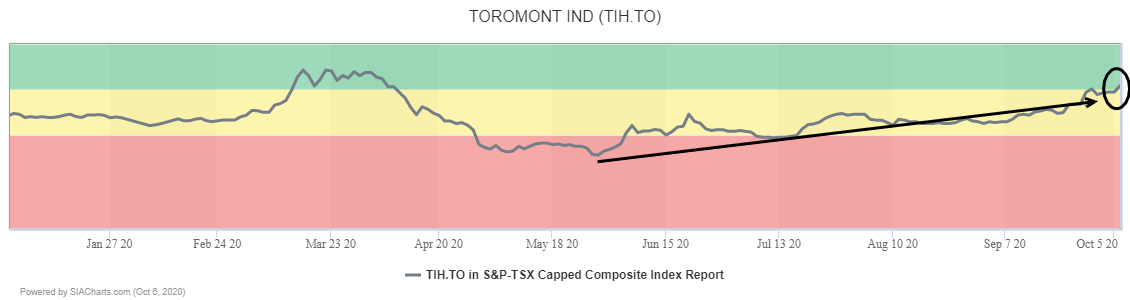
Heavy equipment dealership Toromont Industries (TIH.TO) has returned to the Green Favored Zone of the SIA S&P/TSX Composite Index Report after moving up 8 spots yesterday and 43 spots in the last month.
Since bottoming out back in March, Toromont Industries (TIH.TO) shares have been under steady accumulation, completing a series of bullish Ascending Triangle breakouts and successful retests of these breakout points as new support levels.
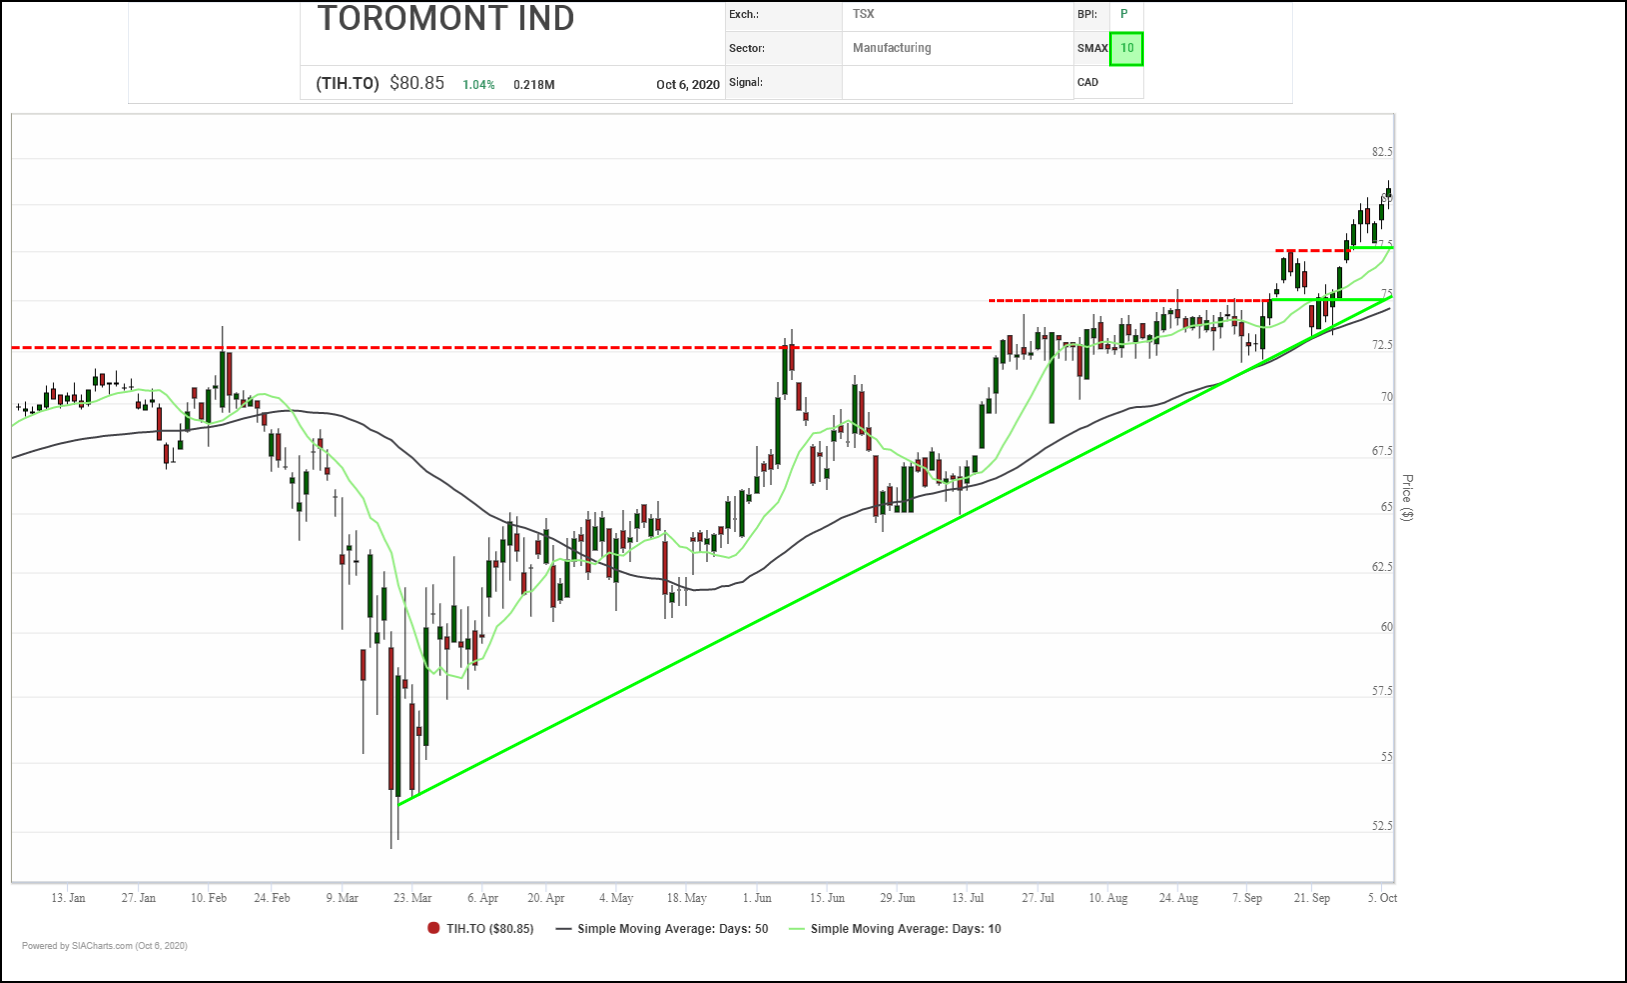
Rallying up off of a successful retest of $75.00 support (cluster of a round number, 50-day average and previous breakout point). TIH.TO broke through $80.00 yesterday to another new high, confirming that its current uptrend continues. Next potential upside resistance appears near $87.50, $92.50 and $97.50 based on measured moves, then the $100.00 round number.

A successful retest of a previous breakout point near $65.00 back in July ended up serving as the launch pad for a recent rally in Toromont Industries (TIH.TO) shares that has carried them to a Double Top breakout over $75.00 and up through $80.00 to a new all-time high.
Next potential resistance tests on trend appear near $85.30, $94.15, and $99.95, based on vertical and horizontal counts with the last aligning with the $100.00 round number. Initial support appears near$74.25 based on a 3-box reversal.
With a perfect SMAX score of 10, TIH.TO is exhibiting near-term strength across the asset classes.
Disclaimer: SIACharts Inc. specifically represents that it does not give investment advice or advocate the purchase or sale of any security or investment whatsoever. This information has been prepared without regard to any particular investors investment objectives, financial situation, and needs. None of the information contained in this document constitutes an offer to sell or the solicitation of an offer to buy any security or other investment or an offer to provide investment services of any kind. As such, advisors and their clients should not act on any recommendation (express or implied) or information in this report without obtaining specific advice in relation to their accounts and should not rely on information herein as the primary basis for their investment decisions. Information contained herein is based on data obtained from recognized statistical services, issuer reports or communications, or other sources, believed to be reliable. SIACharts Inc. nor its third party content providers make any representations or warranties or take any responsibility as to the accuracy or completeness of any recommendation or information contained herein and shall not be liable for any errors, inaccuracies or delays in content, or for any actions taken in reliance thereon. Any statements nonfactual in nature constitute only current opinions, which are subject to change without notice.