


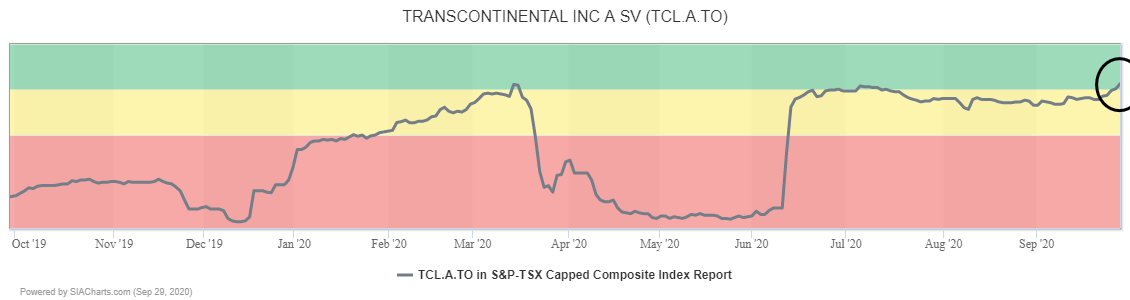
Commercial printer Transcontinental Inc. (TCL.A.TO) has returned to the Green Favored Zone of the SIA S&P/TSX Composite Index report for the first time since July after moving up 6 spots yesterday.
Back in the spring a successful retest of support near $10.00 followed by a rally that snapped a long-term downtrend line, Trancontinental (TCL.A.TO) shares have been building a base for recovery with a bullish Ascending Triangle forming. The shares have been approaching the top of the triangle recently, where a breakout would confirm the start of a new uptrend.
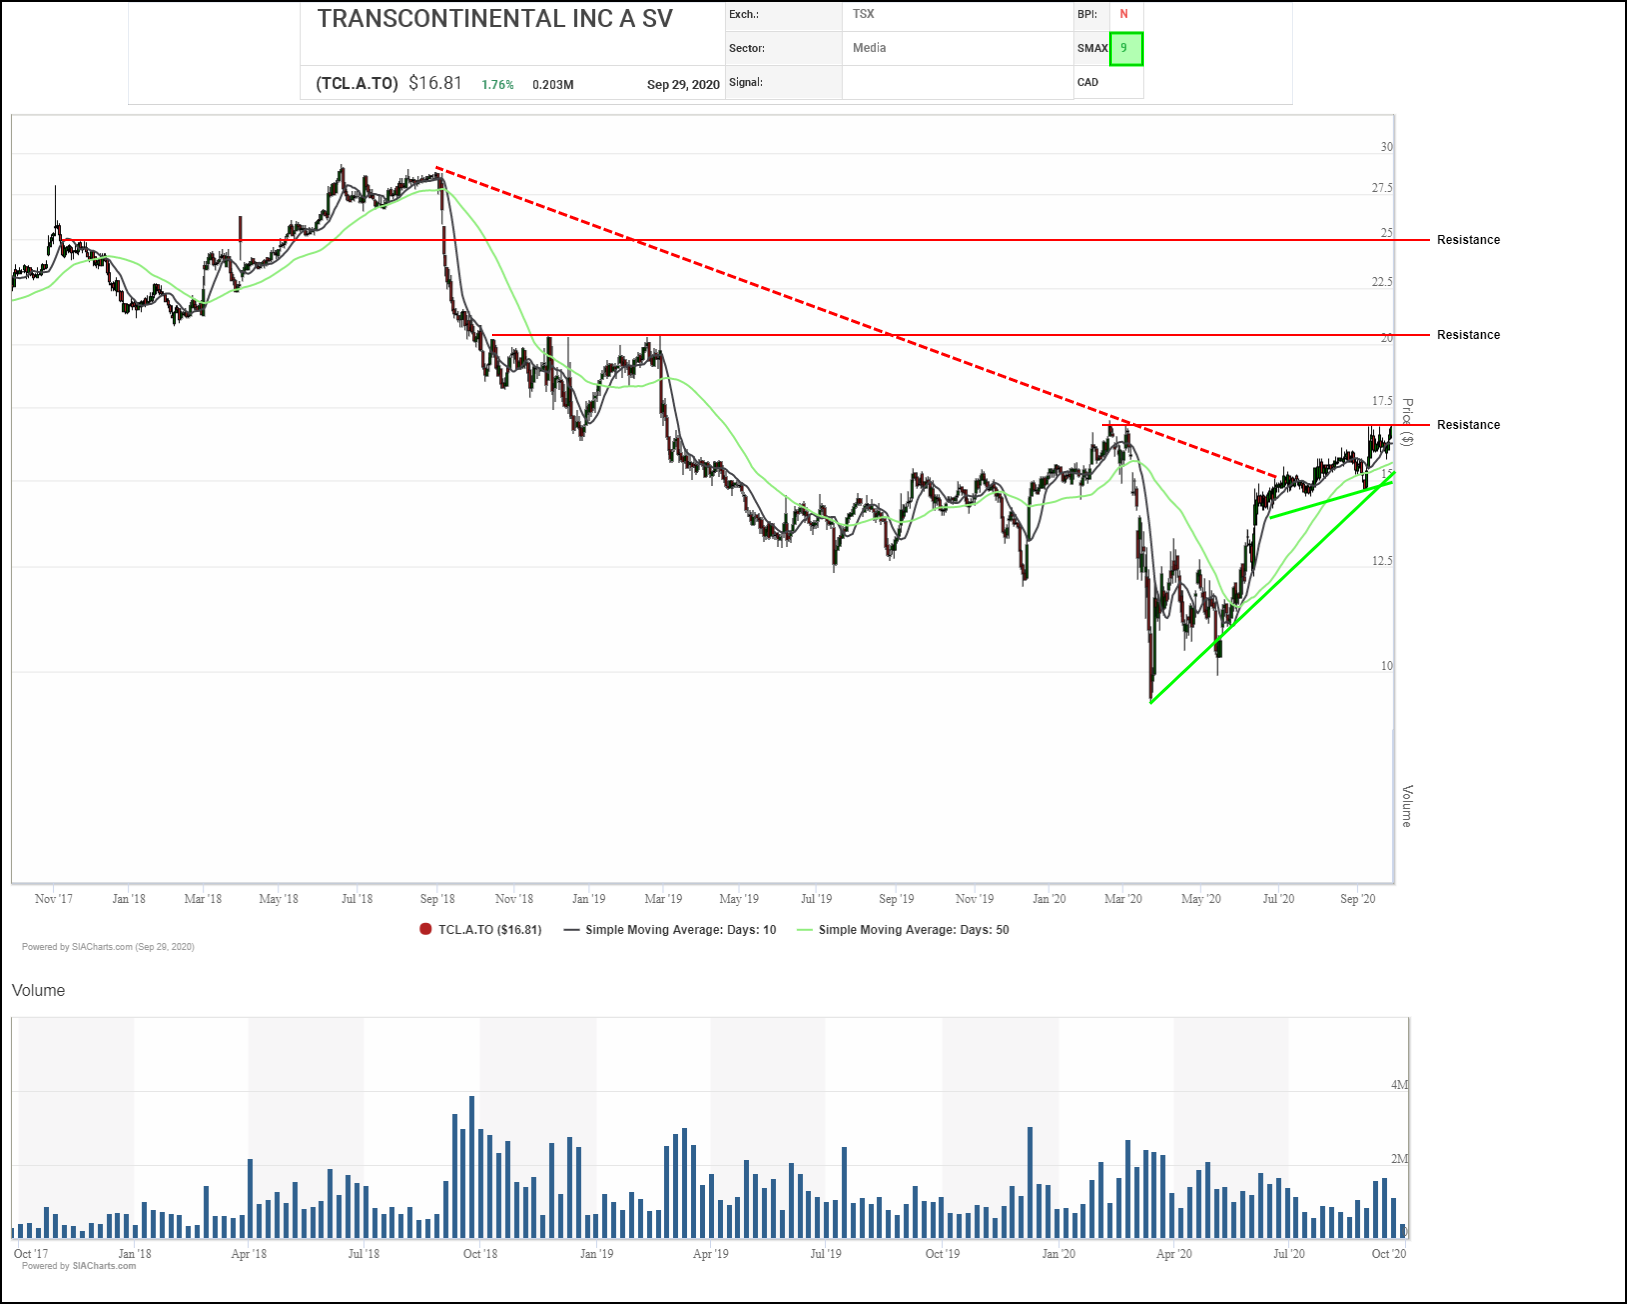
On a breakout, next potential resistance zones may appear between $20.00 and $21.00 where a round number and prior resistance converge, then $24.00 to $25.00 where a measured move and a round number converge. Underlying uptrend support currently appears near $15.00.
Back in June, Transcontinental Inc. (TCL.A.TO) shares completed a bullish Triple Top pattern and haven’t looked back, steadily climbing for the last three months except for one 3-box correction which ended with the shares completing a bullish Double Top pattern and resuming their upward trend.
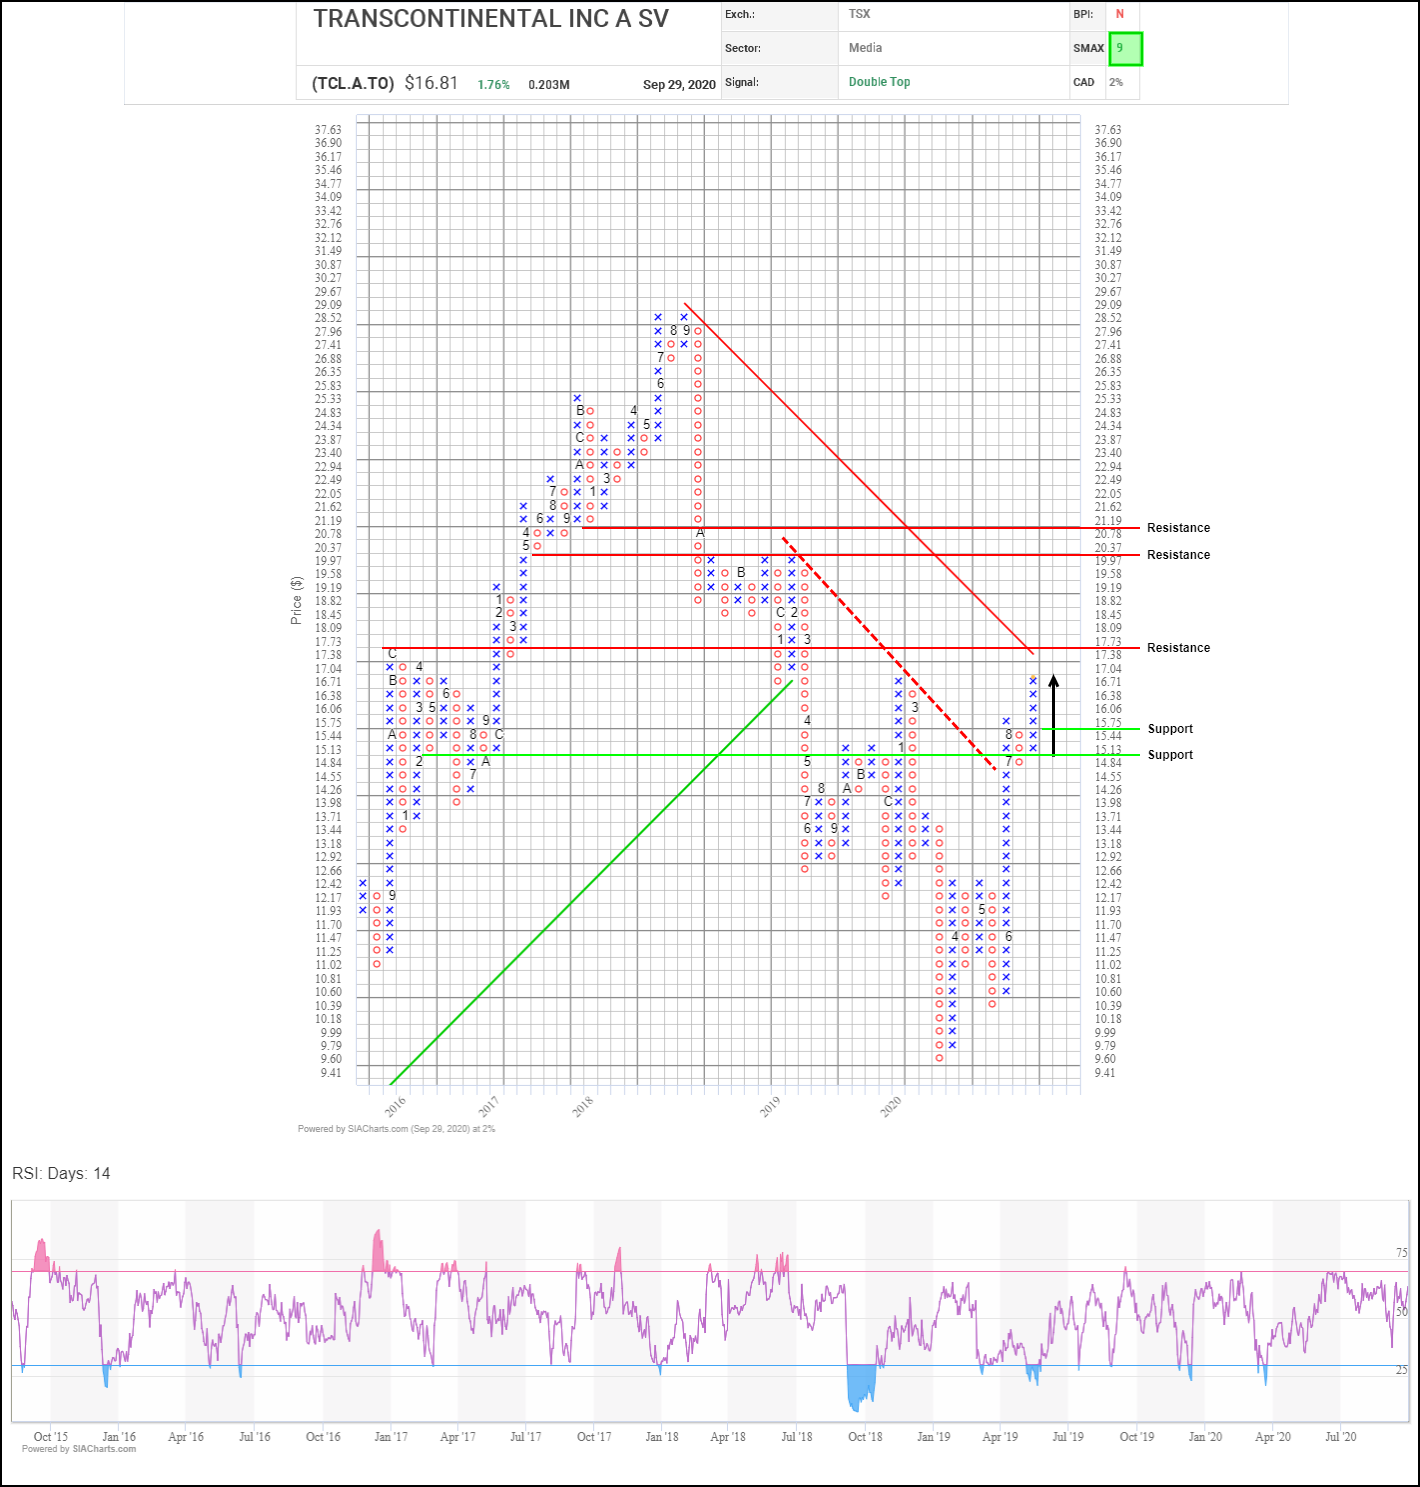
Initial upside resistance may appear at a downtrend line near $17.75, then the $20.00 round number, $20.40 where previous column highs/lows cluster, and $21.20 based on a horizontal count. Initial support appears near $15.45 based on a 3-box reversal.
With a bullish SMAX score of 9, TCL.A.TO is exhibiting near-term strength against the asset classes.
Disclaimer: SIACharts Inc. specifically represents that it does not give investment advice or advocate the purchase or sale of any security or investment whatsoever. This information has been prepared without regard to any particular investors investment objectives, financial situation, and needs. None of the information contained in this document constitutes an offer to sell or the solicitation of an offer to buy any security or other investment or an offer to provide investment services of any kind. As such, advisors and their clients should not act on any recommendation (express or implied) or information in this report without obtaining specific advice in relation to their accounts and should not rely on information herein as the primary basis for their investment decisions. Information contained herein is based on data obtained from recognized statistical services, issuer reports or communications, or other sources, believed to be reliable. SIACharts Inc. nor its third party content providers make any representations or warranties or take any responsibility as to the accuracy or completeness of any recommendation or information contained herein and shall not be liable for any errors, inaccuracies or delays in content, or for any actions taken in reliance thereon. Any statements nonfactual in nature constitute only current opinions, which are subject to change without notice.


