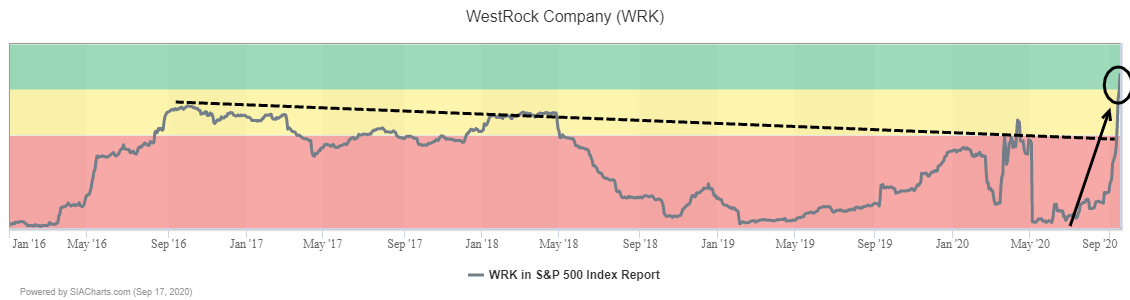
Packaging producer WestRock (WRK) has been soaring up the rankings in the SIA S&P 500 Index Report, climbing 47 spots yesterday and 348 spots in the last month. Yesterday, the shares entered the Green Favored Zone for the first time since the current record started in January of 2016.
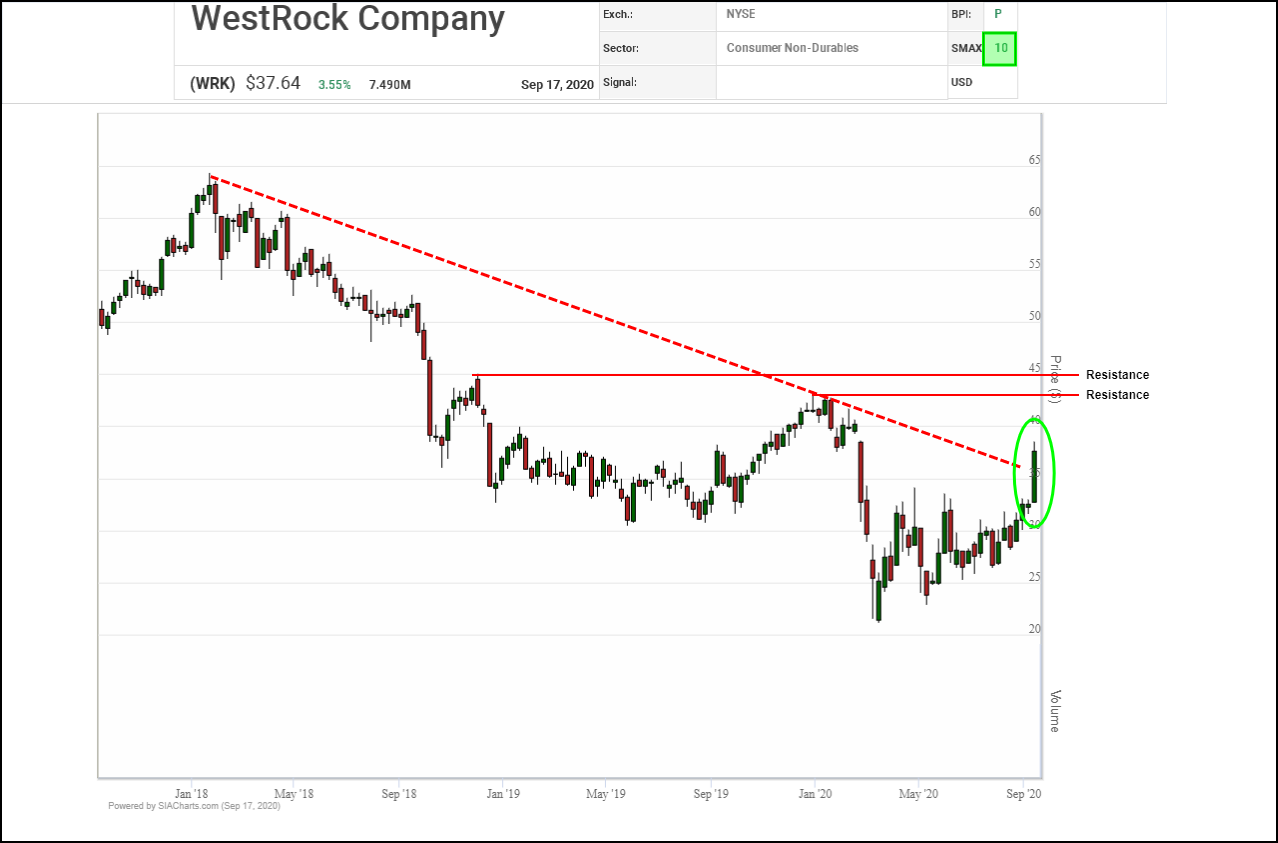
WestRock Company (WRK) shares staged a major breakout yesterday, blasting through $35.00 which reverses polarity to become initial support, and snapping a long-term downtrend line. With accumulation accelerating, next potential resistance tests appear near $42.75 and $45.00 based on previous highs, then $46.00 based on a measured move and the $50.00 round number.
Earlier this year, a long-term downtrend in WestRock (WRK) shares finally bottomed out. Coming out of a summer of base-building, the shares have embarked on a new uptrend this month, snapping downtrend lines and completing multiple Double and Spread Double Top patterns.
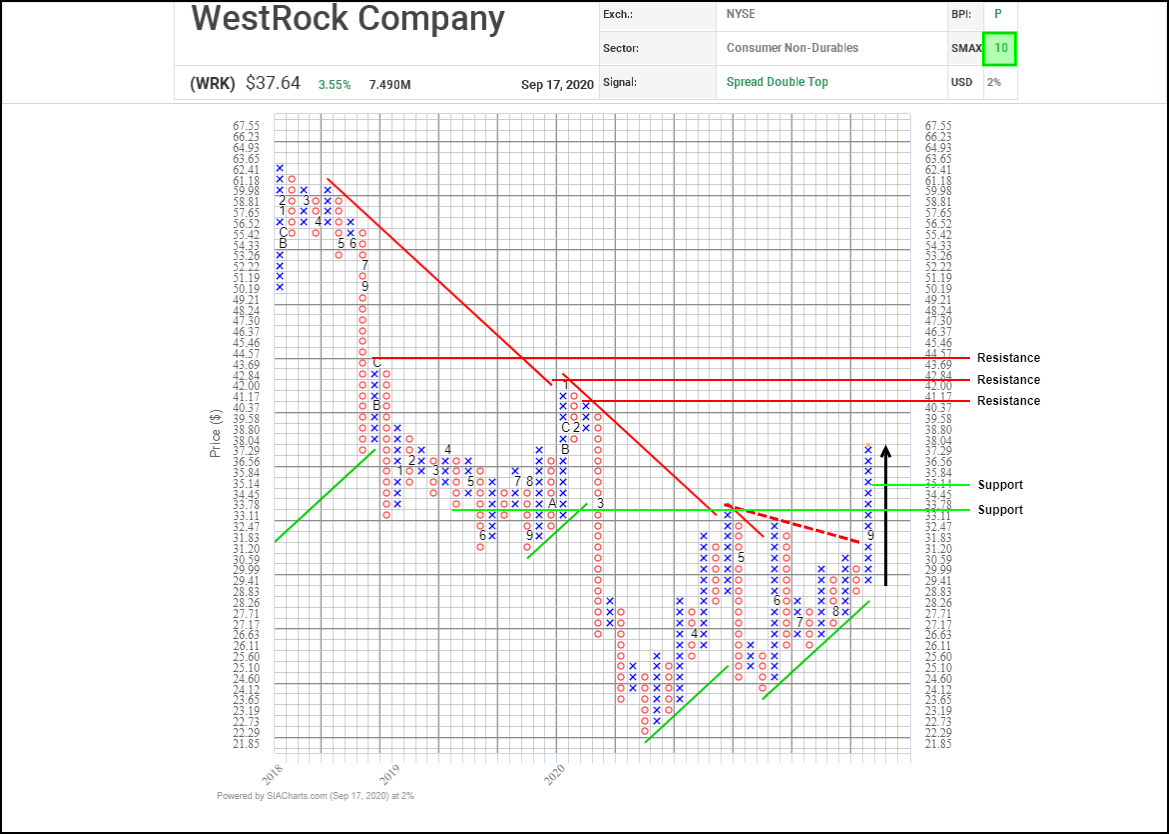
Next potential upside resistance tests appear near $41.15, $42.85 and $44.55 based on a combination of previous column highs and horizontal counts. Initial support appears near $34.45 based on a 3-box reversal, then $33.10 based on a retest of a recent breakout point.
With a perfect SMAX score of 10, WRK is exhibiting near-term strength across the asset classes.
Disclaimer: SIACharts Inc. specifically represents that it does not give investment advice or advocate the purchase or sale of any security or investment whatsoever. This information has been prepared without regard to any particular investors investment objectives, financial situation, and needs. None of the information contained in this document constitutes an offer to sell or the solicitation of an offer to buy any security or other investment or an offer to provide investment services of any kind. As such, advisors and their clients should not act on any recommendation (express or implied) or information in this report without obtaining specific advice in relation to their accounts and should not rely on information herein as the primary basis for their investment decisions. Information contained herein is based on data obtained from recognized statistical services, issuer reports or communications, or other sources, believed to be reliable. SIACharts Inc. nor its third party content providers make any representations or warranties or take any responsibility as to the accuracy or completeness of any recommendation or information contained herein and shall not be liable for any errors, inaccuracies or delays in content, or for any actions taken in reliance thereon. Any statements nonfactual in nature constitute only current opinions, which are subject to change without notice.