

Delta Air Lines (DAL) returned to the Green Favored Zone of the SIA S&P 500 Index Report yesterday. With the exception of a few days in June, DAL has been stuck in the yellow and red zones since April of 2016. Delta climbed 28 spots yesterday and is up 289 spots in the last month.
Since bottoming out in May, Delta Air Lines (DAL) shares have been steadily regaining lost altitude, initially rallying toward $37.50 then establishing support at a higher low near $25.00 before regaining $30.00 again and advancing toward $35.00.
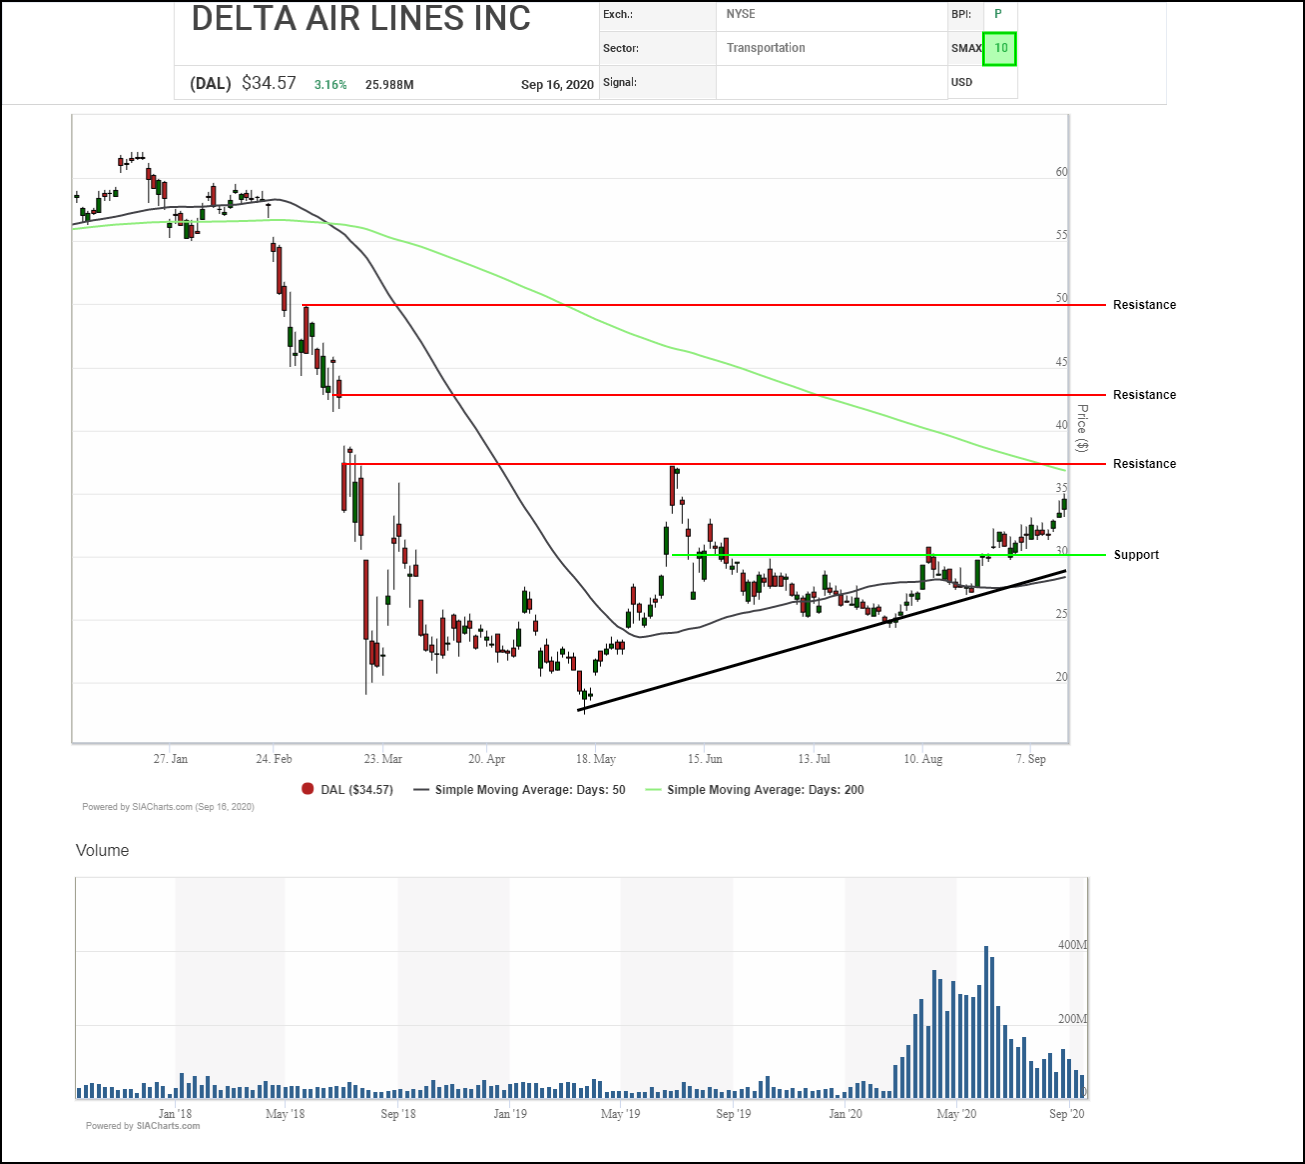
Initial upside resistance appears in the $37.00 to $37.50 area between the 20-day average, previous peak and the bottom of an older gap. A breakthrough there would confirm the start of a new uptrend with next resistance tests after that potentially near $42.50, the top of an old gap, then $50.00 where a measured move and a round number converge. Initial support appears near $32.50 then $30.00.
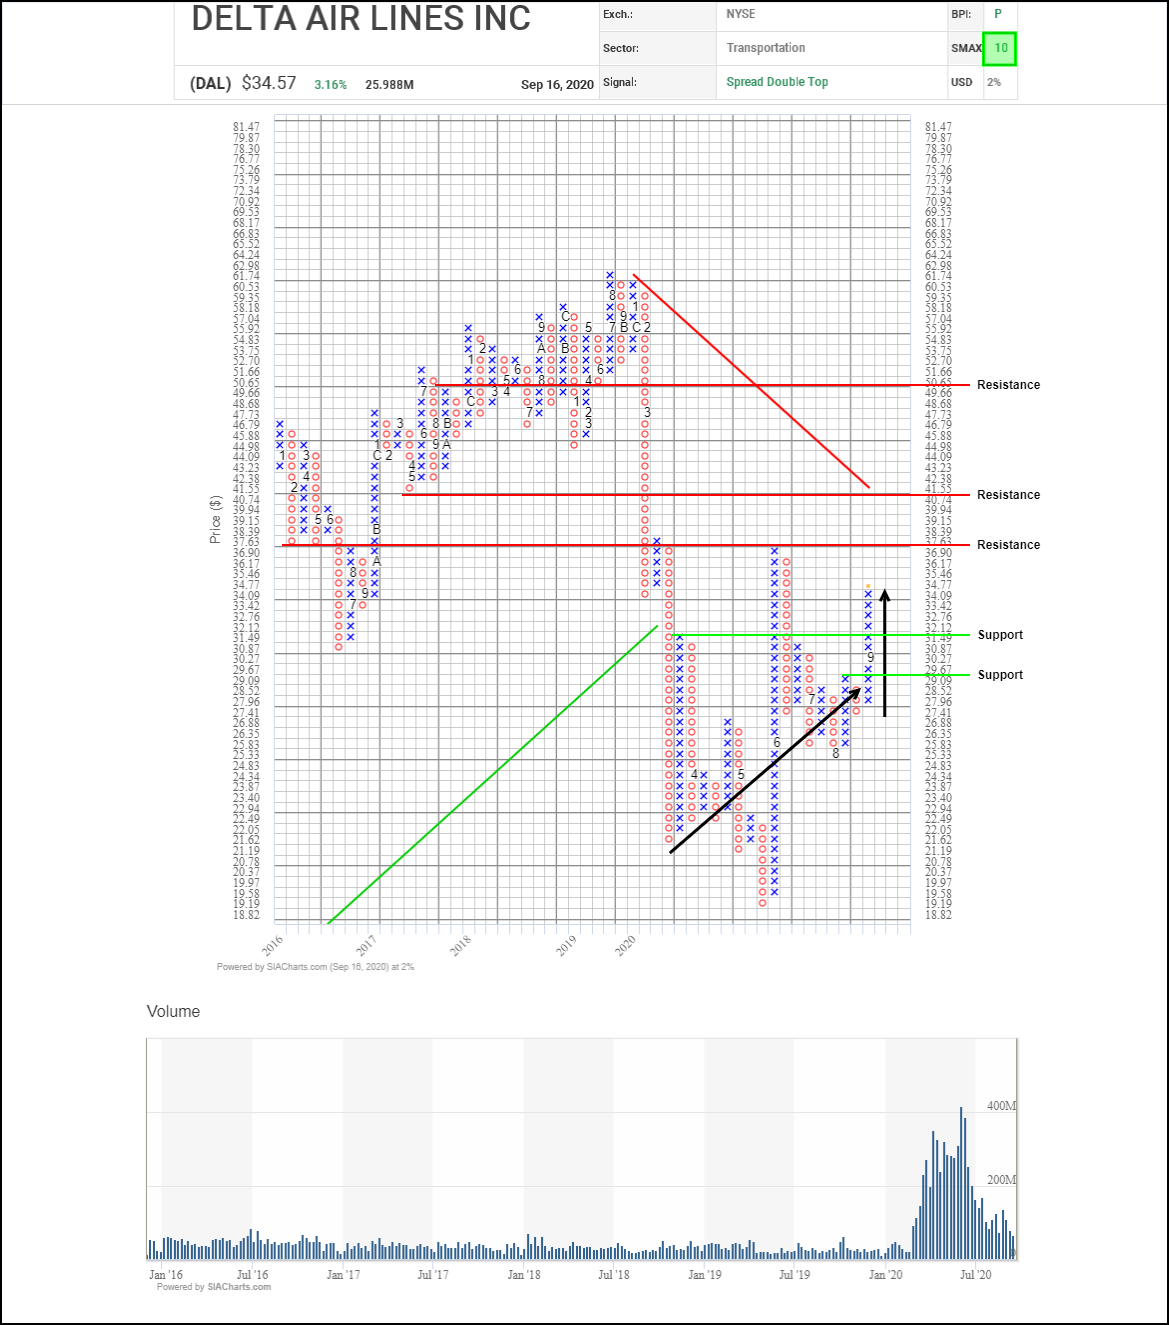
Recovery momentum in Delta Air Lines (DAL) has been accelerating lately with the shares completing a bullish Double Top then a bullish Spread Double Top and advancing on $34.50 in recent weeks. Initial upside resistance may appear at recent highs and a horizontal count in the $37.60 to $38.50 area, followed by a downtrend line near $41.50 and the $50.00 round number on trend. Initial support appears near $31.50 based on a 3-box reversal.
With a perfect SMAX score of 10, DAL is exhibiting near-term strength across the asset classes.
Disclaimer: SIACharts Inc. specifically represents that it does not give investment advice or advocate the purchase or sale of any security or investment whatsoever. This information has been prepared without regard to any particular investors investment objectives, financial situation, and needs. None of the information contained in this document constitutes an offer to sell or the solicitation of an offer to buy any security or other investment or an offer to provide investment services of any kind. As such, advisors and their clients should not act on any recommendation (express or implied) or information in this report without obtaining specific advice in relation to their accounts and should not rely on information herein as the primary basis for their investment decisions. Information contained herein is based on data obtained from recognized statistical services, issuer reports or communications, or other sources, believed to be reliable. SIACharts Inc. nor its third party content providers make any representations or warranties or take any responsibility as to the accuracy or completeness of any recommendation or information contained herein and shall not be liable for any errors, inaccuracies or delays in content, or for any actions taken in reliance thereon. Any statements nonfactual in nature constitute only current opinions, which are subject to change without notice.