


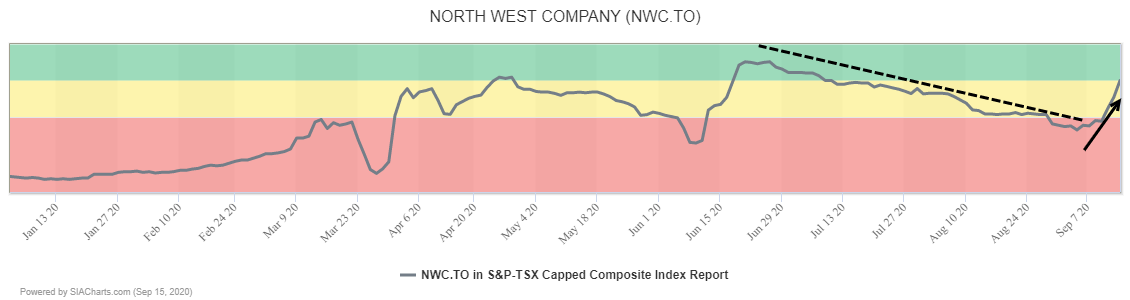
In the last week, The North West Company (NWC.TO) has soared 60 spots in the SIA S&P/TSX Composite Index Report climbing from the red zone to the top of the Yellow Neutral Zone, one spot outside of the Green Zone.
Since bottoming out in March, shares have been under renewed accumulation. Back in June, they broke out over $27.50, which reversed polarity and became support. This week, the shares have broken through $31.50 to a new high, signaling the start of a new upleg.
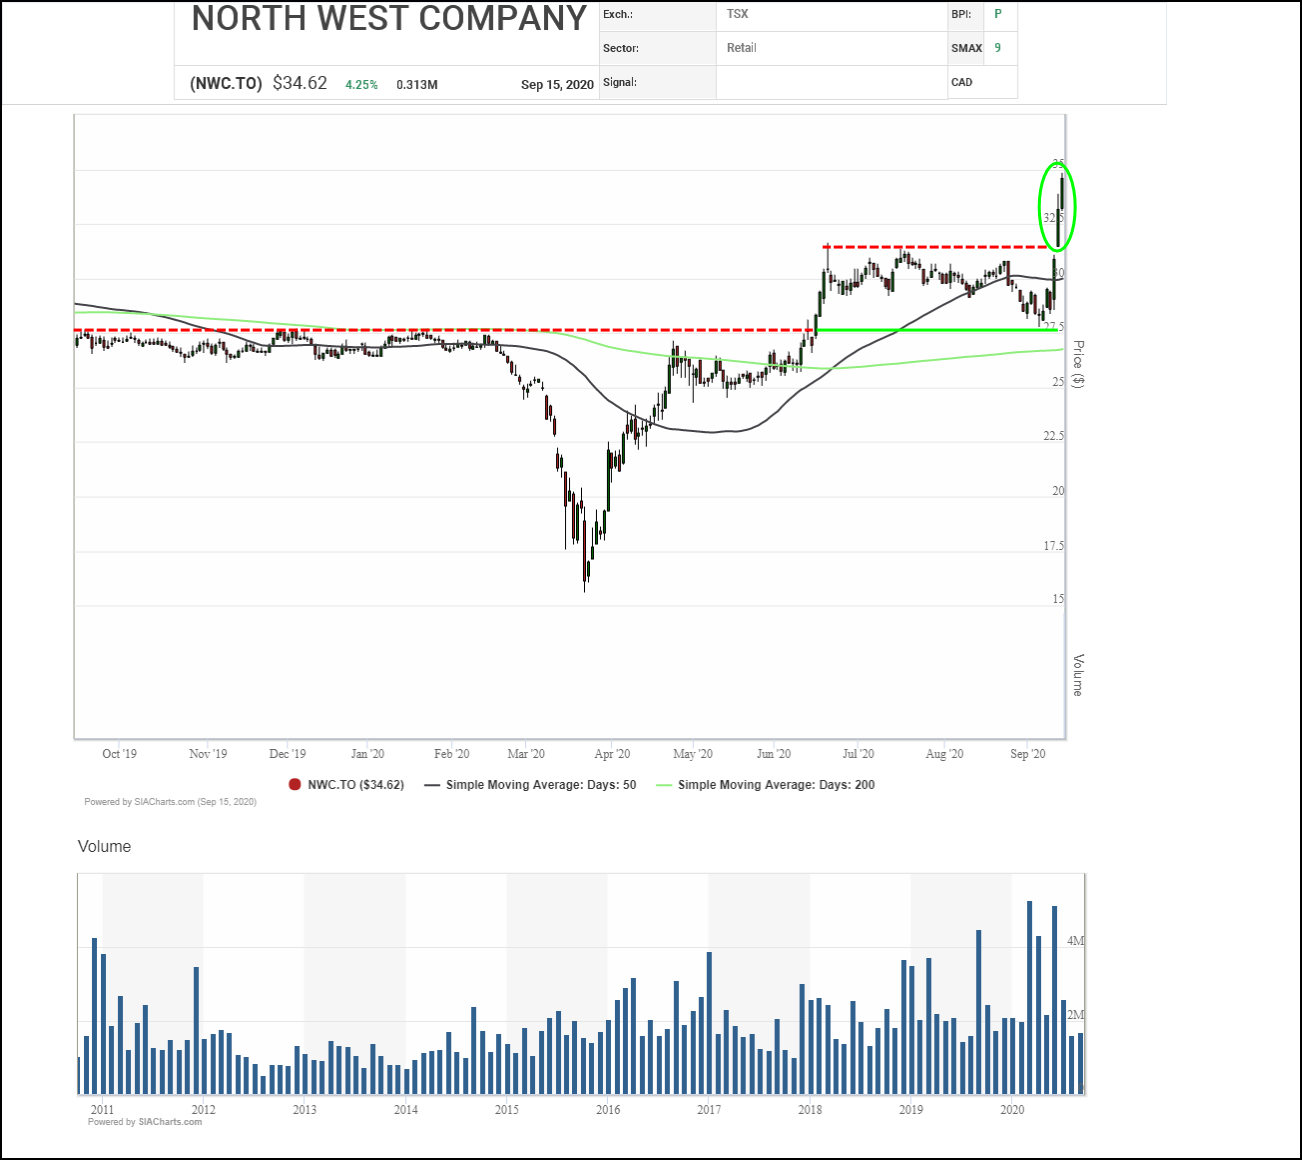
Based on measured moves, potential upside resistance appears near $35.50, $38.50, $39.50, and $43.50 on trend, along with the $40.00 round number. Initial support appears near the $31.50 breakout point, then the $30.00 round number.
It has been quite a year for The North West Company's (NWC.TO) shares, plunging from a high near $30.00 to a low near $16.00 between September 2019 and March 2020, then clawing all of those losses back and completing a big round trip by August. Recently, the shares broke out over $31.50 to a new high, completing a bullish Double Top pattern and confirming that the long-term underlying uptrend has resumed.
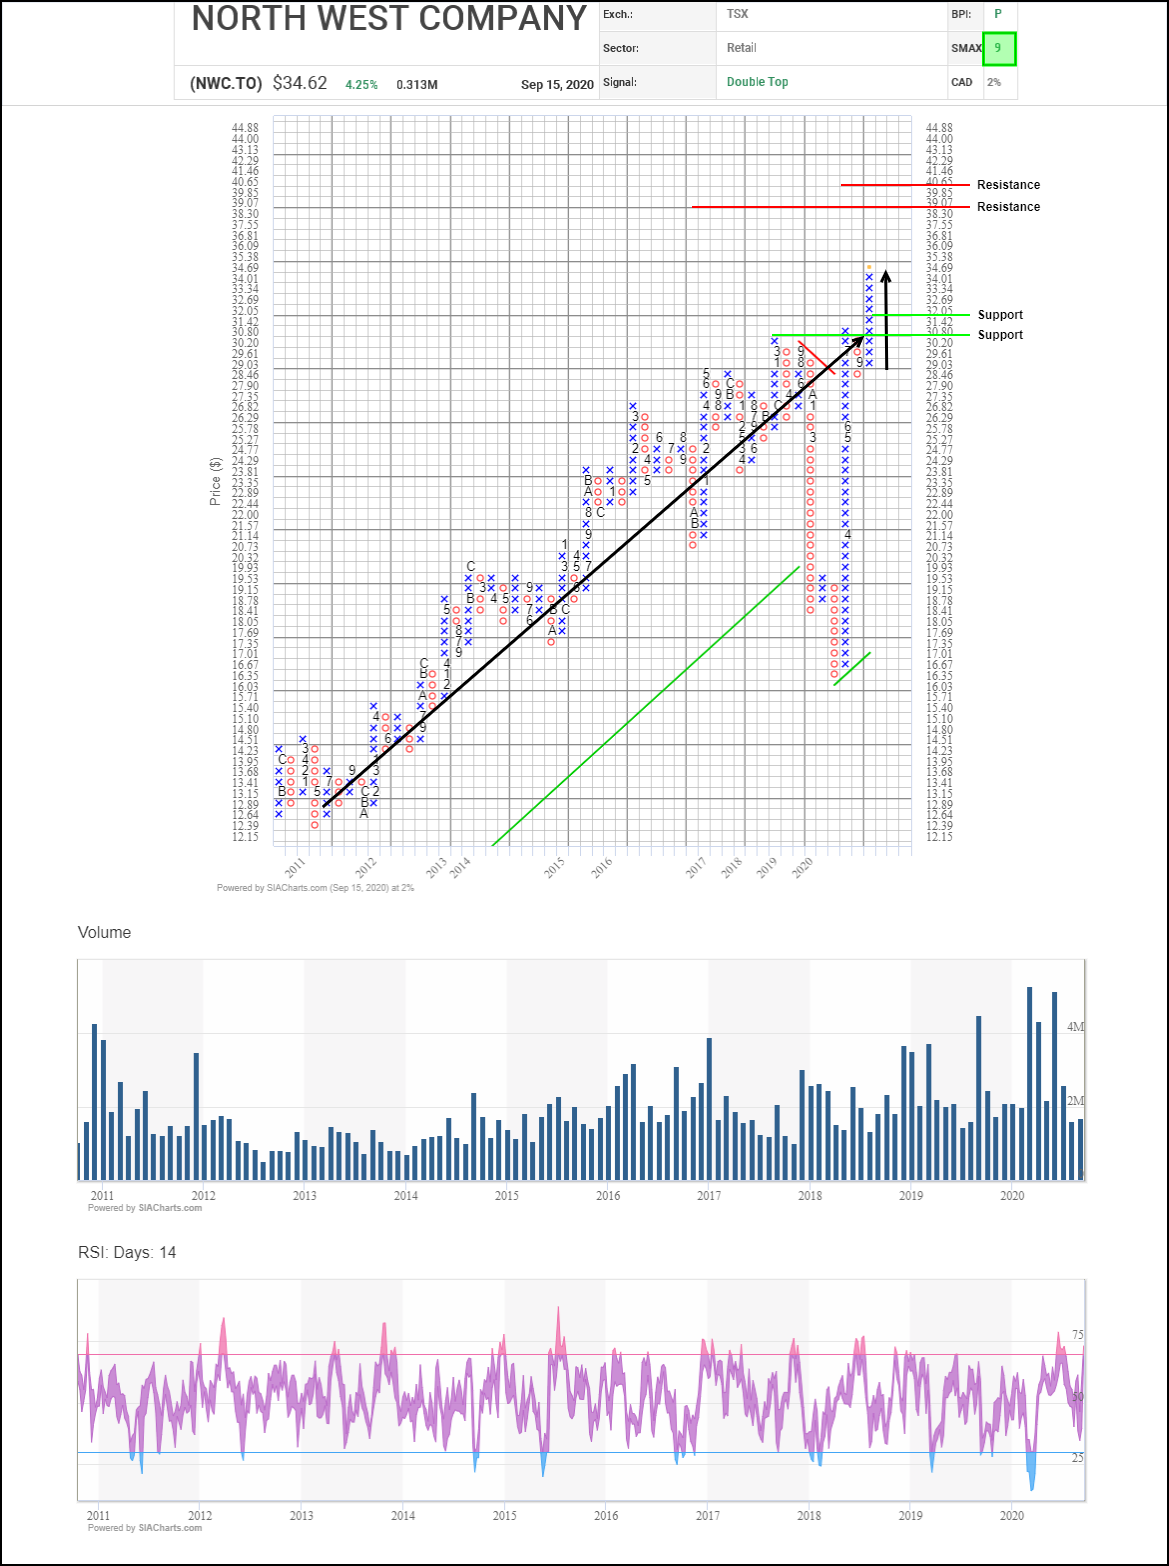
Next potential upside resistance on trend appears in the $39.00 to $40.65 area where vertical and horizontal counts converge with the $40,00 round number. Initial support appears near $31.40 based on a 3-box reversal.
With a bullish SMAX score of 9, NWC.TO is exhibiting near-term strength against the asset classes.
Disclaimer: SIACharts Inc. specifically represents that it does not give investment advice or advocate the purchase or sale of any security or investment whatsoever. This information has been prepared without regard to any particular investors investment objectives, financial situation, and needs. None of the information contained in this document constitutes an offer to sell or the solicitation of an offer to buy any security or other investment or an offer to provide investment services of any kind. As such, advisors and their clients should not act on any recommendation (express or implied) or information in this report without obtaining specific advice in relation to their accounts and should not rely on information herein as the primary basis for their investment decisions. Information contained herein is based on data obtained from recognized statistical services, issuer reports or communications, or other sources, believed to be reliable. SIACharts Inc. nor its third party content providers make any representations or warranties or take any responsibility as to the accuracy or completeness of any recommendation or information contained herein and shall not be liable for any errors, inaccuracies or delays in content, or for any actions taken in reliance thereon. Any statements nonfactual in nature constitute only current opinions, which are subject to change without notice.


