
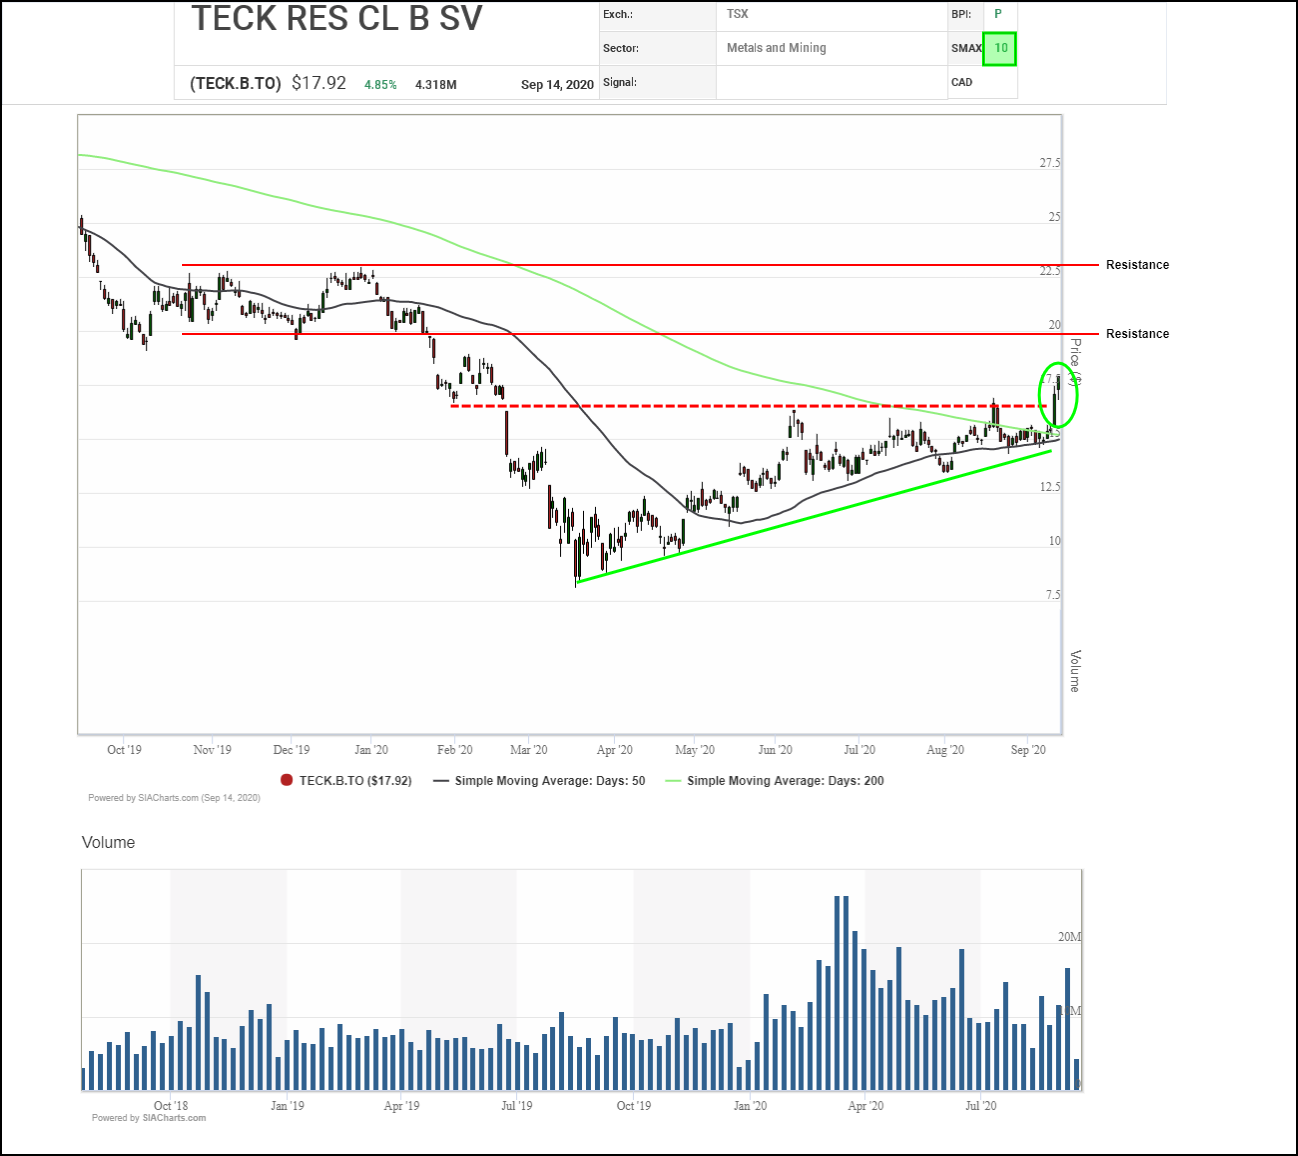
Base metal miner Teck Resources Ltd.* (TECK.B.TO) has climbed up to the top spot in the Green Favored Zone of the SIA S&P/60 Index Report, after climbing 2 spots yesterday. The shares gained 4.8% yesterday and are up 17.0% in the last week.
*Shares of Teck Resources are held in some portfolios managed by SIA Wealth Management.
Last Friday, Teck Resources Ltd.* (TECK.B.TO) shares broke through $16.90, snapping a downtrend, ending a 3-month period of consolidation, completing a bullish Double Top pattern, confirming a previous bullish Spread double top and signaling the start of a new upleg.
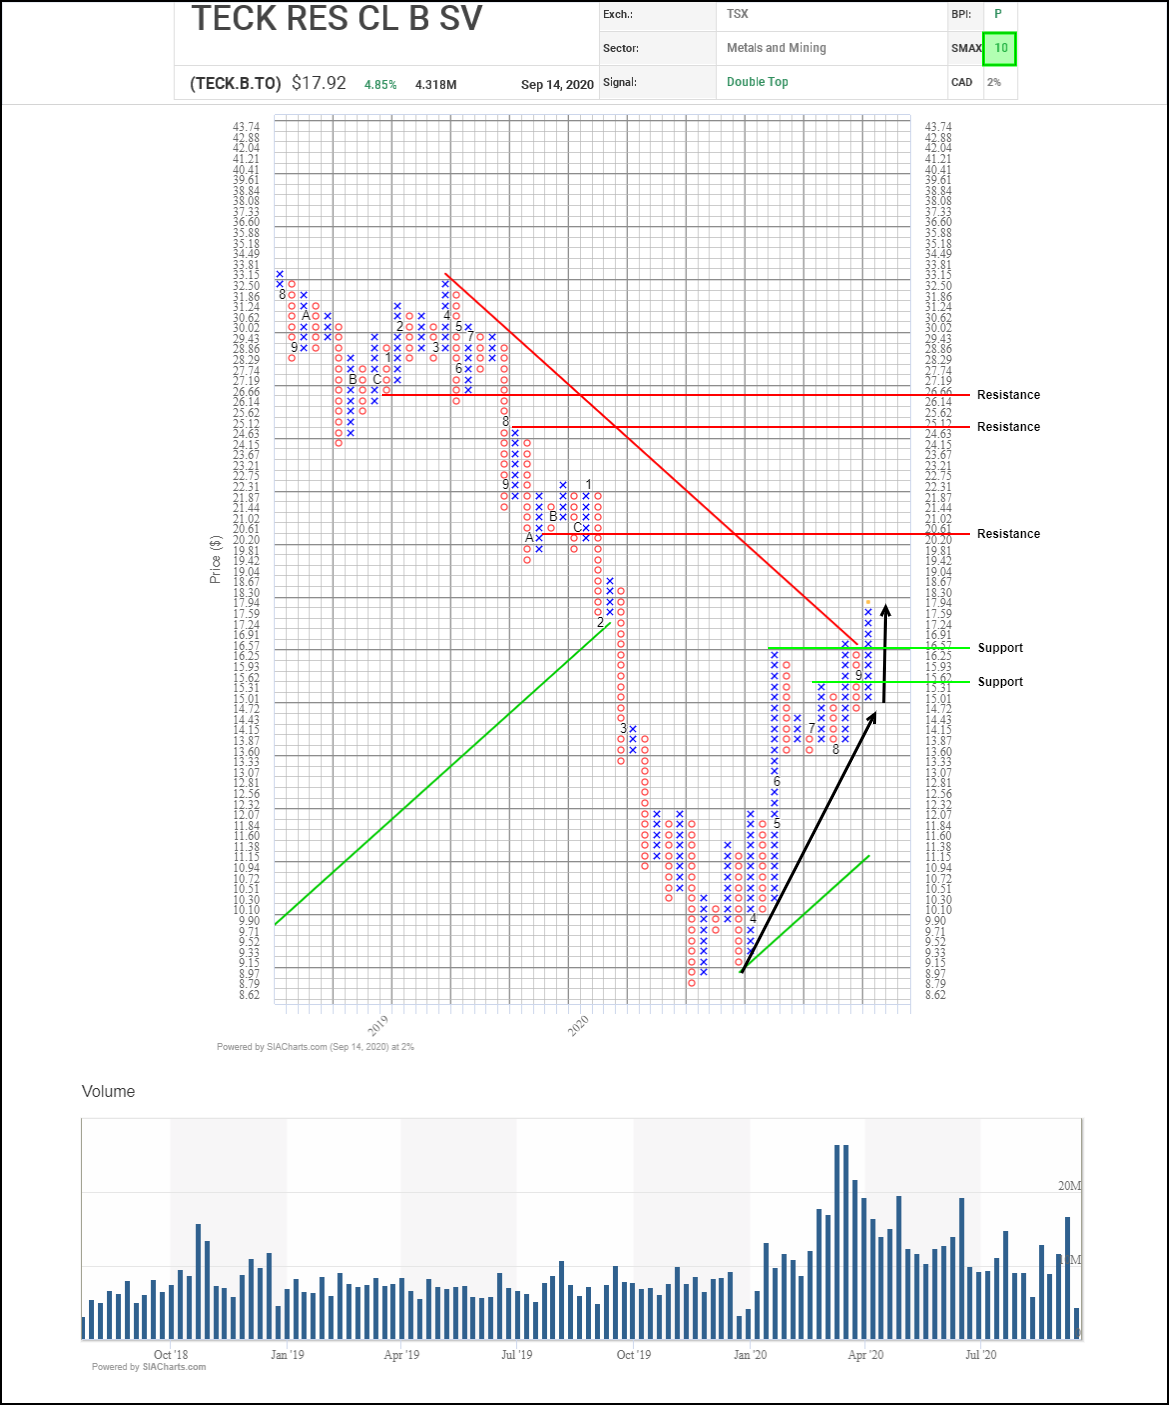
The next potential upside resistance test on trend appears in the $20.00 to $21.00 area where a round number and two horizontal counts converge, followed by the $25.00 round number and $26.65 based on a vertical count. Initial support appears near $16.25 where a 3-box reversal and a retest of a recent breakout point converge.
With a perfect SMAX score of 10, TECK.B.TO is exhibiting near-term strength across the asset classes.
*Shares of Teck Resources are held in some portfolios managed by SIA Wealth Management.
Disclaimer: SIACharts Inc. specifically represents that it does not give investment advice or advocate the purchase or sale of any security or investment whatsoever. This information has been prepared without regard to any particular investors investment objectives, financial situation, and needs. None of the information contained in this document constitutes an offer to sell or the solicitation of an offer to buy any security or other investment or an offer to provide investment services of any kind. As such, advisors and their clients should not act on any recommendation (express or implied) or information in this report without obtaining specific advice in relation to their accounts and should not rely on information herein as the primary basis for their investment decisions. Information contained herein is based on data obtained from recognized statistical services, issuer reports or communications, or other sources, believed to be reliable. SIACharts Inc. nor its third party content providers make any representations or warranties or take any responsibility as to the accuracy or completeness of any recommendation or information contained herein and shall not be liable for any errors, inaccuracies or delays in content, or for any actions taken in reliance thereon. Any statements nonfactual in nature constitute only current opinions, which are subject to change without notice.