
Since the end of the market sell off in late March, we have seen Lumber oriented stocks very strong of late as this sector seems to have enjoyed a very quick recovery since the end of March. The price of Lumber itself has seen a significant price recovery so it is no surprise that Norbord Inc. (OSB.TO) has also benefitted from the underlying commodities price increase.
Norbord Inc. manufactures and sells wood-based panels for retail chains, contractor supply yards, and industrial manufacturers primarily in North America and Europe.
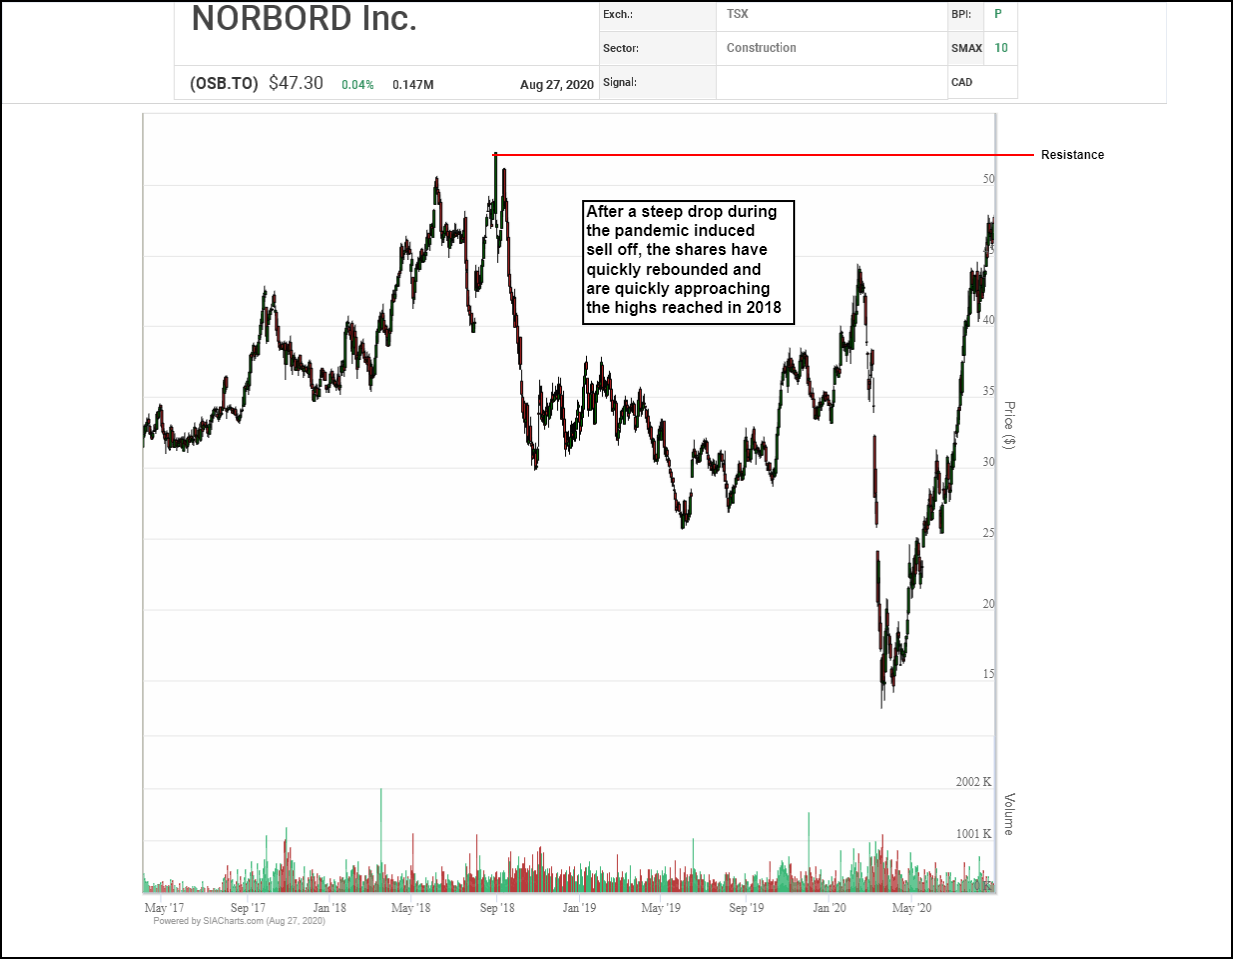
In looking at the candlestick chart, we see that Norbord bottomed out at the $15.00 area. Today the price is at $47.30 and is on its way towards reaching its 2018 high of $58.92. The company reported better than expected earnings on August 5th by beating the estimate by 0.18/share which has given the stock increased momentum into this new upleg.
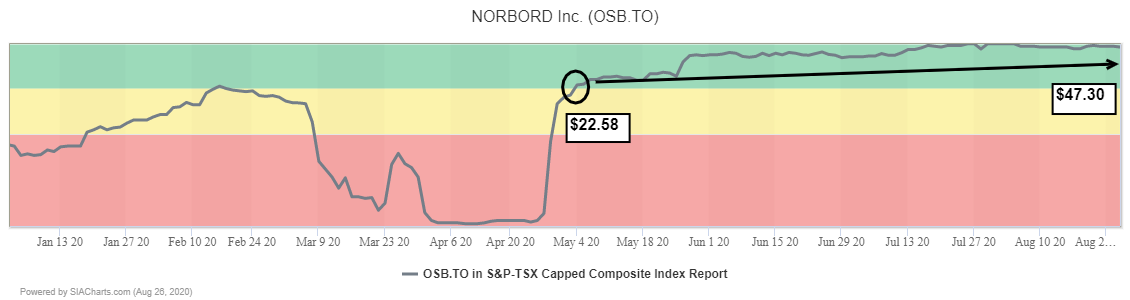
Norbord (OSB.TO) first entered the Favored Zone of the SIA TSX Composite Index Report on May 4th at a price of $22.58. Today the price of the shares is at $47.30 which represents a 110% increase since entering the favored zone. It currently occupies the 3rd spot in the TSX Composite Index Report.
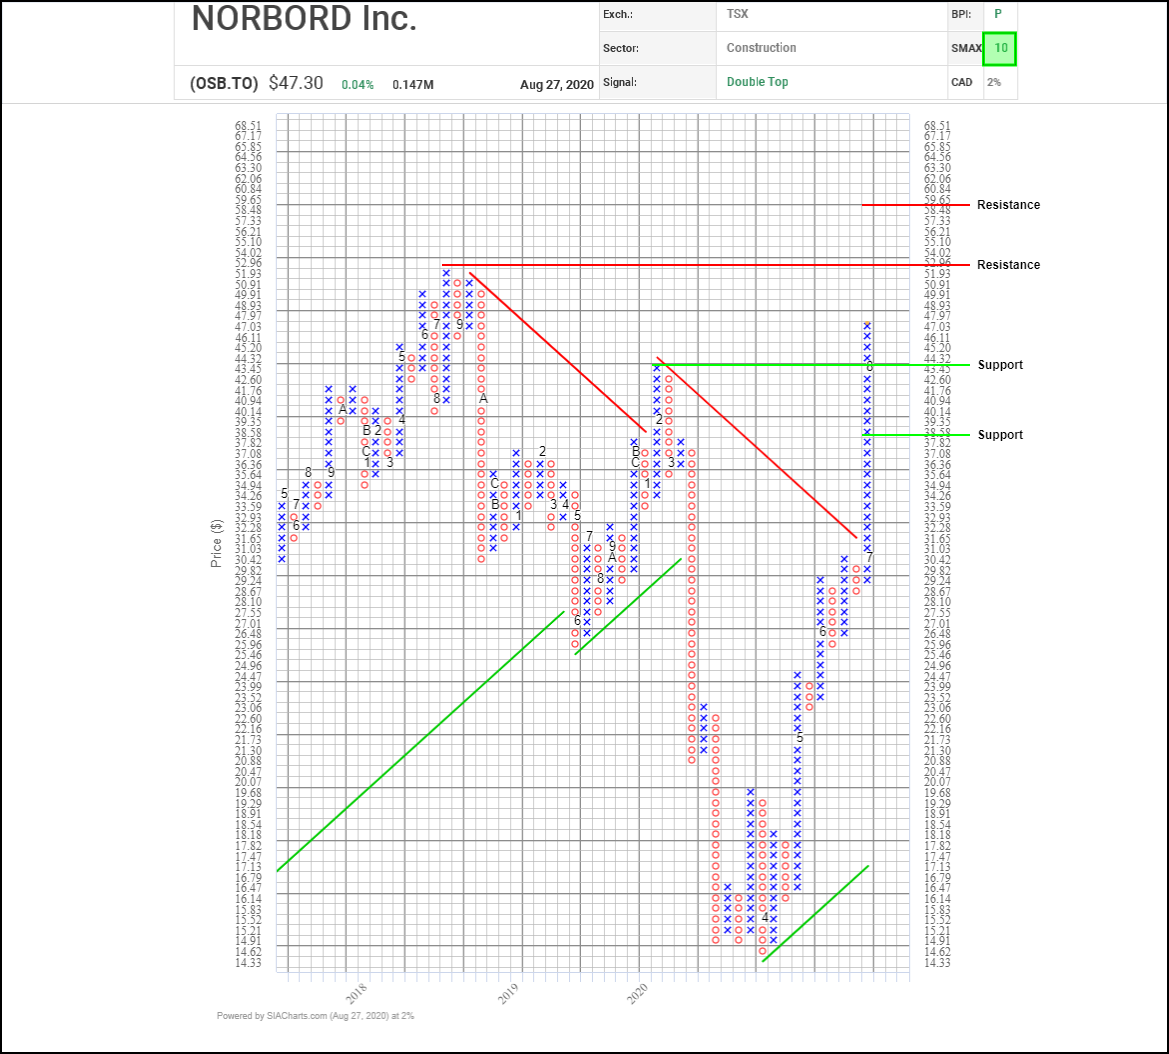
The shares are quickly approaching a resistance level at its 2018 high near $52.96. If it manages to break above this level, the next area of resistance is at $60.00. To the downside, support can be found at its 3-Box Reversal level at a price of $43.45, and below that, the 50% retracement level at $37.82
With an SMAX score of 10 out of 10, Norbord (OSB.TO) is showing near term strength against all asset classes.
Disclaimer: SIACharts Inc. specifically represents that it does not give investment advice or advocate the purchase or sale of any security or investment whatsoever. This information has been prepared without regard to any particular investors investment objectives, financial situation, and needs. None of the information contained in this document constitutes an offer to sell or the solicitation of an offer to buy any security or other investment or an offer to provide investment services of any kind. As such, advisors and their clients should not act on any recommendation (express or implied) or information in this report without obtaining specific advice in relation to their accounts and should not rely on information herein as the primary basis for their investment decisions. Information contained herein is based on data obtained from recognized statistical services, issuer reports or communications, or other sources, believed to be reliable. SIACharts Inc. nor its third party content providers make any representations or warranties or take any responsibility as to the accuracy or completeness of any recommendation or information contained herein and shall not be liable for any errors, inaccuracies or delays in content, or for any actions taken in reliance thereon. Any statements nonfactual in nature constitute only current opinions, which are subject to change without notice.