In todays edition of the Daily Stock Report, we are going to take a look at Adobe Systems Inc. (ADBE) which has been very strong as of late.
Adobe operates as a diversified software company worldwide. Its Digital Media segment provides tools and solutions that enable individuals, small and medium businesses, and enterprises to create, publish, promote, and monetize their digital content.
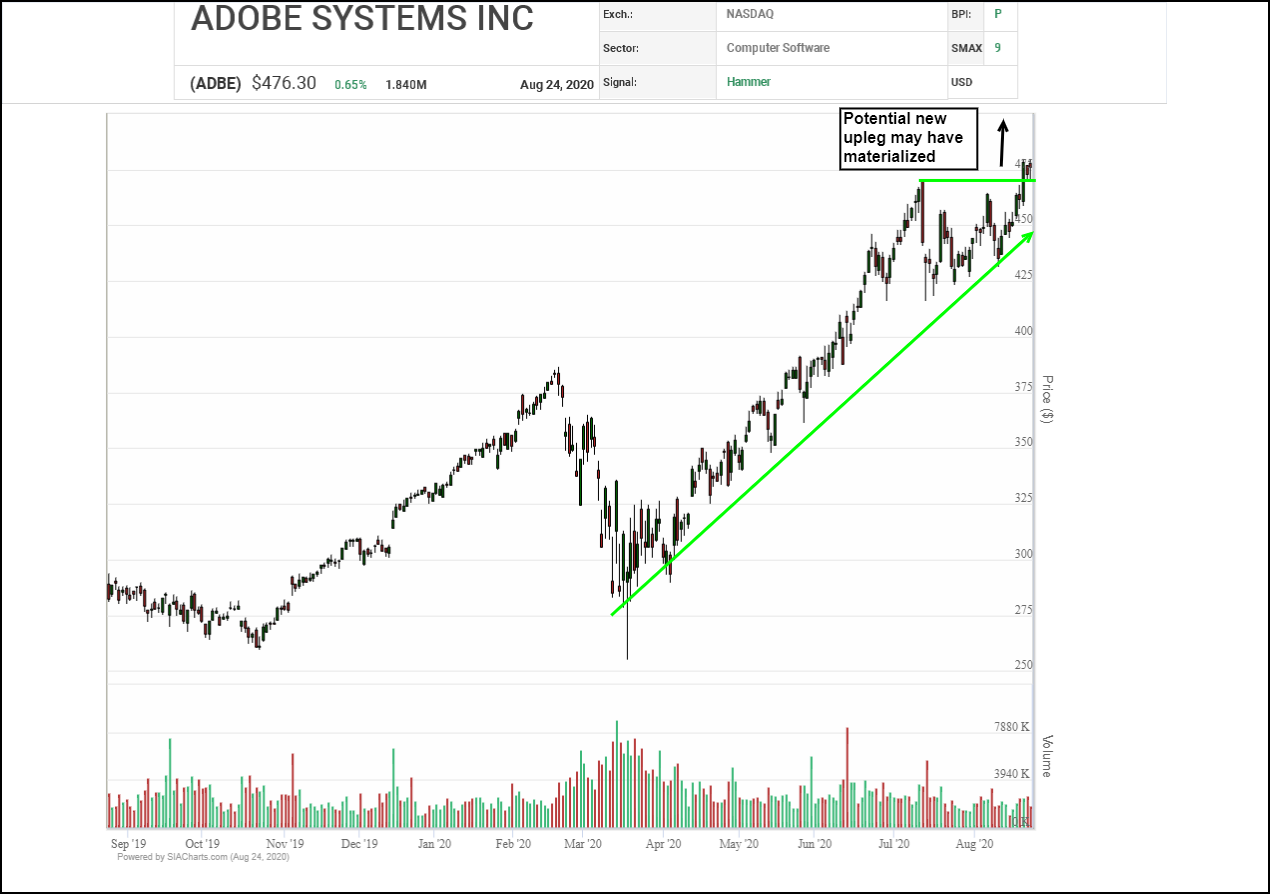
In looking at the Candlestick chart, we see that after finding its footing back in late March when the broader market sell off ended, Adobe has charged ahead to all time highs surpassing its old high back in Feb when the Pandemic induced sell off ensued. We can see that there was brief weakness back in July where it bottomed at approximately the $425 area and then following a short consolidation period from $425.00 to the $470.00 area a new upleg looks to have potentially materialized when it confirmed its breakout point last week.
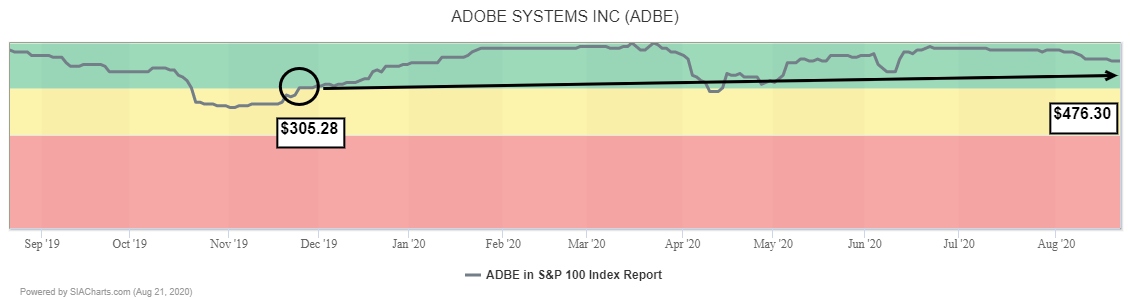
Adobe Systems (ADBE) currently resides in the 11th spot in the SIA S&P 100 Index Report. It first entered the Favored Zone of this report on Nov 25th of last year at a price of $305.28. While it did fall very briefly to the Neutral Zone in April of this year it managed to hold onto its Positive SMAX score throughout. As of Monday’s close the price of the shares is at $476.30.
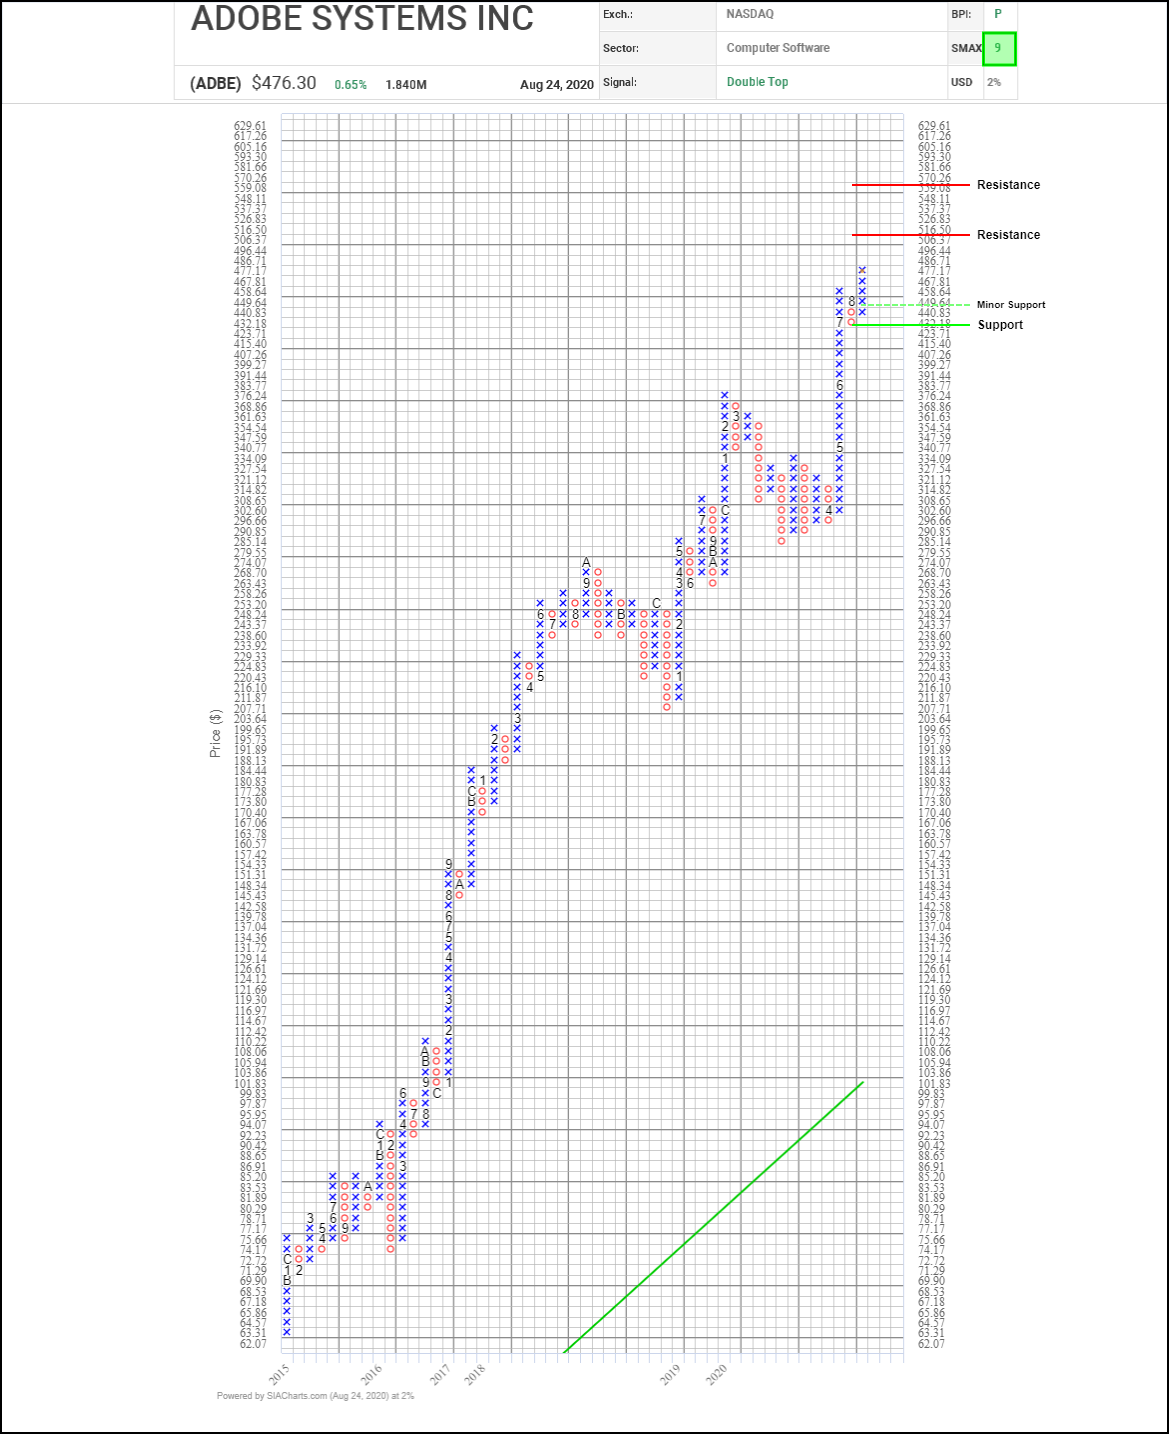
In looking at the Point and Figure chart, it has recently broken out to a new high when it reached above $467.81. Resistance can now be found at $516.50. If it manages to break above this level the next area of resistance is at $570.26. Minor Support is at the 3-Box Reversal level of $440.83 and, below that, $423.71.
With an SMAX of 9 out of 10, ADBE is exhibiting near term strength against all the asset classes.