


Texas Instruments (TXN) has steadily been rising back up the rankings in the SIA S&P 100 Index Report, and recently returned to the Green Favored Zone for the first time since March.
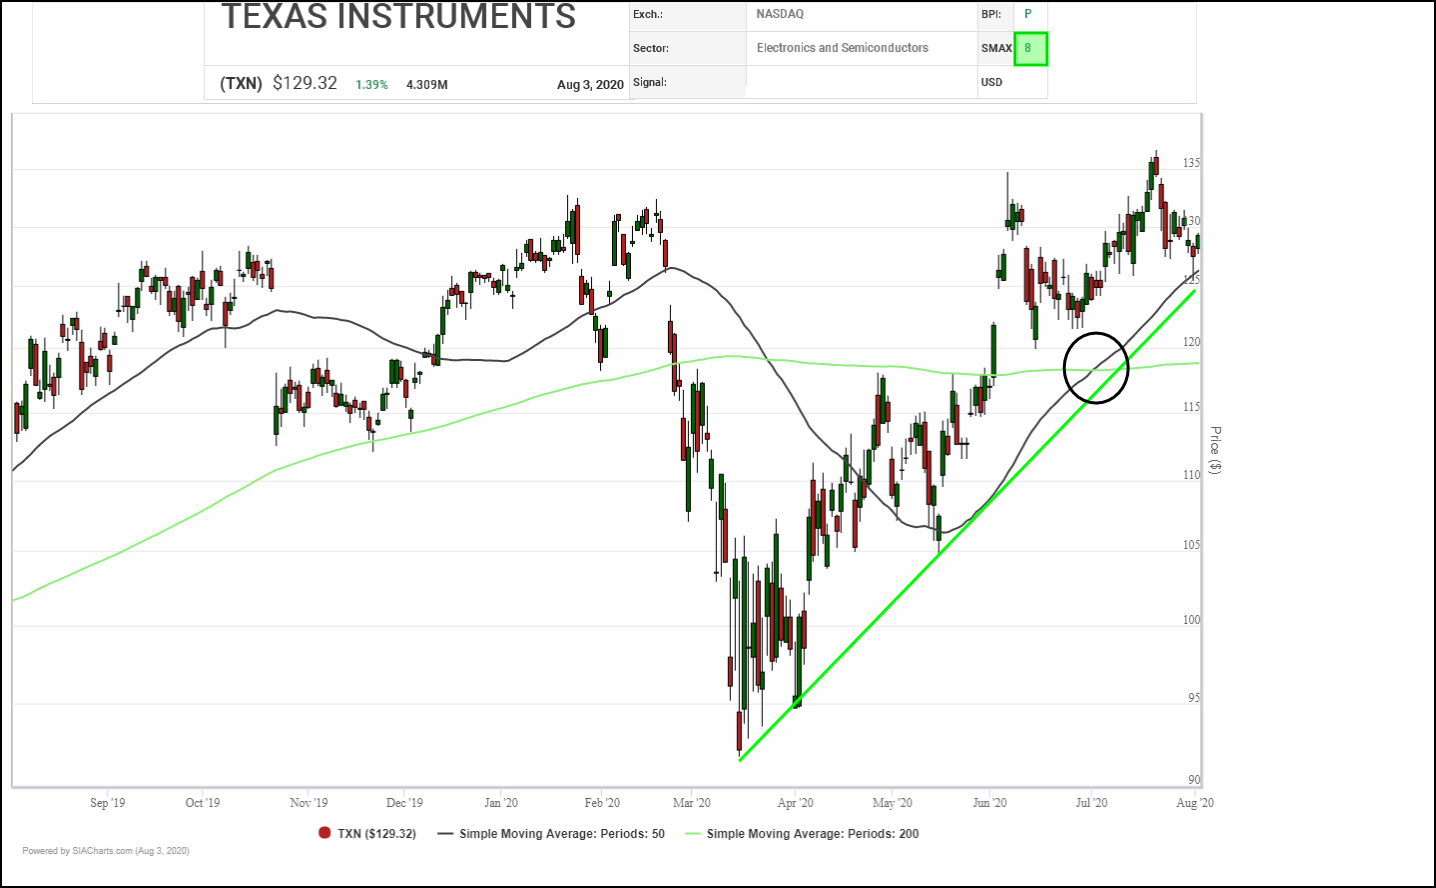
Since bottoming out in March, Texas Instruments (TXN) has been steadily advancing, establishing an uptrend of consistently higher lows, completing a series of bullish Ascending triangle breakouts plus its 50 and 200-day averages have completed a bullish Golden Cross. Last week the shares successfully tested support at their 200-day average near $126.00 and have started to advance once again. Initial resistance appears at the recent high near $136.00, followed by $150.00 where a round number and a measured move converge, and then the $170.00 to $175.00 where a cluster of measured moves appears.
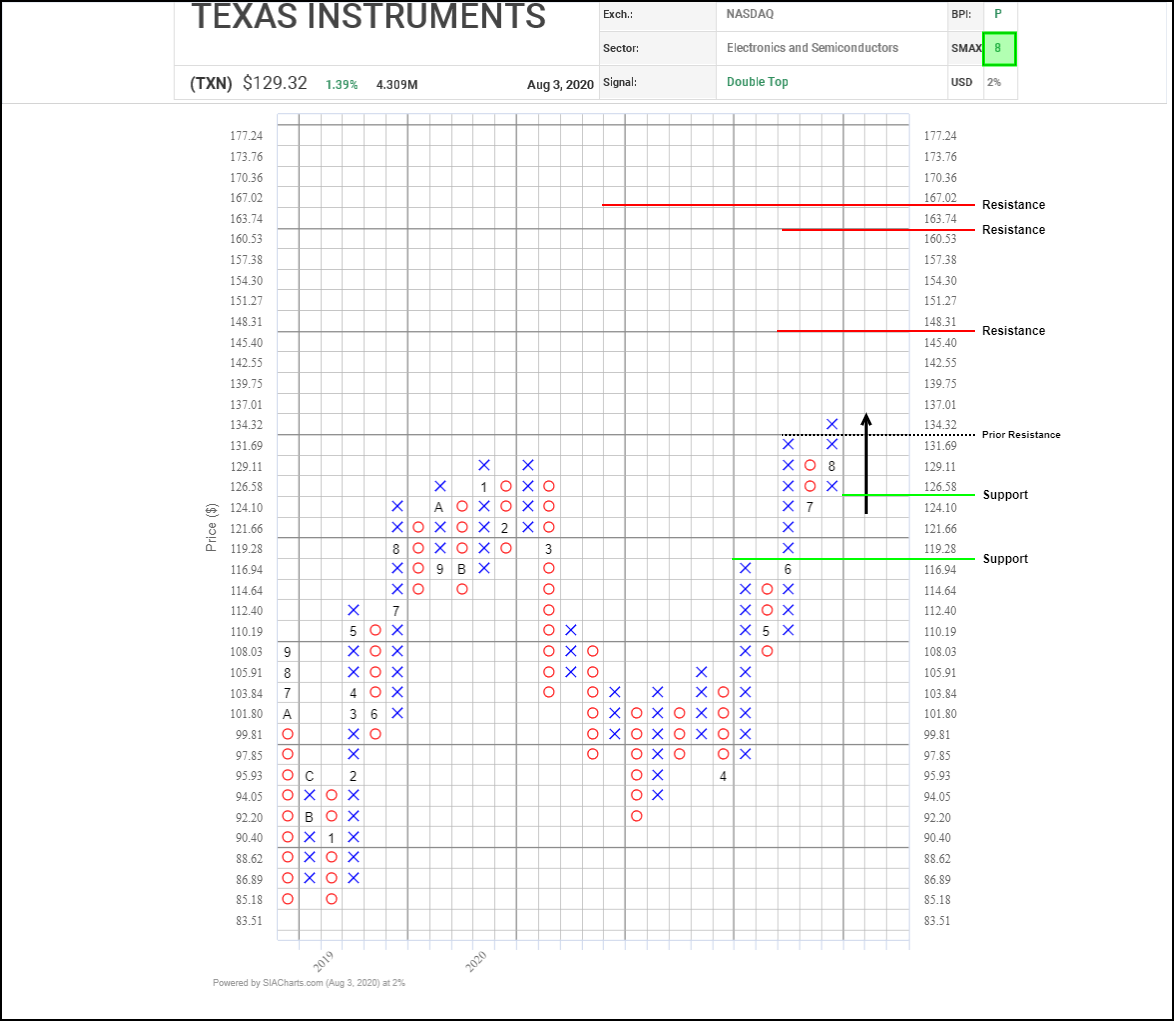
Texas Instruments (TXN) surpassed its January peak back in June and following a brief 3-box consolidation, the shares completed a bullish Double Top pattern and broke out to a new all-time high confirming that its underlying accumulation trend has resumed.
Next potential upside resistance tests on trend appear near $148.30, $163.75 and $167.00 based on a series of vertical and horizontal counts, along with the $150.00 round number. Initial support appears near $124.10 based on a 3-box reversal.
With a bullish SMAX score of 8, TXN is exhibiting near-term strength against the asset classes.
Disclaimer: SIACharts Inc. specifically represents that it does not give investment advice or advocate the purchase or sale of any security or investment whatsoever. This information has been prepared without regard to any particular investors investment objectives, financial situation, and needs. None of the information contained in this document constitutes an offer to sell or the solicitation of an offer to buy any security or other investment or an offer to provide investment services of any kind. As such, advisors and their clients should not act on any recommendation (express or implied) or information in this report without obtaining specific advice in relation to their accounts and should not rely on information herein as the primary basis for their investment decisions. Information contained herein is based on data obtained from recognized statistical services, issuer reports or communications, or other sources, believed to be reliable. SIACharts Inc. nor its third party content providers make any representations or warranties or take any responsibility as to the accuracy or completeness of any recommendation or information contained herein and shall not be liable for any errors, inaccuracies or delays in content, or for any actions taken in reliance thereon. Any statements nonfactual in nature constitute only current opinions, which are subject to change without notice.


