by Don Vialoux, EquityClock.com
Technical Notes
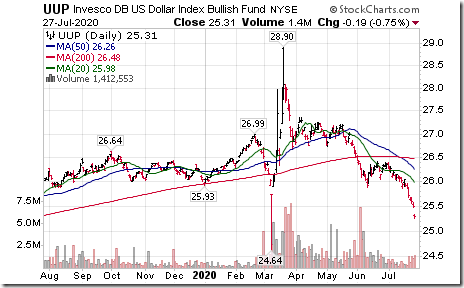
The U.S. Dollar Index and its related ETN continue to collapse.
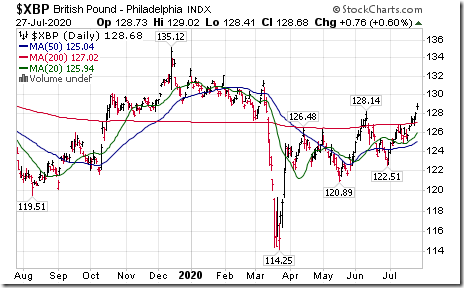
Conversely, other currencies soared. The British Pound moved above 128.14 extending an intermediate uptrend.
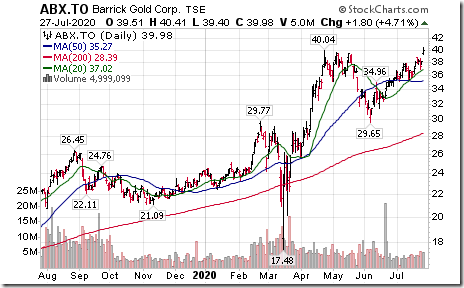
Barrick Gold (ABX), a TSX 60 stock moved above Cdn$40.04 to an 8 year high extending an intermediate uptrend.
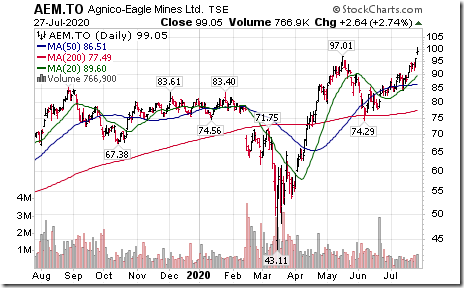
Agnico-Eagle (AEM), a TSX 60 stock moved above Cdn$97.01 to an all-time high extending an intermediate uptrend.
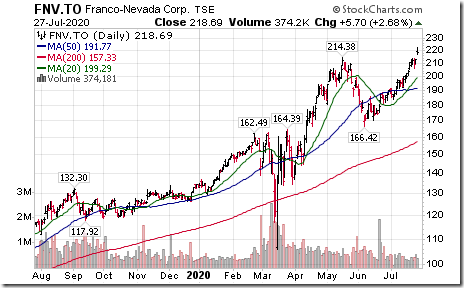
Franco-Nevada (FNV), a TSX 60 stock moved above Cdn$214.38 to an all-time high extending an intermediate uptrend.
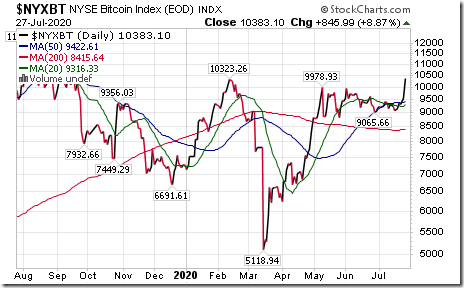
Bitcoin ($NYXBT) moved above 9,978.93 and 10,323.26setting an intermediate uptrend.
Trader’s Corner
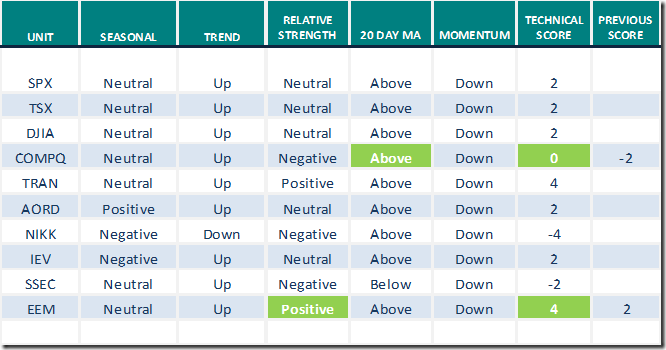
Equity Indices and related ETFs
Daily Seasonal/Technical Equity Trends for July 27th 2020
Green: Increase from previous day
Red: Decrease from previous day
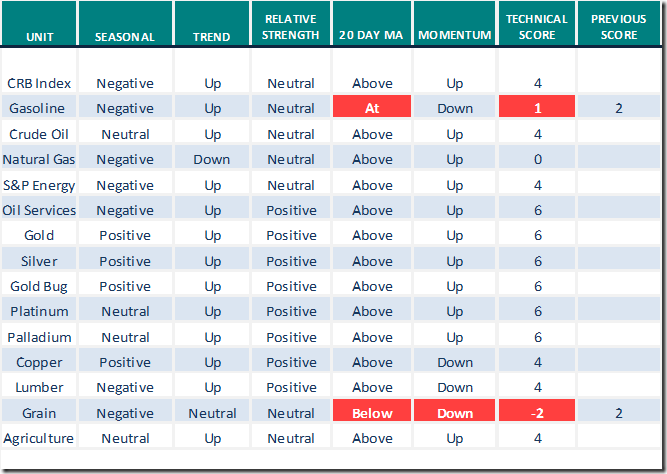
Commodities
Seasonal/Technical Commodities Trends for July 27th 2020
Green: Increase from previous day
Red: Decrease from previous day
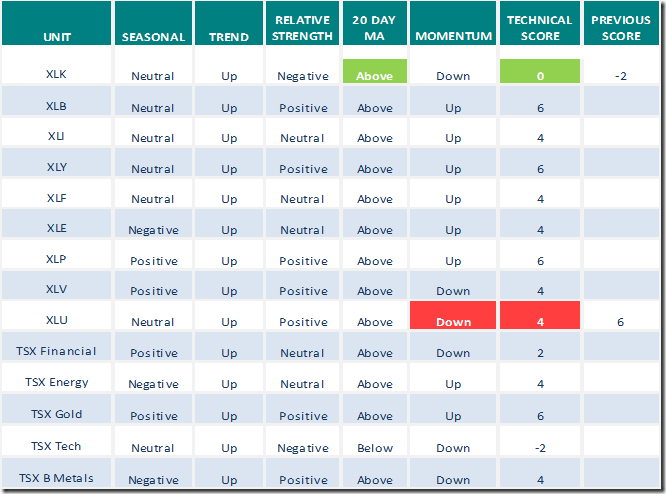
Sectors
Daily Seasonal/Technical Sector Trends for July 27th 2020
Green: Increase from previous day
Red: Decrease from previous day
Notes for Michael Campbell Money Talks: July 25th 2020
Don Vialoux was a guest on Michael Campbell’s radio show on Saturday. Following are notes used during the interview.
The “Summer Rally” for North American equity markets arrived on schedule this year. The Summer Rally normally runs from the last week in June to the third week in July. This year, the TSX Composite Index added 6.5%, the S&P 500 Index gained 8.8% and the NASDAQ 100 Index jumped 10.4% during the period to an all-time high.
Most gains by the S&P 500 Index and NASDAQ Composite Index during the recent Summer Rally came from six stocks, better known as the “FAANG + Microsoft” package. They represent approximately 20% of weight in the S&P 500 Index and approximately 40% of weight in the NASDAQ 100 Index. Stocks included in FAANG are Facebook, Apple, Amazon, Netflix and Google. Note that late last week, all six showed deteriorating short term technical indicators.
Gains by North American equity markets were recorded during the Summer Rally this year despite terrible news from the spread of COVID 19 and from sharply lower second quarter corporate earnings. Consensus for second quarter earnings on a year-over-year basis calls for a 42.4% plunge for S&P 500 companies and a 20% drop by TSX 60 companies
World equity markets turned lower in the middle of last week in line with seasonal trends. Traditionally, most equity markets around the world record their largest negative return for the year from the third week in July to the second week in October. On average during the past 20 periods, the S&P 500 Index and TSX Composite Index have dropped 1.5%-2.0% per period.
Currencies had a major impact on North American equity and commodity prices during the Summer Rally this year. Since the last week in June, the U.S. Dollar Index has plunged 2.5%. Last week, it broke technical support at 94.61 to reach a 20 month low and extended its intermediate downtrend. Conversely, the Canadian Dollar and the Euro advanced by approximately 2.5%. These are huge moves by currencies over less than a one month period.
Weakness in the U.S. Dollar Index triggered a significant positive impact on industrial commodity prices and their related equities/ETFs. Since the end of June, copper prices have advanced almost 8% and lumber prices jumped over 21%. Canadian forest product stocks have been the best performers: West Fraser Timber was up 30%, Canfor advanced 40% and Interfor jumped 45%.
Traders tracking commodity prices focused their attention on the precious metal sector. Since the end of June Gold has gained 6%, Platinum advanced 15% and Silver jumped 27%. The TSX Gold Index advanced 8%.
Prospects for precious metal prices and related equities/ETFs remain promising even at current elevated prices. Technically, gold is testing its all-time high set in 2011 at US$1,923.70. A move above its all-time high likely will trigger additional technical buying. Gold in Canadian Dollars already is trading at an all-time high at $2,534 per ounce.
Demand for gold and precious metals and their related equities and ETFs is expected to remain strong until at least the end of this year due to a series of events
1. Annual seasonal “sweet spot” for the sector from mid-July to the end of September started last week.
2. Coronavirus fears are high and rising (particularly in the U.S.) triggering additional weakness in the U.S. Dollar and corresponding strength in precious metals prices. Fears likely will remain elevated until a vaccine becomes readily available for the public next year.
3. Uncertainty about results of the U.S. Presidential election prior to November 3rd election day could prompt higher equity market volatility and higher precious metal prices. Political rhetoric already is ramping up. The S&P 500 Index and Dow Jones Industrial Average have a history during a U.S. election year of reaching a peak in mid-August followed by a drop to mid-October. Current election polls show Biden with a 15 point lead over Trump. Anticipation of a Biden victory between now and November will have a negative impact on U.S. equity indices. Moreover, anticipation of a possible change in control of the U.S. Senate from Republican to Democrat will add to investor concerns. Investors are concerned that Biden and the Democrats substantially will increase the corporate tax rate and are considering an increase on the tax on realized capital gains. A victory by Biden and the Democrats could trigger an avalanche of equity selling before the end of the year in order to avoid a higher tax bill.
In summary, look for above average volatility in North American equity markets between now and yearend. Also, look for higher precious metal and precious metal equity prices at least between now and the end of September.
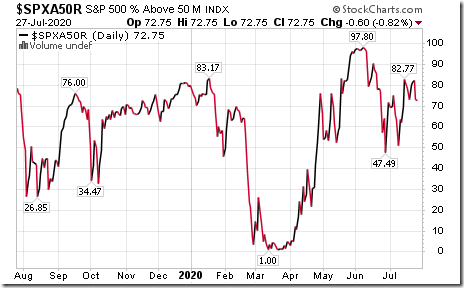
S&P 500 Momentum Barometer
The Barometer slipped 0.60 to 72.75 yesterday. It remains intermediate overbought.
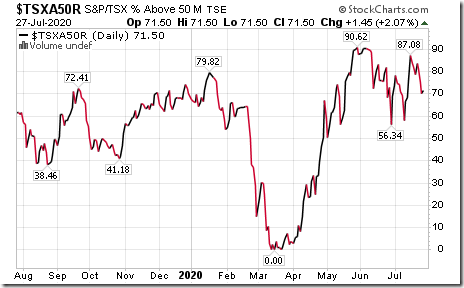
TSX Momentum Barometer
The Barometer added 1.45 to 71.50 yesterday. It remains intermediate overbought.
Disclaimer: Seasonality and technical ratings offered in this report and at
www.equityclock.com are for information only. They should not be considered as advice to purchase or to sell mentioned securities. Data offered in this report is believed to be accurate, but is not guaranteed
This post was originally publised at Vialoux's Tech Talk.


