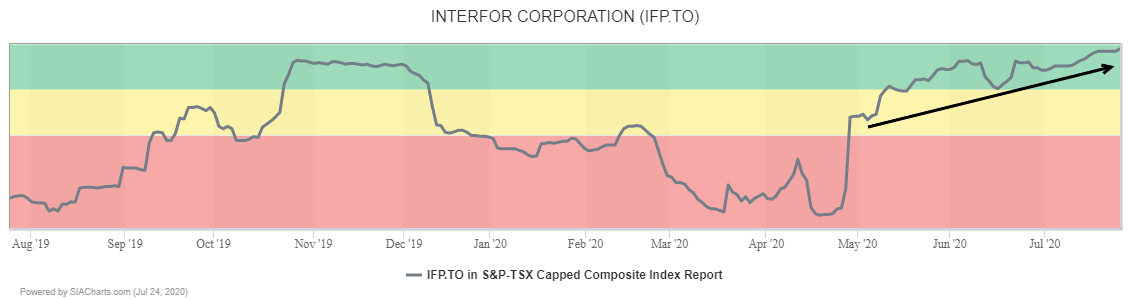
Forest products producer Interfor (IFP.TO) continues to climb toward the top of the Green Favored Zone in the SIA S&P/TSX Composite Index report, rising another three spots on Friday to 8th place.

Interfor (IFP.TO) shares continue to steadily recover from their March low. They recently snapped a long-term downtrend line and established higher support near $14.00. A Golden Cross of the moving averages is pending which would be another bullish sign. Next potential upside resistance on trend appears near $17.00, then the $20.00 round number.
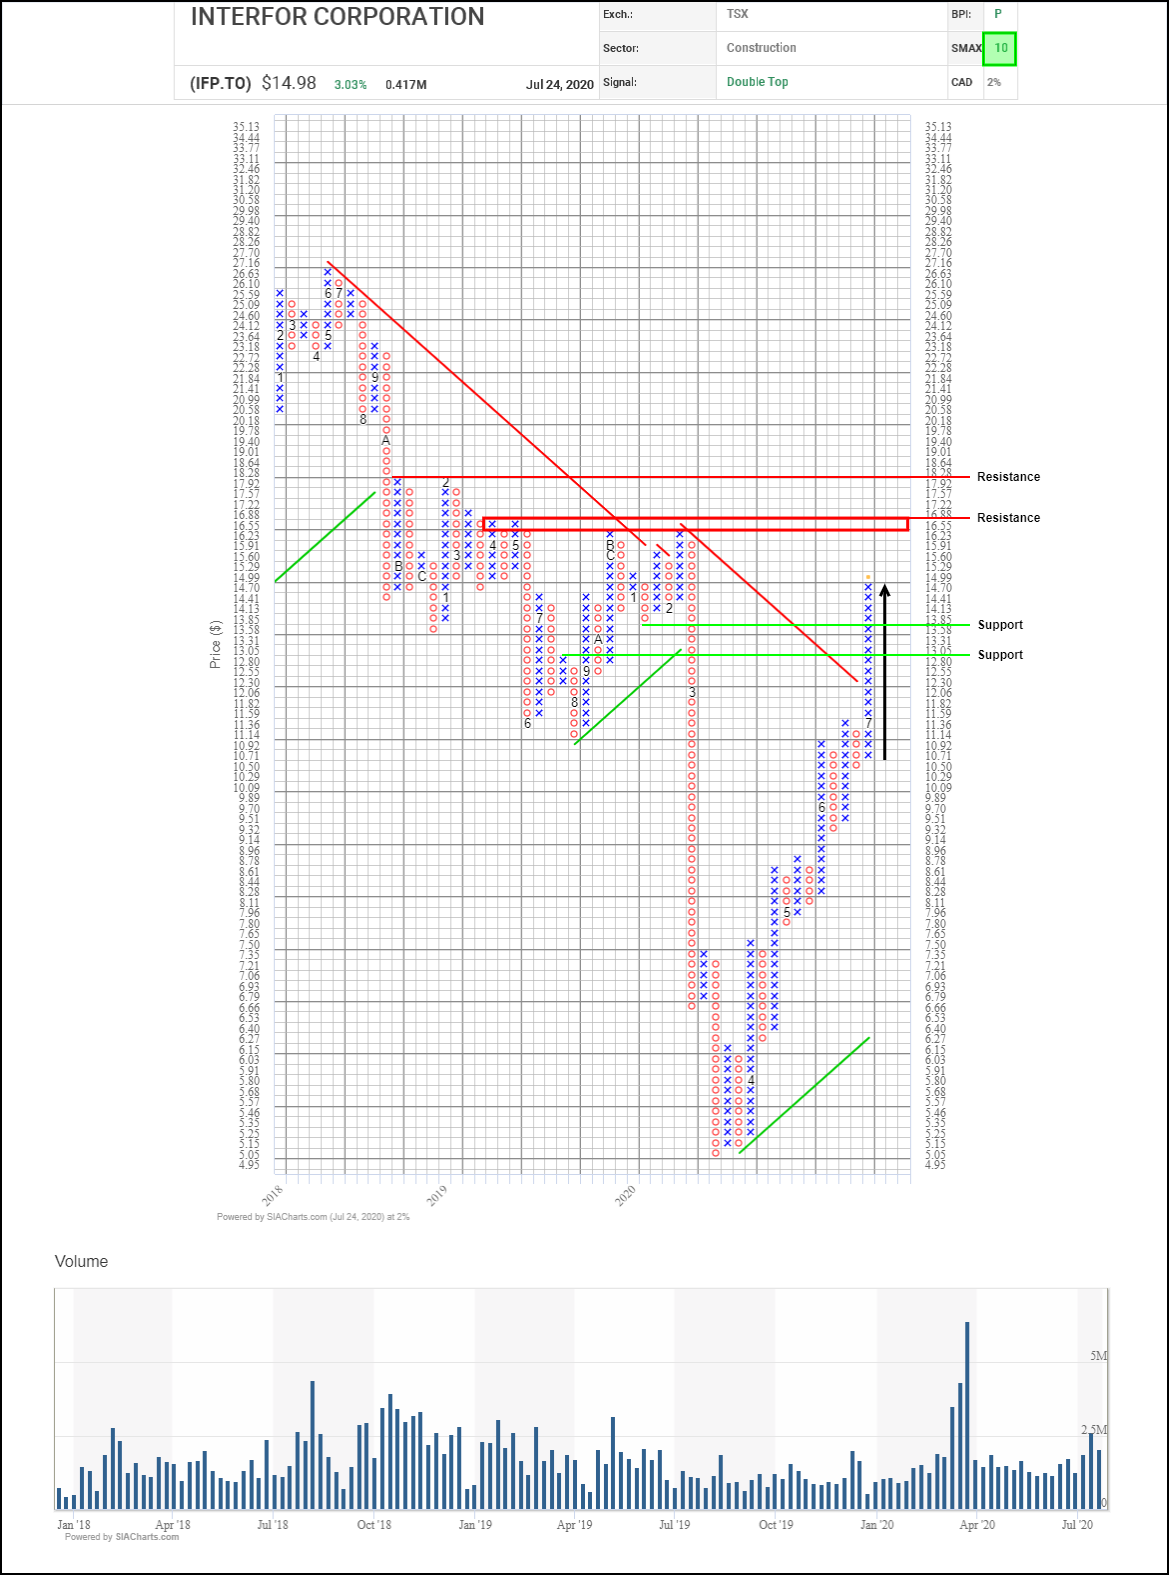
Accumulation in Interfor (IFP.TO) has accelerated lately with the shares completing a bullish Double Top pattern, snapping out of a downtrend and continuing to climb in the last few weeks. Next potential upside resistance tests on trend appears in the $16.55 to $16.90 range, and then $18.30, all based on previous column highs. Initial support appears near $13.60 based on a 3-box reversal.
With a perfect SMAX score of 10, IFP.TO is exhibiting near-term strength across the asset classes.
Disclaimer: SIACharts Inc. specifically represents that it does not give investment advice or advocate the purchase or sale of any security or investment whatsoever. This information has been prepared without regard to any particular investors investment objectives, financial situation, and needs. None of the information contained in this document constitutes an offer to sell or the solicitation of an offer to buy any security or other investment or an offer to provide investment services of any kind. As such, advisors and their clients should not act on any recommendation (express or implied) or information in this report without obtaining specific advice in relation to their accounts and should not rely on information herein as the primary basis for their investment decisions. Information contained herein is based on data obtained from recognized statistical services, issuer reports or communications, or other sources, believed to be reliable. SIACharts Inc. nor its third party content providers make any representations or warranties or take any responsibility as to the accuracy or completeness of any recommendation or information contained herein and shall not be liable for any errors, inaccuracies or delays in content, or for any actions taken in reliance thereon. Any statements nonfactual in nature constitute only current opinions, which are subject to change without notice.