


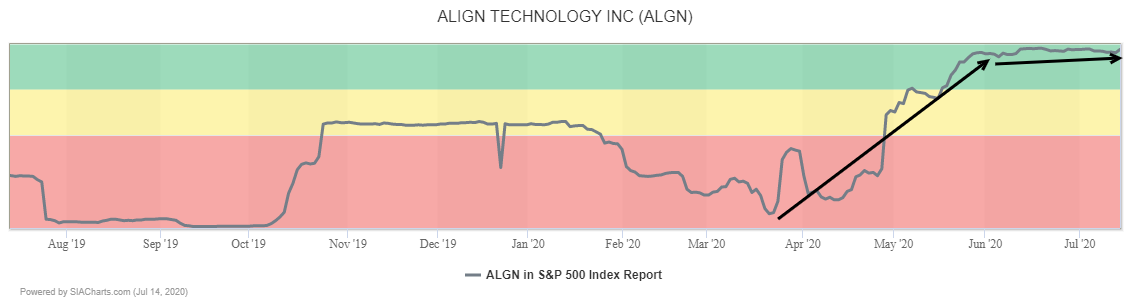
Orthodontics equipment producer Align Technology (ALGN) remains in the Green Favored Zone of the SIA S&P 500 Index Report, where it has been holding since moving up from the Red Zone back in April-May. Yesterday it moved up 9 spots to 20th place.

Align Technology (ALGN) shares have already broken out of a long-term downtrend and are currently bumping up against the $300.00 round number where a breakout would complete a bullish Ascending Triangle base pattern and confirm the start of a new uptrend. Should that occur, next potential upside resistance tests on trend may appear at previous resistance near $335.00, then the $350.00 and $400.00 round numbers, with the latter coinciding with the previous peak. Underlying uptrend support appears near $275.00.
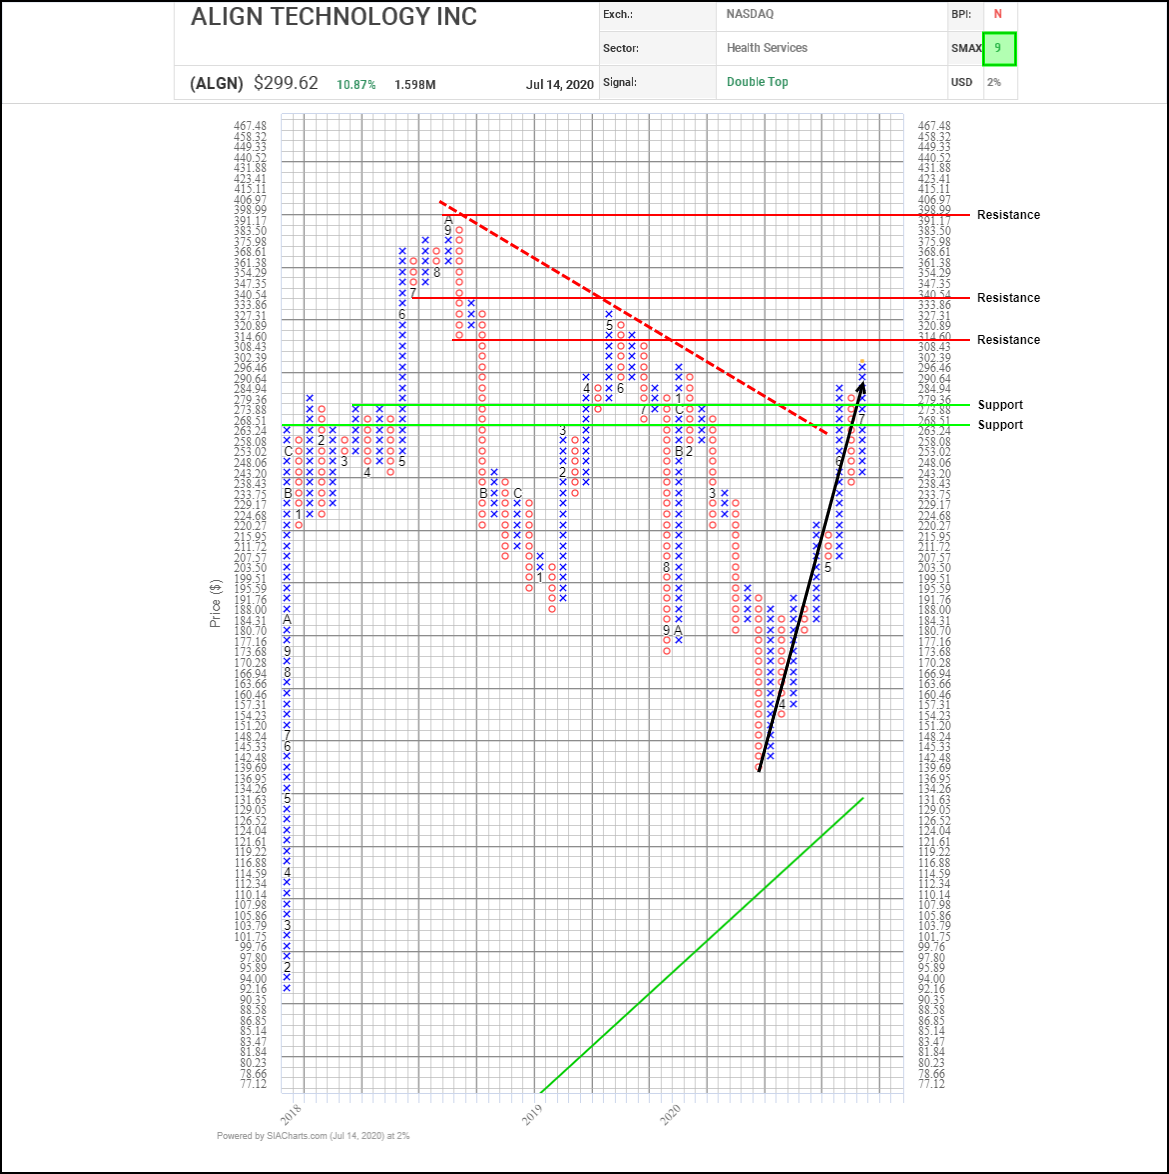
Since bottoming out in March, Align Technology (ALGN) shares have been steadily recovering with higher lows on trend and a series of bullish Double Top breakouts indicating renewed accumulation. Last month, the shares snapped out of a long-term downtrend and yesterday they rallied to their highest level since January near $300.00. Next potential upside resistance tests appear at a previous low near $314.60, then $347.35 where prior support/resistance and a horizontal count converge, and $400.00 where a previous high, round number and vertical count cluster. Initial support appears near $273.90 based on a 3-box reversal.
With a bullish SMAX score of 9, ALGN is exhibiting near-term strength against the asset classes.
Disclaimer: SIACharts Inc. specifically represents that it does not give investment advice or advocate the purchase or sale of any security or investment whatsoever. This information has been prepared without regard to any particular investors investment objectives, financial situation, and needs. None of the information contained in this document constitutes an offer to sell or the solicitation of an offer to buy any security or other investment or an offer to provide investment services of any kind. As such, advisors and their clients should not act on any recommendation (express or implied) or information in this report without obtaining specific advice in relation to their accounts and should not rely on information herein as the primary basis for their investment decisions. Information contained herein is based on data obtained from recognized statistical services, issuer reports or communications, or other sources, believed to be reliable. SIACharts Inc. nor its third party content providers make any representations or warranties or take any responsibility as to the accuracy or completeness of any recommendation or information contained herein and shall not be liable for any errors, inaccuracies or delays in content, or for any actions taken in reliance thereon. Any statements nonfactual in nature constitute only current opinions, which are subject to change without notice.