


by Craig Basinger, Chris Kerlow, Derek Benedet, An Nguyen, Joey Mack, Alexander Tjiang
Executive summary
I. Market recap – The bounce continues
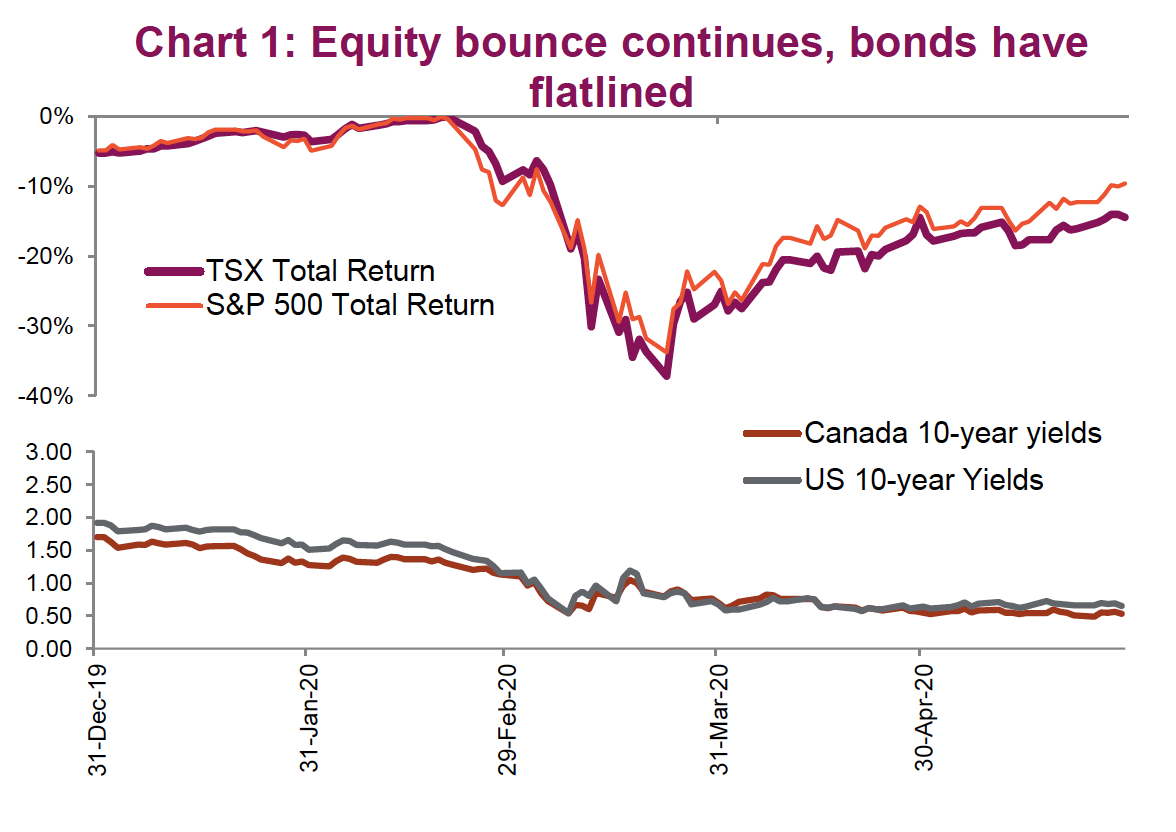
Market recovery continued in May while boring bonds were very narrowly rangebound. An encouraging note: equity market leadership has been broadening beyond just tech and health care.
II. Investment strategy
This novel services-oriented recession continues, but we are starting to see some early improvements in market cycle indicators. No changes to our asset allocation at this time, but we have trimmed our short-term positive view on the CAD. Plus, a recap of bank earnings and recent investor FOMO.
III. Pay cuts and sticky wages
With aggregate payrolls plummeting, one big risk to the recovery is the near- term path for consumer spending.
IV. Revisiting residential real estate
Canadian real estate prices are declining, unemployment is up big, consumer leverage is high – could this be the end of the Canadian real estate run?
V. Portfolio construction – A chef’s approach
A successful portfolio is not just about trying to find good managers / investments, it is how these investments are combined that often matters more than their individual attributes.
VI. Managed Portfolios – A closer look at factor exposures
A walk through the managed portfolio process of incorporating factors when combining managers and ETFs.
I. Market recap – the bounce continues
Derek Benedet
In May, markets continued their relentless rally out of the “coronacrisis”, latching on to any and all reasons to rally after sliding precipitously in March. Most major indexes have now recovered a large portion of their spring selloff. Optimism over reopening and vaccine developments continue to influence sentiment. The S&P 500 rose 4.8% in May, and the S&P/TSX Index climbed 3.0% – respectable returns amid a recessionary backdrop. The S&P 500 is now just down 10.4% from its February high. Should we bid farewell to the bear market? If the coronoavirus was the accelerant of the overdue recession, the markets appear to have gotten over both with the NASDAQ now up 5.8% year-to-date followed by the S&P down just 5.8% and the TSX down 11.0%. This rally has been relentless.
 It’s not just a North American phenomenon – the European market is up strongly but Emerging markets continue to struggle. Currency weakness is a large driver, as the MSCI Emerging Markets Index finished the month largely flat as the virus continues to spread largely unabated, notably in Brazil.
The COVID-19 pandemic has led to an increase in confrontational rhetoric between the U.S. and China, with Hong Kong right back in the middle of the war of words. These geopolitical tensions which markets obsessed over in 2019, have so far had little impact on sentiment. Perhaps it’s just talk for now, with little support across the political spectrum to increase tariffs in the middle of a recession. With the U.S. election coming up, the rhetoric will likely get louder.
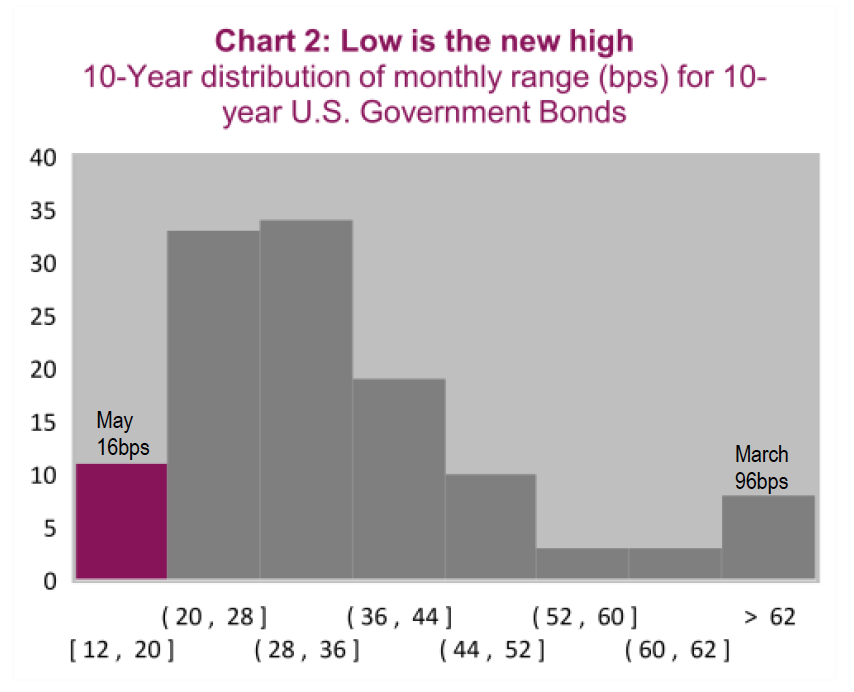
The bond market has been incredibly quiet in May (See Chart 1 with flat-lined yields). After the big swings in bond yields over the past few months, the sense of stability has brought about a sense of relief for fixed income traders. Since mid- April, treasury yields have been locked within an exceptionally narrow band between 60-70 basis points (bps). Chart 2 shows just how rare this lack of volatilty is. The total range for U.S. 10-year bonds in May was 16bps, an occurance almost as rare as the big swing in March. Looking back, the dislocation within the bond market in March was due to the large one-sided nature of flows. With the U.S. Federal Reserve (Fed) and other central banks now active buyers, both within the treasury market and now buying ETFs directly, there are now two sides to the trade. Credit spreads continue to narrow, led by investment grade bonds. The high-yield market continues to recovery, but not by the same degree.
The energy complex has come back in a big way. West Texas Intermediate (WTI) posted a 77% increase in May with gasoline prices up nearly 50%. Returns in base metals are mixed with copper leading the pack rising 2.8%. Precious metals continue to be in hot demand with rising interest among retail investors, but gold prices have been comfortable bouncing around the low $1,700s. Silver has been the big winner, up 20% this month, underscoring just how stretched the gold/silver ratio was in March/April. A gold to silver ratio of 97.3 is still historically stretched, nearly two standard deviations away from its 10-year average.
The major development within currency markets has been the broad-based weakening of the U.S. dollar. The DXY Index is back down to 98.2 and is nearing its lowest level in the past three months as it continues to give up its safe-haven gains during the peak of the viral fears. A weaker U.S. dollar and stabilizing energy markets have benefited the loonie which is now trading back above $0.72 CAD/USD. It is still lower by over 6% compared to where it started the year, but the present valuations based on purchasing power parity show it is only 14% undervalued compared to levels which were much more extreme back in March. At current levels, it’s difficult to have robust convictions in either direction.
While sentiment continues to improve, and the future is looking brighter than it did a couple of months ago, we remain concerned that the recovery in risk assets has possibly gotten ahead of itself. Valuations remain elevated, and the road to economic recovery will more than likely not resemble that path that equity markets have forged. Given the continued rise in markets, the potential for near- term corrective action remains elevated. That being said, this continues to be a pretty unloved rally so far, which means that current positioning could continue to be a tailwind
Passing of the baton
In the back half of May there were signs of a broadening of the equity rally. This is likely more short-term in nature but has reinvigorated the debate between growth versus value. The pace of re-risking has been uneven with the rotation to strength moving further down the quality scale into sectors and industries that are far less resistant to economic weakness. This is either a sign of breadth/strength, or simply bargain hunting when the price of what you really want to buy is unjustifiable.
The current levels of some of the big tech and health care names is rather baffling. You can blame it on hedge funds or new retail day traders who have nothing better to do after being furloughed. Baskets of retail favourites are showing some signs of irrational exuberance, but the same can be said for the NASDAQ as a whole which remains the bellweather bubble index. Keeping your eyes on this should provide a good glimpse into any souring of sentiment.
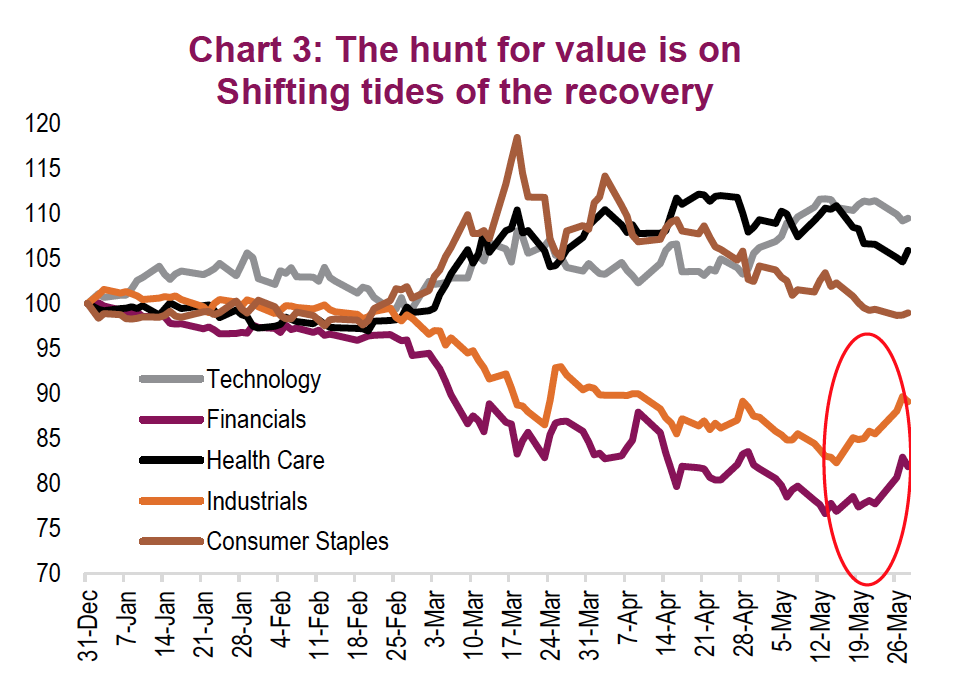
Around mid-May the rotation really took hold, as Chart 3 shows. While the broader indices slowed their ascention, investors started to bid up sectors and industries that had been left behind during this bounce off the bottom. These are the sectors that bear the brunt of the damage as the recession plays out. While it’s often said the stock market is not the economy, there are certainly sectors of the market that are more closely tied to the economy.
Diversification is a common theme throughout this report. It’s important to remember that it’s not really about growth versus value; it’s about finding the right balance of exposure across a multitude of styles and sectors. From a stock-specific standpoint, some sectors such as financials would certainly be bucketed into “value” while others such as tech or communication services are certainly growth.
II. Investment strategy
Craig Basinger & Derek Benedet
In a word, WOW. The S&P 500 is currently trading at 3,044 – a mere 10.3% below its all-time high. Since a bear market is a drop of 20% and a correction is a drop of 10%, this almost isn’t even a correction anymore. This as the economy slowly awakens from its self-induced hybernation, economic data remains in the dump and the real economic damage is unknown. We continue to believe the data will begin to weigh on the market at some point in the coming months, but full disclosure, our decision to take some chips off the table a month ago does appear early.
Novel recession
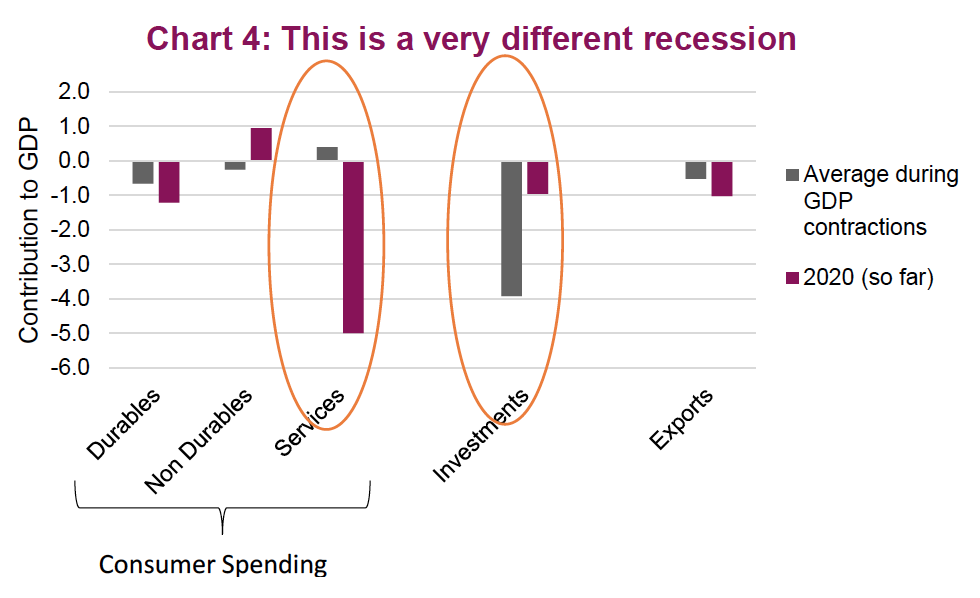
The “novel coranavirus” is labeled such because it is both new and different, just like this recession. This recession is novel because it is self-induced, largely impacting the services area of economies, and has been accompanied by a ton of stimulus/support very early on. This has made simple comparisons to past recessions, or even depressions, of limited use.
Services now comprise the majority of economies in North America as other areas such as manufacturing and resource development have shrunk as a percentage of the pie. In past recessions, this heavy reliance on services has been a positive, as jobs and activity in the service industries proved more resilient in a cyclical downturn (Chart 4). However, since social distancing has impacted service industries much more, employment drops have blown past historical records.
While weakness in services could spread and drag down other areas of the economy, we believe a sharper, albeit partial, rebound in services will make this less likely. Don’t get us wrong, this is going to be a very painful recession that is deeper than most. And after the bounce off the bottom, behaviours will have changed. Savings will likely be higher than normal as individuals repair their balance sheets and create that rainy day account. Social distancing will limit the recovery in some areas of the economy.
The good news is that compared to past recessions, which had to work through excess inventories of houses or tech, this one doesn’t have such a burden. Instead of suffering two years of job losses and a long four years to get back to normal, this recession may have a similar pattern but over quarters. Of course, there are many unknowns as we are in the uncharted waters of a novel services recession.
Positioning
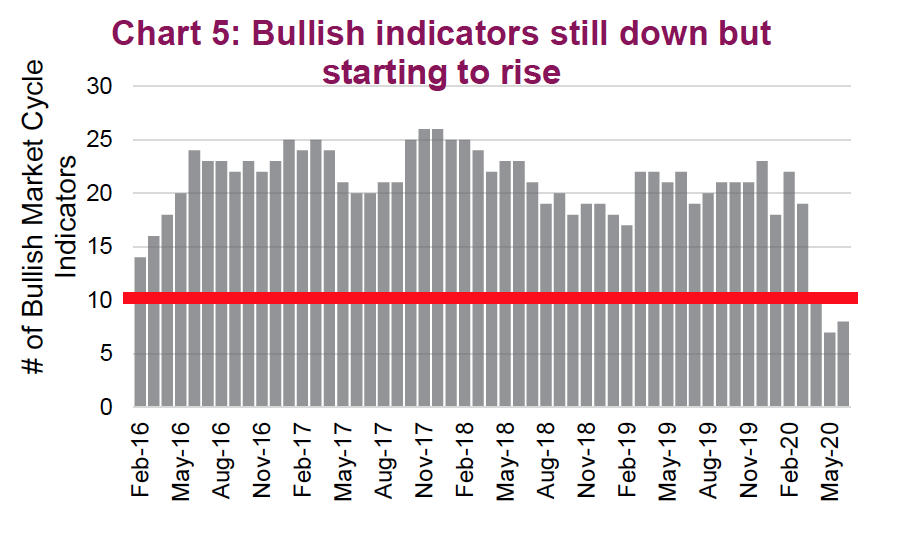
As this remains a rather novel recession, our reliance on our market cycle indicators has diminished. They were not developed for a self-induced recession. That being said, we have noticed some signs of improvement in faster-moving data points. Copper prices for instance, have been steadily rising. Our model bullish indicators moved from a low 7 in April, up one to 8 as of the end of May (Chart 5).
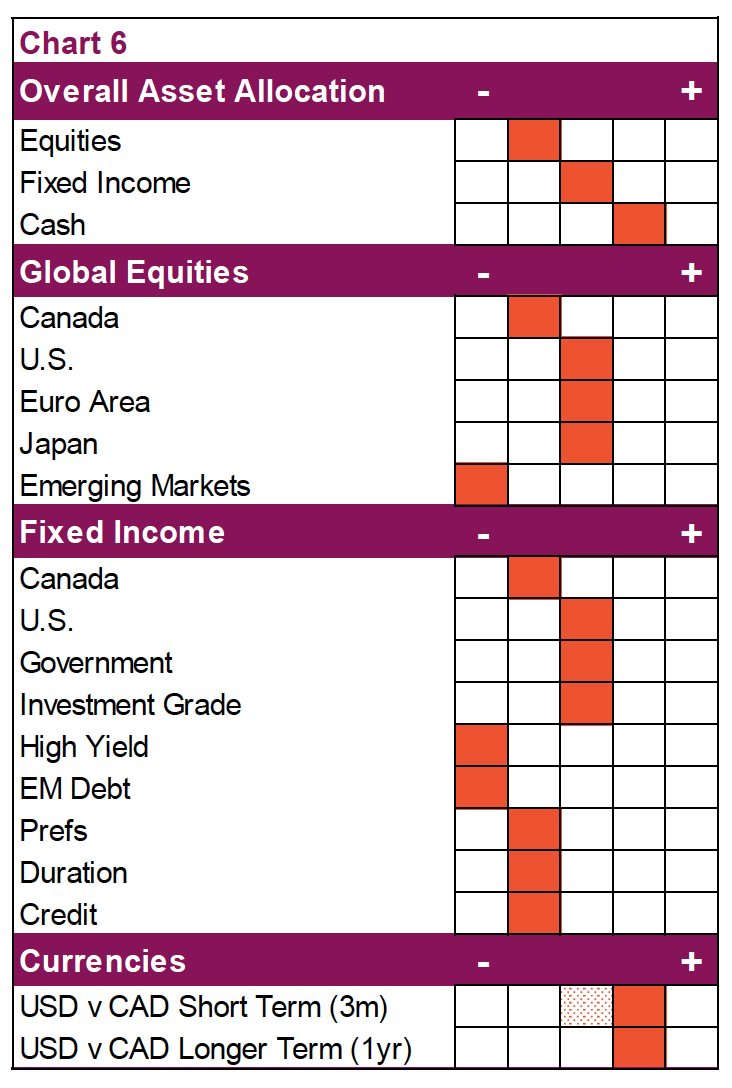
We have not made any asset allocation changes over the past month. We maintain a mild underweight in equities after reducing our overweight in Europe to market weight. The mild underweight is primarily pointed at Canada and emerging markets. Fixed income is market weight after adding to credit exposure in April. Meanwhile, we remain mild overweight in cash, patiently waiting for a pullback in equity prices.
The one change in May came on the currency side. On a valuation perspective, we had become more positive on the Canadian dollar compared to our longer-term view. This was driven a few months back as the CAD approached 70 cents. However, given the recent bounce higher, we are returning to our more positive view on the U.S. dollar in the near term.
Closer look at the banks
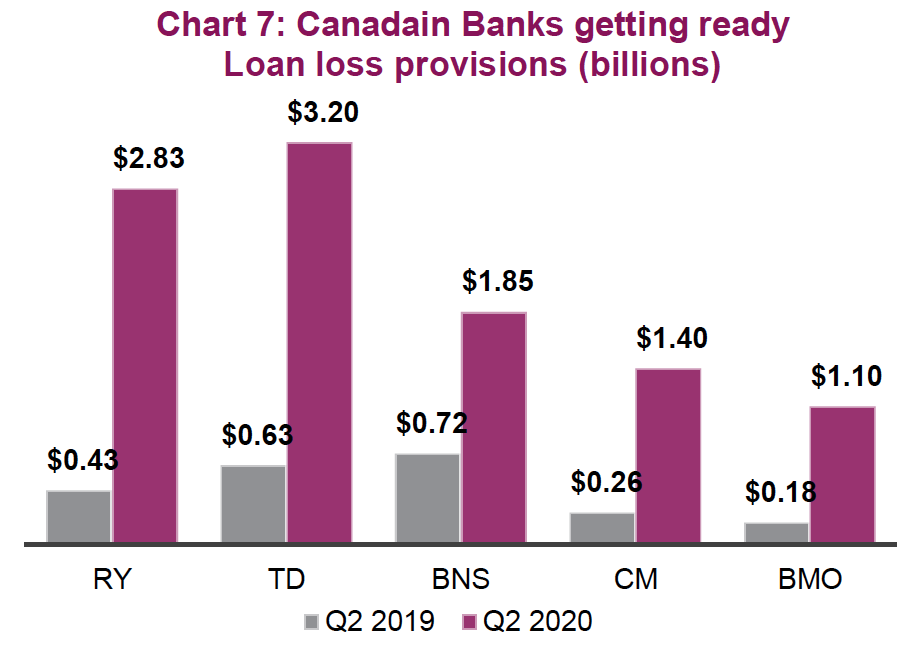
The Canadian market is disproportinately dominated by the big banks. Collectively they account for nearly 20% of the domestic stock market. This compares to less than 4% for the S&P 500. Last week (May 25-29), the banks released their highly anticipated second-quarter results. On the whole, the earnings were terrible, largely coming in below lowered analysts expectations. All of the banks set aside billions of dollars to cover loan losses from the coronavirus pandemic as well as the struggling energy sector. These surging loan-loss provisions can be seen in Chart 7 which outlines the year-over-year increase in loan-loss provisions. Collectively, the big five have set aside over $10 billion, with more to come. This has been one of the worst quarters for the banks in memory as the banks try to strike a precarious balance between building reserves and preserving capital ratios.
Capital ratios remain sound, though the trend is lower. Dividends are also a big question mark. While expectations are that they will remain intact, Laurentian Bank did announce a divided cut. This news reverberated across the rest of the banks, all of which traded lower on the news. Despite this weak finish to the month, the banks are still up 2.8% in May.
Valuations are attractive from a long-term perspective, however banks are also a proxy for the Canadian economy. Given the uncertainty over the pace and magnitude of the economic recovery, real estate prices, eventual credit losses as well as the future direction of interest rates, valuations should be cheap.
For now, we remain comfortably underweight the banks but are monitoring with a keen eye and looking for an opportune time to increase exposure. Presently, there’s no shortage of questions, and it’s this uncertainty that speaks to why the banks remain well behind on the road to recovery. Due to the delayed nature of credit losses, it is sensible to expect that the banks will be under this shroud of uncertainty for longer than other industries as they prepare for the credit headwinds to come.
Behavioural coach’s corner
Perhaps the most prevalent behavioural bias impacting investors at the moment is FOMO, aka Fear Of Missing Out; and for good reason – the bear market that was the fastest in the history of the S&P dating back almost a century, has been followed by one of the fastest bounces off the bottoms. This has left many waiting for that double bottom or better buying opportunity. For the record, to see a double bottom from current levels would require a 27% drop. We are not suggesting that is impossible, but the likelihood is getting more remote with each tick higher.
FOMO isn’t really a behavioural finance bias. Actually, it is prevalent in many aspects of life. Advertisers use it often, implying that not owning their product or service has you missing out on something really good. It could be enjoying a cold beverage by the pool or benefiting from innovative features on the latest smartphone. Social media is partly built around FOMO.
The behavioural bias behind FOMO is loss aversion, but from a different perspective than how many normally think about loss aversion. The loss is missing out on something good like a boat party, new phone or someone doing something fun. Turning to markets, FOMO often arises when a new thematic industry takes off. Marijuana or bitcoin in 2017, ESG in 2019, ecommerce and disinfectant companies over the past few months.
With the recent recovery in markets, many investors are now feeling they may have missed out on the best buying opportunity of the last three years. Sometimes FOMO is not based on a narrow industry but the overall market, such as today with this big bounce off the bottom.
Overcoming this FOMO feeling is not easy. It is a very common feeling during the downward period of a bear market to feel like it is going on forever. It is draining after all. But once over, there is always regret that you didn’t do more to take advantage of mispriced assets. The best tools an investor has to manage these feelings, including FOMO, is to be systematic. Nobody knows if it’s over, or if another leg down awaits. Spreading out your activity – whether buying, selling or repositioning – during these periods tends to be best.
The other behaviour that can help with FOMO is to focus on your plan and think long term. Having an articulated financial plan that is laid out can significantly help mitigate the emotional stress caused by market volatility. Richardson GMP has just launched a new financial-planning program, My NextGen Plan, that we would encourage all clients to take advantage of (speak to your Advisor). Having a plan encourages long-term thinking that helps during periods of volatility and those FOMO feelings.
III. Paycuts and sticky wages
Chris Kerlow
The source of any recession is a mismatch between aggregate supply and demand. The past two major recessions were catalyzed by excesses in supply coupled with FOMO on artificial, transient demand. These were U.S. home prices in the years leading up to 2008 and technology stocks in the early 2000s. In both cases, it is not the fact that there was too much supply that caused the subsequent recession; rather, it was the sudden evaporation of demand which thereby caused the painful economic re-adjustment phase. This recession has no obvious supply gluts and has been driven exclusively by the self-induced lack of demand caused by the pandemic.
The General Theory of Employment, Interest and Money, a book published in 1936 by John Maynard Keynes, created a profound shift in economics and started what is known today as the “Keynesian Revolution”. It is fundamentally driving current government policy supporting spending, budget deficits, and monetary intervention to help counterbalance cyclical downdrafts. Before the general theory, classical economists believed that employment was determined by the price of labour, not aggregate demand as is now the belief. If total demand for goods is less than total output, the economy shrinks to reach equilibrium. That is why central banks intervene to either smooth this adjustment or reduce the drift lower.
This Keynesian theory held up during the great financial crisis as companies let misery out the door: instituting massive job cuts but keeping wages stable for those that remained. Retaining employees further motivated workers to pick up the slack based on a fear of being the next to go, while high grading the workforce. It is, however, also why many believe wage growth has been so slow over the last decade following the recession, according to much of the research published on “sticky wages”.
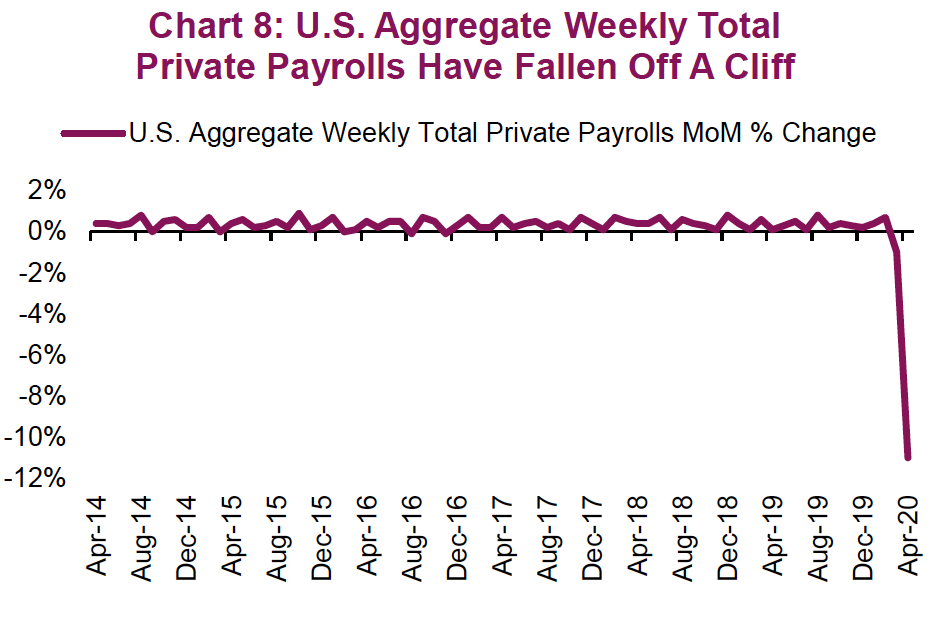
This recession is different. We have seen aggregate weekly payrolls fall off a cliff (Chart 8) as firms have adopted an approach of shared sacrifice. Coming at a time when the share of business income that goes to the average worker is already low, we could see this expand the wealth inequality gap, as wealthier executives with higher share ownership disproportionately benefit as businesses recover. The takeaway from the Keynes model is that unemployment lowers aggregate demand, dragging down the economy. Pay cuts will only exacerbate that problem by further reducing demand. This is leaving economists fearful that what we are seeing in falling wages could deepen the recession.
IV. Revisiting residential real estate
Alexander Tjiang
For the last decade, tight housing supplies, a healthy amount of population growth, and high employment levels have jointly supported residential real estate prices and valuations across the country. In densely populated areas, it seemed like demand was always outpacing supply and that housing prices could therefore only advance higher.
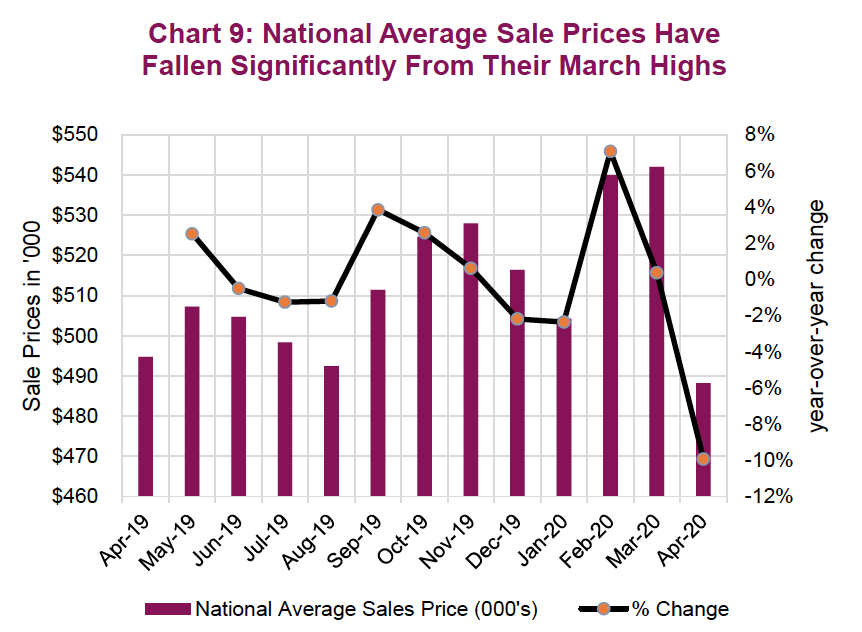
The advent of COVID-19 and the economic environment it brought with it presents a new set of challenges to investors and developers alike that risk undermining the tailwinds to which all parties had become so acclimated to. Prices have already begun to fall (Chart 9); the question that is now on everyone’s mind is to what extent will this fallout continue, and is there more pain to come?
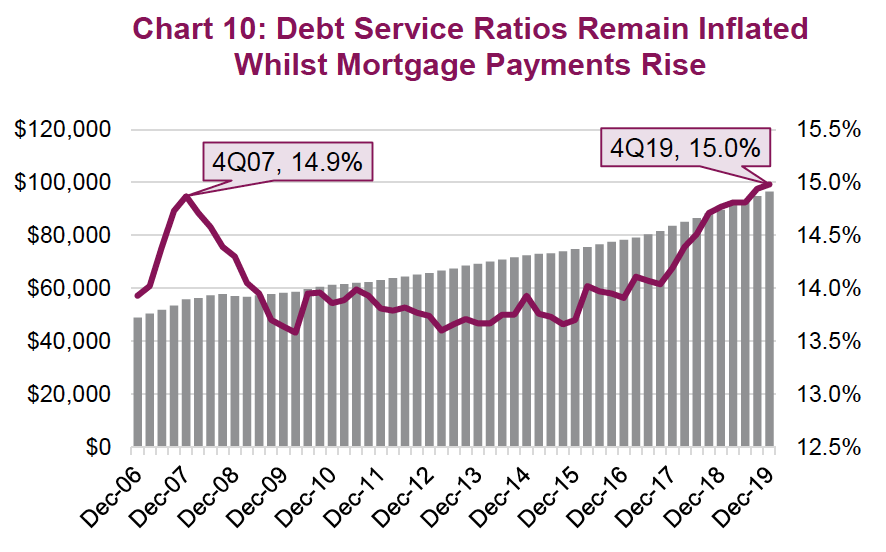
Whilst Mortgage Payments RiseMortgage Debt PaymentsTotal Debt Service Ratio Canadian households were already in a vulnerable spot coming into the new year. Debt servicing costs have risen to pre-Great Recession highs while the size of mortgages rose in lock step with rising house prices (Chart 10). It is safe to say that the Canadian consumer’s balance sheet was stretched thin before the pandemic hit. It is therefore unsurprising that, according to the Canadian Bankers Association, over 13% of Canadians with mortgages at Canada’s large banks have taken advantage of the new payment deferral program announced on March 19, 2020. Elsewhere, Canada Mortgage and Housing Corporation (CMHC) head Evan Siddall took to twitter to defend his organization’s bearish case, stating that those who don’t think housing prices will go down are “whistling past the graveyard and offering no analysis”. We concede, however, that the full extent of the stress remains unknown so long as loans remain in deferral and other government support for workers and business remain in place. Things appear ominous on the other side of the stimulus cliff.
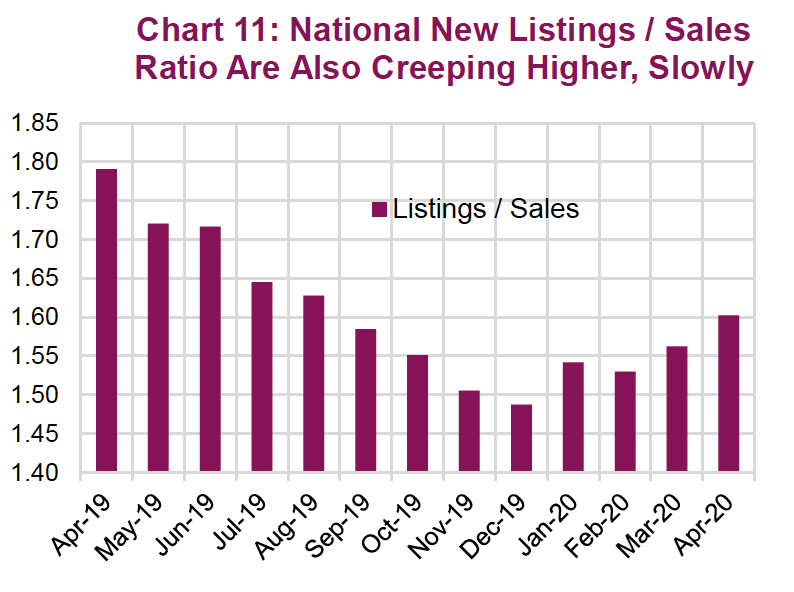
Two of the most important pillars upholding the housing market have been the country’s strong employment conditions and ambitious immigration goals; now, those conditions have been compromised in a big way. Unprecedented unemployment levels and potentially reduced immigration volumes pose threats to demand growth. These concerns come at a point in time when the market was already at risk of falling into a supply glut. For a good part of the last decade, it has been a seller’s market: demand for home ownership has generally outpaced the supply of listed homes, helping drive prices higher. If you use sales volumes relative to new listings as a proxy for the supply demand dynamics, there is a sobering trend. Year to date, the new listings / sales ratio in Canada has begun to move steadily higher (Chart 11). If this were to continue, prices are at risk of falling even lower. This may arise if current employment conditions are sustained or worsened, or if a sudden supply of listed homes were to come to market as a result of real estate investors (a good amount of whom are cash flow negative) offloading their investments.
It is obviously difficult to see how events will play out in this “payment-deferral” environment. There’s no doubt that the Canadian household is in a vulnerable state and the residential real estate sector may face some challenges. In a “post-deferral” world – where tenants can no longer rely on government support, payments ultimately come due, and landlords can once again have the ability to evict delinquent renters – we may very well witness more pain as personal bankruptcies rise, vacancies increase, and the balance of supply and demand tilts towards a glut.
Metropolitan areas may be more protected against this risk, as the high cost of big-city life may possibly force many renters to the outskirts because of affordability. It is well known that there was an affordable housing shortage in Toronto and Vancouver coming into this crisis. On the other hand, demand may prove to be more elastic over the long term within the downtown core, where workplaces more permanently adopt working from home practices and offices are more accessible from expanding public transit. Fringe-suburban residential real estate would be the counter-balance of both of those trends. In either case, upward pressure on insurance and utilities are poised to tighten budgets across the board. Also worth noting is the fact that residential real estate tends to have a degree of correlation to commercial property, which is also feeling extreme pressure in terms of retail, office, dining and malls assets.
Portfolio implications: For investors, making an allocation into this space should be done with caution, a longer-term view, and consideration of your overall real estate exposure if you own a home here and/or abroad. Truth be told, most Canadians already have lots of Canadian real estate exposure. And while the current yields within the public market real estate investment sector may appear compelling, near- to medium-term concerns cannot be ignored.
V. Portfolio construction – a chefs approach
Craig Basinger
Any quality meal (more often made at home these days) does start with quality ingredients. However, any chef or home cook knows it is how the ingredients are combined that often has a bigger impact on the final meal. Too much acid, not enough salt, poor textural differences on the plate can lead to a sub-optimal experience even with top-quality ingredients.
This is the case for portfolio construction as well. Even with the best managers, or ETFs, or individual equities, you can easily have a portfolio that has too much of something and not enough of something else. Clearly, we are not talking about acid or salt now, but instead exposures. Most investors understand exposure to asset classes as a key determinant in the portfolio’s expected return and volatility. Yet this is just the tip of the iceberg as the range of exposures continue to include geographies, currencies, sectors, investment styles and other factors. All this put together, determines performance and volatility.
The investment industry spends a ton of time and marketing efforts on what we would call feature selling. Showing the historical performance or other key attributes of a given fund or manager, as evidence that you should add them to your portfolio. We believe not enough time and effort is spent on understanding how or where that investment fits in a portfolio given the other pre-existing positions. What factors, or geographic exposures or styles are being increased or reduced? Do those changes align with your forward-looking expectations for the market?
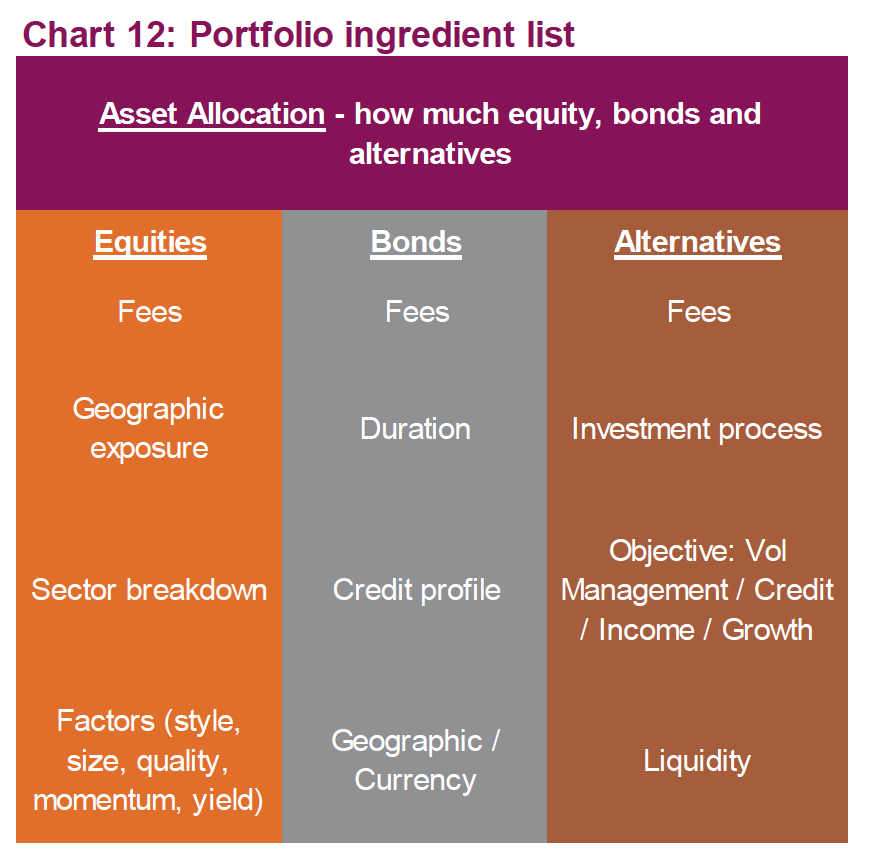
The graphic in Chart 12 is a high-level view of the exposures, factors, bets that we believe should be considered in constructing a portfolio or when making a change to one of the portfolio components. This is in addition to the individual manager / ETF due diligence.
Asset allocation sits atop this framework and we broke down the major asset classes into the key ingredients we consider in our process. Equities for example, we consider fees, geographic exposure, sector weights and factors. What if all the equity managers in a portfolio were overweight the same sectors? Or had a big small cap or style tilt? This approach helps uncover these risks by looking not just at the individual addition or deletion, but how changes fit into the overall meal. A little salt is good, a pound of salt is not.
VI. Managed Portfolios – a closer look at our factor exposures
An Nguyen
The benefits of targeting specific investment attributes, otherwise known as factor investing, has been well researched and espoused by academics and Nobel laureates alike. Factors such as value, size, quality, volatility, yield, momentum, and liquidity have historically shown an ability to capture excess returns over time. The factor premiums earned can be attributed to a number of things including compensation for taking on additional risk, structural market inefficiencies, and behavioural biases. Investments in these factors have grown in popularity as manufacturers have willingly launched products to capture investors’ interest.
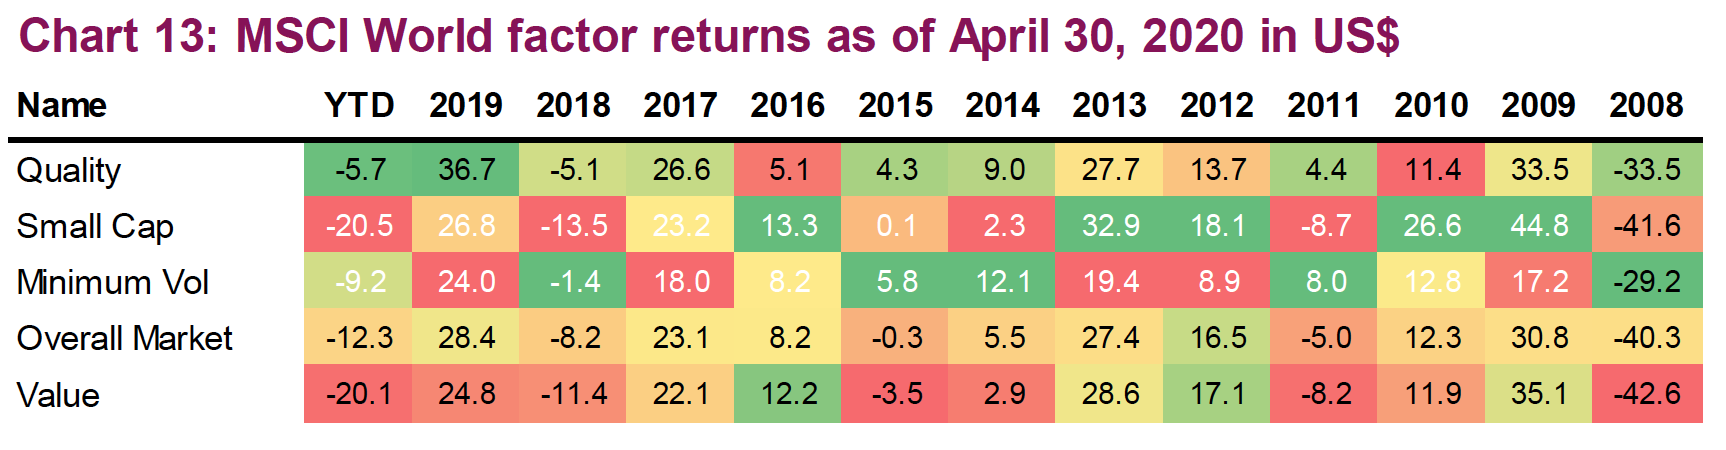
However, a given factor’s contribution to performance is anything but constant. For example, sometimes it is a growth market, sometimes value, other times quality (Chart 13). It is both important to diversify across multiple factors and to understand a portfolio’s overall factor exposures or bets. If you believe the next few years will favour quality or size factors, there is nothing wrong with having larger exposures to these factors. However, having larger exposures to certain factors and not being aware of it is simply poor portfolio management. In Managed Portfolios, we constructed the portfolio to (1) diversify across multiple factors; and (2) opportunistically tilt factors based on our view of where we are in the market cycle.
1. Diversify across multiple factors
While it may seem counterintuitive, having too many managers/ETFs could potentially diversify away a portfolio’s initially targeted factor exposures. At the other extreme, it is also possible that multiple managers/ETFs could unknowingly be tilted to any one factor. To avoid “over-diversification”, or duplication in the Managed Portfolios, part of our due diligence process involves analyzing each fund’s current and historical factor profiles to identify potential areas of drift and to determine if the portfolio has the intended factor risk exposures that were initially targeted.
Chart 14 shows the factor profile percentile ranking of the Canadian and International equity funds and ETFs held in the Managed Portfolios balanced and growth mandates. While each fund and ETF vary in their factor exposures (evident by the wide range of percentile ranking), it is these factor variations that serve as complements to the portfolio in aggregate. Here we will highlight a number of factors to illustrate how our selection of managers and ETFs allows us to diversify the factors in the portfolio.
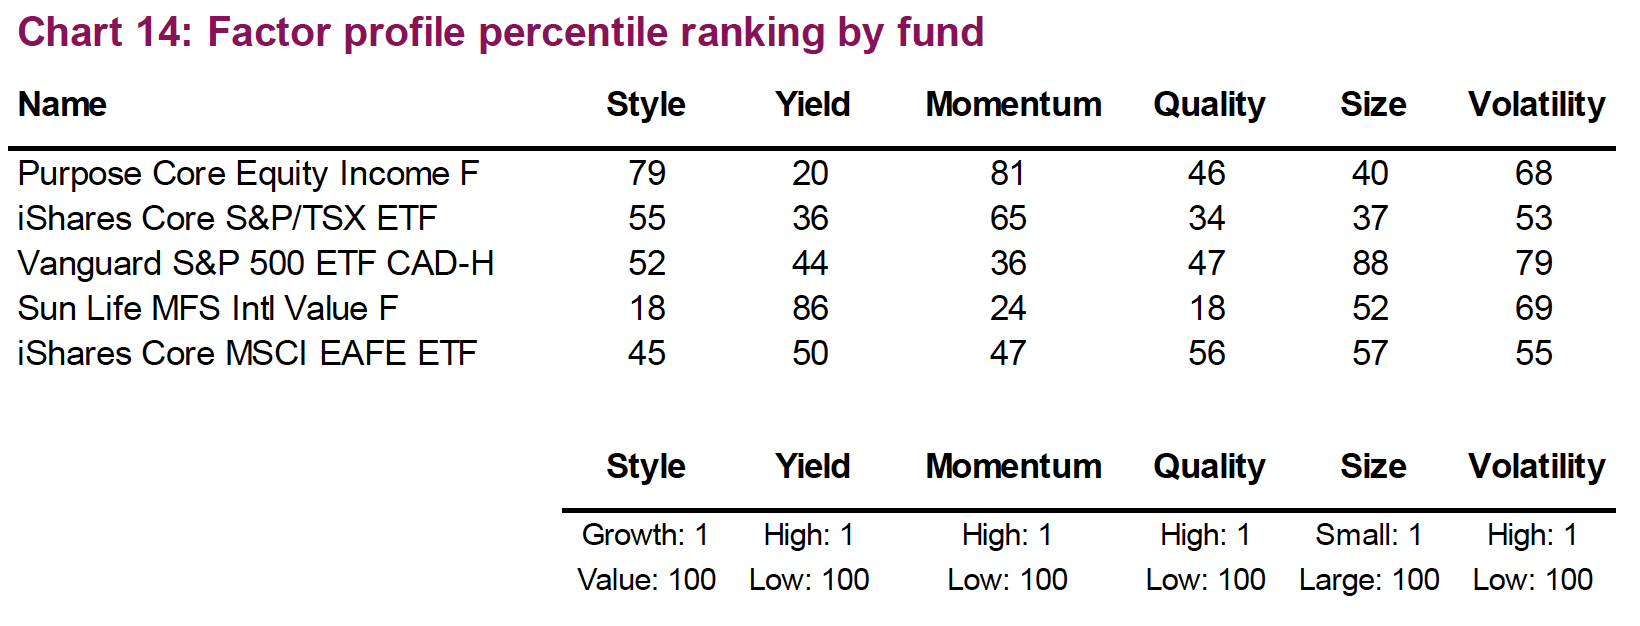
Style (value vs. growth): As expected, the market-oriented ETFs shown in Chart 14 (iShares and Vanguard) are relatively style neutral (ranking is 45-55th percentile). In contrast, the active funds (Purpose and Sun Life) each have distinct style exposures (79th and 18th percentile rank, respectively), which thereby complements the market-oriented ETFs.
Yield: The active Canadian equity fund (Purpose Core Equity Income) has a high exposure to the yield factor (20th percentile) and therefore complements the other funds and ETFs in the portfolio that focus less on yield.
Quality (profitability and leverage): The portfolio’s emphasis on high quality within international equity is emphasized with the selection of Sun Life MFS International equity (18th percentile). Sun Life complements the other international equity holding in the portfolio, a market-oriented ETF (56th percentile).
2. Opportunistic factor tilts
In addition to maintaining the portfolio’s overall diversification across factors, we will also opportunistically tilt one or more factors based on our view of where we are in the market cycle. As Chart 13 shows, factor returns can vary widely and some factors can underperform for significant periods of time. While the objective is not to market time the factor investments, we do want to minimize the potential for the portfolio to have prolonged exposure to uncompensated risk factors. Our decision to slightly tilt two factors in the portfolio, size and volatility, is illustrated in Chart 14.
Size: Exposure to the size factor was minimized in the portfolio over 18 months ago with no direct investments in small-cap funds or ETFs. As small-cap stocks tend to be more sensitive to economic pullbacks, we excluded the asset class based on our view that we were in the very late stages of the business cycle.
Volatility: The funds and ETFs in the portfolio exhibit lower volatility, ranking 3rd or 4th quartile (higher percentile ranking means lower volatility). This is a bi-product of the portfolio’s focus on larger-cap investments which tend to be less volatile than their smaller-cap counterparts.
As factors are an important source of potential risk and return for a portfolio, Managed Portfolios were constructed to diversify across multiple factors. The significant variability in factor returns requires a proper risk-management process, therefore our due diligence process looks to identify factor drift and to determine if the aggregate overall factor exposures align with the portfolio’s initial targets.
*****
Source: All charts are sourced to Bloomberg L.P. and Richardson GMP unless otherwise stated.
The opinions expressed in this report are the opinions of the author and readers should not assume they reflect the opinions or recommendations of Richardson GMP Limited or its affiliates. Assumptions, opinions and estimates constitute the author's judgment as of the date of this material and are subject to change without notice. We do not warrant the completeness or accuracy of this material, and it should not be relied upon as such. Before acting on any recommendation, you should consider whether it is suitable for your particular circumstances and, if necessary, seek professional advice. Past performance is not indicative of future results. The comments contained herein are general in nature and are not intended to be, nor should be construed to be, legal or tax advice to any particular individual. Accordingly, individuals should consult their own legal or tax advisors for advice with respect to the tax consequences to them, having regard to their own particular circumstances. Insurance services are offered through Richardson GMP Insurance Services Limited in BC, AB, SK, MB, NWT, ON, QC, NB, NS, NL and PEI. Additional administrative support and policy management are provided by PPI Partners. Insurance products are not covered by the Canadian Investor Protection Fund.
Richardson GMP Limited, Member Canadian Investor Protection Fund. Richardson and GMP are registered trademarks of their respective owners used under license by Richardson GMP Limited.
©Copyright June 1, 2020. All rights reserved.


