
by Talley Leger, Invesco Canada
As the world remains in the grip of the coronavirus, we’ve received many questions about the outlook for Chinese and emerging market (EM) stocks – as China was ground zero for the pandemic. First and foremost, we’re asked what the challenges and opportunities are for that country and region?
Meanwhile, U.S. and developed market (DM) stocks have delivered outperformance for the past decade or more. Will they continue to do so?
In many ways, we’re witnessing the environment change and evolve in real time. From a market perspective, perhaps the twin external shocks from the coronavirus and plummeting oil prices may prove to be the catalysts for shifting leadership among regions and countries.
In our view, the outlook for Chinese and EM stocks may be better than many investors believe because of a combination of factors: 1) China’s ironclad response to the coronavirus and a flat case count; 2) a re-opened economy and rebounding business activity; 3) cheaper valuations; 4) unprecedented U.S. Federal Reserve (Fed) support and a bearish technical setup for the U.S. dollar; and 5) the relative outperformance of Chinese stocks year to date, which we expect may continue. Each of these warrants closer examination.
1. Coronavirus cases
China was the first to implement draconian social-distancing controls and mass shutdowns to contain the coronavirus. The result was a relatively symmetrical flattening of the case curve, whereas the U.S. continues to witness growing infection rates.
Figures 1 & 2. China has seemingly “flattened the curve.” The same cannot be said of the U.S.
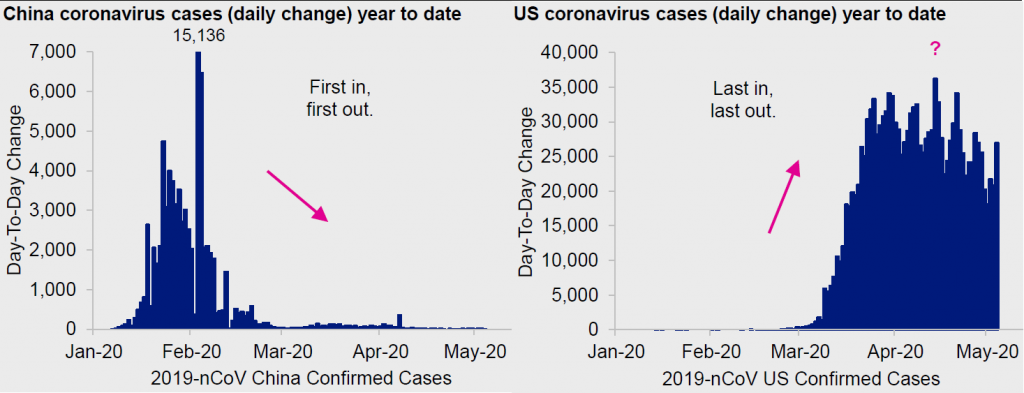
Source: Bloomberg L.P., Invesco,05/14/20. Notes: Left chart scale capped at 7,000. Confirmed coronavirus (2019-nCov) case counts compiled by Bloomberg Newsroom. Counts are subject to change as governments survey and confirm cases. Data are based on reported values as of midnight EST.
2. Business activity
Such extreme, yet effective, measures in China came at a steep cost – Beijing sacrificed near-term economic growth, which plummeted to its worst levels on record. Presently, however, China’s economic activity is rebounding in a v-shaped fashion, as evidenced by the sharp improvement in its Purchasing Managers Index.
By comparison, growing infection rates in the U.S. likely mean the worst of the economic damage may be yet to come.
Figure 3: Chinese business activity is staging a v-shaped recovery – rebounding sharply from record lows – while U.S. activity is falling off the “COVID cliff” to record lows.
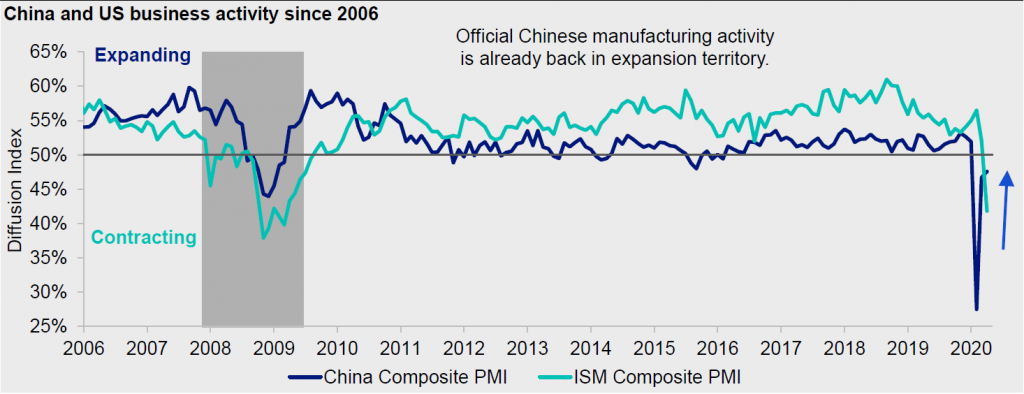
Source: Caixin/IHS Markit, Haver, Invesco,05/14/20. Notes: Composite = Manufacturing + services. ISM = Institute for Supply Management. PMI = Purchasing Managers Index. Shaded areas denote National Bureau of Economic Research (NBER) defined U.S. economic recessions. Diffusion indices have the properties of leading indicators and are convenient summary measures showing the prevailing direction and scope of change.
3. Valuations + catalyst
As one would expect, structural U.S. outperformance inflated developed market valuations relative to the global benchmark, to emerging markets and to history. The rule of thumb is that overpaying for an asset reduces its prospective return over the long haul.
On the flip side, structural EM underperformance – China – has compressed valuations to deep discounts. We believe compelling opportunities exist for investors in EM stocks at a time when many emerging economies – especially those in Asia outside of Japan – are recovering from the virus-related “sudden stop” in activity.
Leading indicators of business activity across the emerging world— – and South Korea, in particular – have been proving more resilient than those of the developed world, including the U.S., Europe and Japan.
Low valuations and improving economic growth could be a powerful combination for unlocking the potential reward embedded in EM stocks.
Figure 4: Not all regions and countries are made equal. For selectivity, consider targeting low valuations and faster growth over high valuations and slower growth both across and within regions.
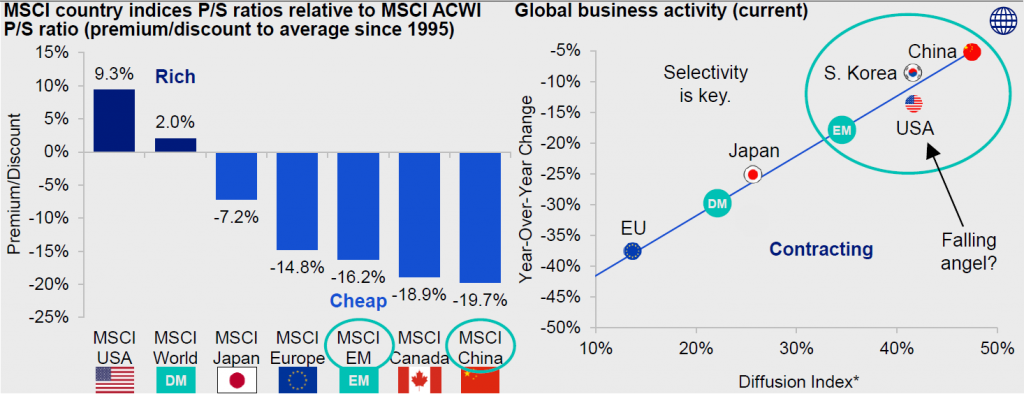
Source: Bloomberg L.P., Haver, Invesco,05/14/20. Notes: P/S = Price-to-sales ratio. Ranked from left to right—from highest premium to lowest discount. ACWI = All Country World Index. EU = European Union. EU Excluding UK Composite PMI = France, Germany, Ireland, Italy and Spain. Diffusion indices have the properties of leading indicators and are convenient summary measures showing the prevailing direction and scope of change.* An investment cannot be made in an index. Past performance does not guarantee future results.
4. U.S. dollar
One major challenge for EM is the U.S. dollar (USD) liquidity shortage and associated upward pressure on the currency. However, the Fed – together with a host of other major central banks – is doing its part to boost U.S. dollar-based liquidity and tamp down the USD. At present, it appears the currency has stopped going up at such a rapid pace.
Looking ahead, we believe the USD is unlikely to remain an obstacle for investors, as the currency faces challenges in the form of ballooning U.S. fiscal and current account deficits, overvaluation and overbought extremes that warn of a structural bear market for the greenback.
In our view, much of the bad news has already been priced in, so investors shouldn’t get too pessimistic on EM shares. History shows that bull markets are born in despair and die in euphoria; we seem to be closer to the former than the latter. Similarly, oversold extremes in the late 1980s and early 2000s were followed by multi-year periods of EM outperformance. If past is prologue, this may be another one of those episodes.
Figures 5 & 6: A flat to weaker U.S. currency could boost EM stocks relative to their U.S. competitors. Also, EM stocks bottomed in the depths of the last 3 U.S. economic recessions – important chapters of the “recovery playbook.”
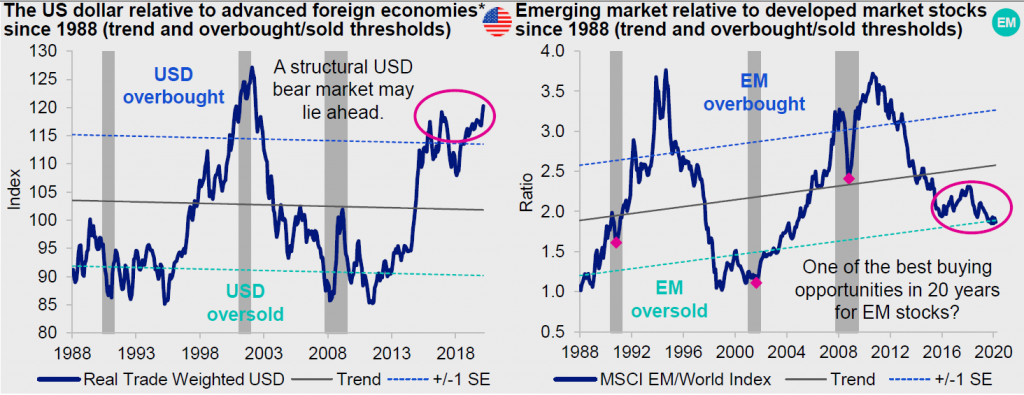
Source: Bloomberg L.P., FRED, Invesco,04/30/20. Notes: USD = U.S. dollar. The Federal Reserve’s (Fed’s) Real Trade Weighted U.S. Dollar Index: Advanced Foreign Economies, Goods and Services*. Real = Inflation adjusted. Price indices in U.S. dollars. SE = Standard error. Shaded areas denote NBER-defined U.S. economic recessions. An investment cannot be made in an index. Past performance does not guarantee future results.
5. Relative performance
How is the thesis playing out? We believe Chinese stocks have outperformed their U.S. counterparts because of cheaper valuations, an ironclad response to the coronavirus, rebounding fundamentals and unprecedented Fed support.
In our opinion, the key for sustained long-term outperformance remains the USD. While the Fed’s doing its part to slow the currency’s ascent, investors’ appetite for risk may have to firm for the USD to calm down. Perhaps Chinese stocks are already anticipating that outcome.
Figure 7: Chinese stocks are leading the charge, a trend we expect may continue.
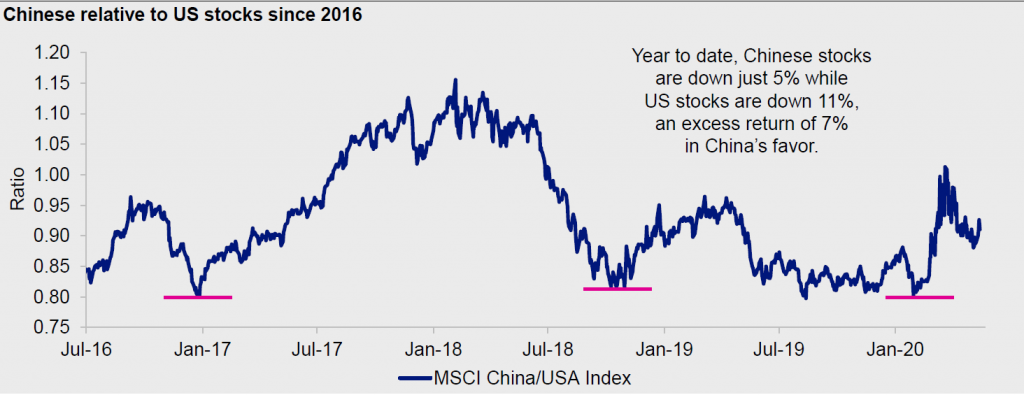
Source: Bloomberg L.P., Invesco,05/14/20. Notes: Total return indices in U.S. dollars. An investment cannot be made in an index. Past performance does not guarantee future results.
This post was first published at the official blog of Invesco Canada.