by Hubert Marleau, Market Economist, Palos Management
What Happened In the Market Last Week:
Everybody should know by now that we are in a deep recession and that economies around the world are collapsing. Measures of economic activity in Europe, Japan and North America are hitting lows not because people don’t want to spend or business doesn't want to produce but because it was engineered by governments responding to a pandemic. Economic prints are hitting record lows because efforts to contain the spreading of the virus have halted travel plans, forced businesses to shut their doors and kept people indoors.
If we learned anything during this crisis, it should be that betting against the fiscal and monetary policymakers is dangerous. The Federal Reserve used a sledgehammer to slay the systemic credit risk and a tsunami to induce banks to make loans. The broad money supply is growing at the highest rate in modern history. On a year over year, MZM is up 16.2%. Given that the Fed’s monetary base totals $4.9 trillion (23% of N-GDP compared to 45% in the E.U. and 110% in Japan ) and excess reserves in the banking system hit a record total of $3.0 trillion this week, the banks will surely keep on lending money at a record pace. Put together, enough stimulus has been provided to lift the economy when it starts opening up later in 2020.
It explains why the cautious sentiment that gripped the stock market this week was not overwhelming. Moreover, there was a lot of news reflecting that the outbreak is perhaps sufficiently under control in many countries for them to start lifting restrictions on social and economic life, somewhat. As a matter of fact, there is vigorous debate taking place on when and how exit strategies should be implemented.
In the week ended April 24, the S&P 500 decreased 1.3% to 2837, within the trading range (2550 to 3050) that I calculated last week as being appropriate given the ongoing narrative that 2020 is a write off, 2021 will be the restoration and 2022 the reformation. In this connection, my strategy of buying dips and selling rallies is still in force because the idea that the lockdown will eventually end still holds. However, it may be wise to be a bit more cautious than brave from hereon. The differential between market price and economic value has narrowed. Traders have tightened the trading range distribution. At the closing on Friday, the EPR for the S&P 500 was 4.85% versus the highs of 6.00+ in March. There is still plenty of room to make some decent money. Given the massive suppression of the discount rate and credit spreads, the present value of future earnings is above the pre-crisis level.
A survey by Brendan Wood International revealed that 91% of professional investors believe that market prices will return to the January 2020 levels within the next 12 months.
The Barron’s latest Big Money Poll indicated that portfolio managers were anxious about the near term. Yet, only 20% of the respondents believed that the stock market is overvalued. Only 39% of money managers say they’re bullish about the outlook for U.S. equities this year, 20% are bearish, and 41% describe themselves as neutral, But 83% are bullish on the prospects for equities in 2021, while a mere 4% say they are bears.
Meanwhile, another survey by the American Association of Individual Investors showed that bears outnumbered the bulls on April 22 by a margin of 2-to-1. It looks bad, but not according to my dear friend, Leon Tuey. Leon is a highly reputable technical analyst. He wrote to me: “when the Bulls reach 25% or lower and when the Bears exceed 40%, the market stands at a low-risk and high-reward juncture point.”
Nevertheless, the big risky and richly profitable trades are likely to be more limited now and exaggerated returns are probably behind us. The markets are normalizing. Many stocks that make up the S&P 500 Index are creeping up to their 200-day moving average and volatility is taming. It essentially means that crash downs and melt ups might be running out of steam. We have already had 4 circuit breaker events in 2020 to give time for the stock market to restore a balance between supply and demand. Except for the seismic shock in the oil market, the price movements in the copper, bond and foreign exchange markets were subdued and docile. The St. Louis Fed Financial Stress Index fell 72 bps to 130 in the week ended April 17, the fourth straight weekly decline. On March 20, the index peaked at 548.
The North American Oil Complex:
The North American oil market is highly complex. It’s dominated by sophisticated traders and hedge funds that have information and experience that retail investors do not possess. It raises the question as to whether individuals are suited to invest in a commodity that requires at least some basic knowledge of how it works. This brief is an attempt to clarify the workings of the oil market.
Contango Versus Backwardation: A Brief Explanation
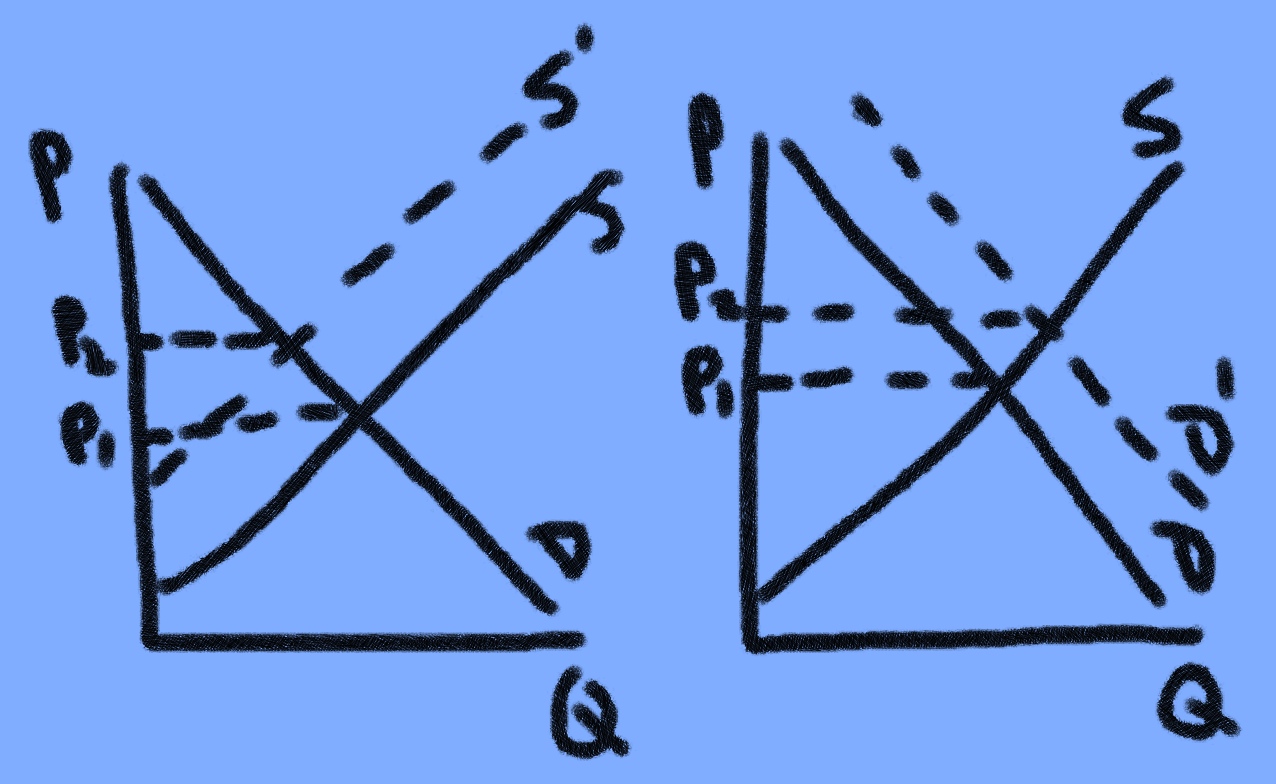
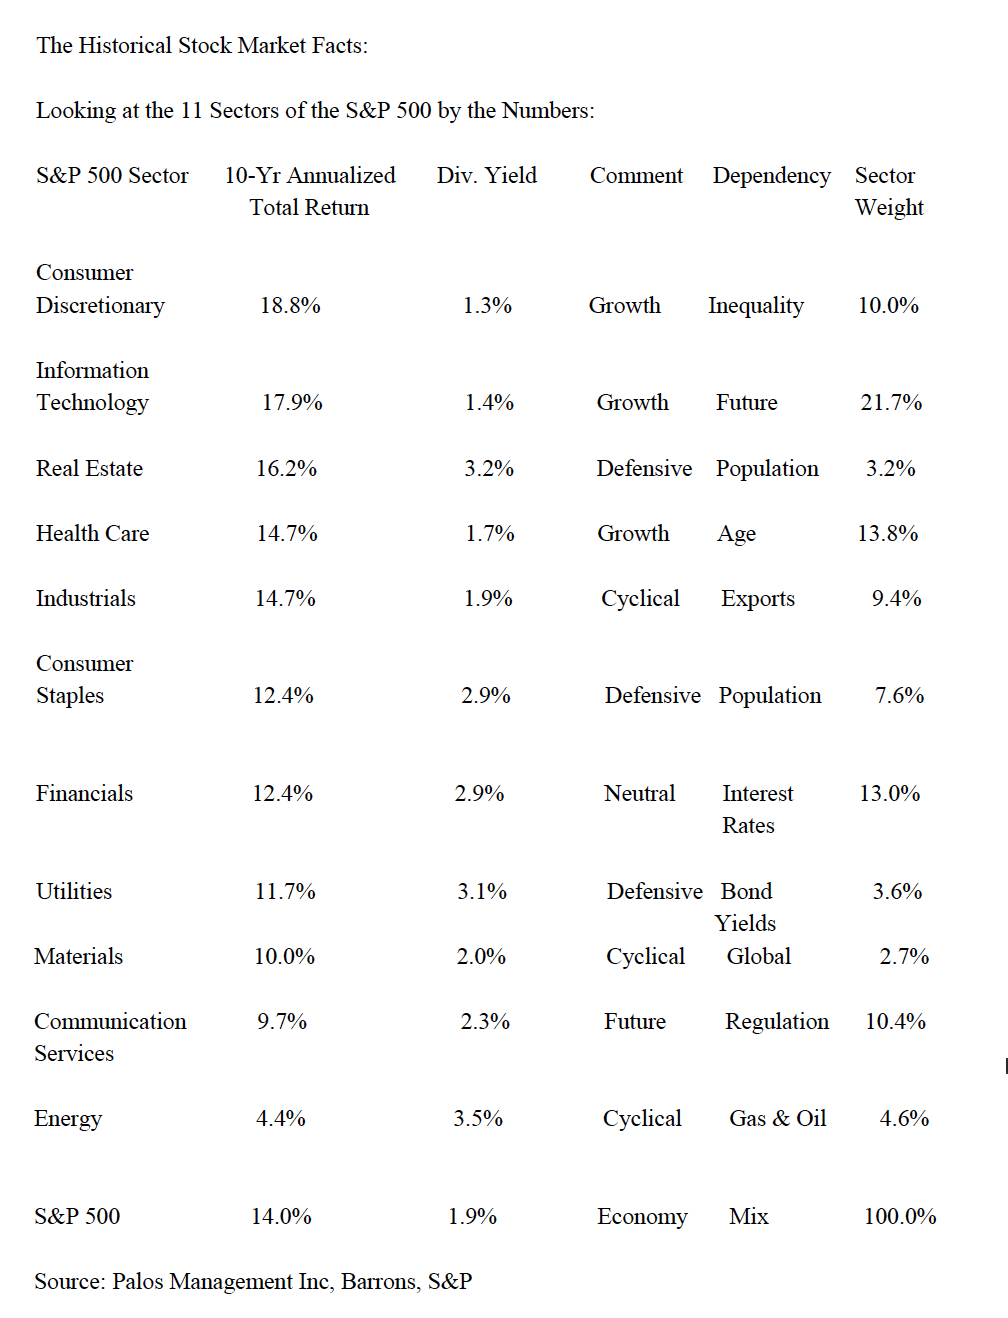
The oil market is said to be in a contango mode when front month contracts are priced below contracts with later expirations. A progression of higher contract prices out on the futures curve is usual because it reflects normal market conditions--that is steady supply and demand, interest rates and storage costs.
The oil market is said to be in a backwardation mode when front month contracts are prices above contracts with later expirations. A progression of lower contract prices on the futures curve is unusual because it reflects a stronger than normal increase in demand for immediate delivery combined with aggressive hedging by producers who are either satisfied with the profit that they can make with the average strip prices or believe that oil prices are abnormal and bound to fall.
The Complexity of Trading Oil: A Succinct Explanation
Trades in oil futures are contracts in which a buyer locks in a purchase at a stated price and time. Futures are a tool for users of oil to hedge against price swings and for speculators to make bets. A contract expires when these financial derivatives held by speculators intersect with the real world of pipelines, storage tanks and refineries. Oil contracts run for a set period of time that can be as long as ten years. The run is called the STRIP.
Interestingly, the bulk of the activity in these contracts takes place in shorter maturities--that is one to nine months--and only 3% of the transactions executed by commercial operators actually take possession of the oil. Given that most of the action in the market WTI contracts is done by speculators who do not wish to physically hold positions in crude oil, they always roll over into new contracts because they do not have the luxury of settling in cash at the expiration date like the Europeans can in the Brent market.
A Chaotic and Unprecedented Wipeout In the Flagship WTI Oil May Contract:
The U.S. Department of Energy wrote “Typically, most market participants close any futures contracts ahead of expiration through cash settlements in order to avoid taking physical delivery, and only about 1% of contracts are physically settled. The extreme events of April 20 and April 21 were driven by several factors, including the inability of contract holders to find other market participants to buy the futures contracts. In addition, in this case, the scarcity of available crude oil storage meant several market participants could not take physical delivery at expiration and resorted to selling their futures contracts at negative prices, in effect paying a counterparty to take hold of the contracts.”
Indeed, something bizarre happened last Monday. Commercial operators did not want to pay with good money for a May oil contract that was about to expire because there was way too much unwanted oil sloshing around with no place to store it. Many oil storage companies reported that they were sold out. Given that WTI crude is landlocked, storage space was extremely expensive or became next to impossible to physically settle in a normal way. Thus, the theory that spot price can go just about anywhere when there are no takers proved true. Negative prices became a possibility.
Last Monday, the price on the May futures contract for West Texas Intermediate crude oil plunged to an historic low of minus $37.63 a barrel. The expiration date flushed out the speculators and several ETF oil funds, which controlled a large number of those derivative contracts with no intention of taking delivery. They were forced to clean their long positions at fire sale price.
The reality is that the speculators who believe that higher oil prices were coming miscalculated. The global energy complex is not an abstract notion with just dots on a screen where something of value like oil cannot be worth zero or less. It’s a good example of financialization bumping up against harsh reality--- abstraction colliding with the tangible. Without storage capability there is not much utility in short end futures contracts. In other words, these instruments that market participants dabble in cease to have meaning beyond certain thresholds.
The CME might have no other choice but to close out certain oil ETFs mainly holding June WTI contracts which possibly could go negative again before they roll into July contracts. What happened on Monday was not a one-day phenomenon. The market surplus needs to be resolved.
The Narrative Behind the Epic Oil Wipeout:
A supply glut ---driven by Saudi Arabia and Russia who butted heads in their recent price war flooding the world with oil because they opened their taps to the fullest, and by vanishing demand as people seek shelter and lockdowns dried international trade---has filled storage tanks and oil tankers near full. The American Petroleum Institute (API) estimates that global oil production is still around 100 million barrels per day. Yet, demand is currently 70 million barrels.
According to Rystad Energy, the storage hub in Cushing Oklahoma, has only 21 million barrels of free storage left--that is less than two days of American production. Normally, there is more than 50% of spare capacity. At the current rate of production, oil experts are forecasting that the storage tanks will be filled to the brim because refineries are curbing operations. The API has calculated that total U.S. storage capacity is about 825 million barrels and previously never exceeded 500 million barrels. Now less than 100 million barrels of storage is left.
The only way to end this catastrophe is to stop lifting oil out of the ground. That is easier said than done. For some producers it is cheaper to keep on producing and finding some temporary relief than shutting down production, even if it’s very costly. Shutting wells can bring permanent damage.
Nevertheless, the advent of negative oil prices has sent a very strong signal to OPEC + and G-20 producers of the dangers facing the global oil complex. Oil-producing nations already have strained budgets as public finances and foreign reserves have come under severe pressure. Even wealthy nations such as Saudi Arabia, Qatar, Kuwait and UAE who have oil price fiscal breakevens above $50 a barrel need to grapple with the latest price fall.
They have no other choice than to make deals in a coordinated fashion to manage the situation otherwise the industry will be subject to an even more violent rebalancing. Given the immediacy of the problem, President Trump announced that SPR will buy 75 million barrels on an asap basis, the Texas Railroad Commission, which regulates energy in Texas, may impose production quotas, the administration is considering raising tariffs on foreign oil, producers with ample reserves are trying to sell what is in the ground. The White House will surely come up soon with a plan to prevent a total shutdown of the industry.
The bottom line is that the oilpatch got a warning call. I suspect that by 2021, there could be a severe supply loss resulting from reduced capital investment, increased bankruptcies, shut-ins across the U.S. shale oil basins, decreased exploration activity, increasing declining rates, volume rejection by pipelines and falloffs in conventional projects. It is said that as much as 6 mb/d needs to be curtailed before the market will be willing to price a sustainable recovery.
Market satisfaction will be expressed by the behavior of the strip. A near term decrease in supply combined with an expectation that demand will rise later in the year would be reflected in the contango behaviour of the strip. In this respect, the longer term contract prices of last Tuesday for September and beyond could be considered as a meaningful base to eye market conditions. On Tuesday, WTI oil Sep 2020 traded for $27.84, Nov 2020 for $29.12 and December 2020 for $29.95. What investors would like to see is a rally in the front end prices that would reflect production cuts and the maintenance of a contango shape term structure which would lead to an eventual return of demand. It looks at this time that the aforementioned scenario is unfolding.
Given that the current demand drop is transitory, the expected decrease in production should release what is in storage as the lockdowns ease and eventually bring back a better match between supply and demand. Thus, there will be a time in the future, perhaps in 2022, the market price of WTI oil may start to reflect the $40 marginal cost of producing a barrel of oil. John Authers, a Bloomberg commentator, pointed out that Jim Reid, a financial historian at Deutsche Bank made an interesting observation about “Oil in Very Long Perspective”. Mr. Reid traced the real price of oil in dollar terms from 1870 to today. His chart shows that a barrel of oil is presently cheaper than it was in 1870. He also said that over the same period, U.S. inflation has risen 2870% and the S&P 500 3,174,505% in total return. John Authers made the following remark. “Can there be any other financial asset that is cheaper than it was a century ago?” It’s curious that the average price over all that period, in current dollars, is about $46. That is $6 above the estimated marginal cost of production. It means that an average producer should not expect to make a profit of more than $6 a barrel over time.
In my view, a $6.00 profit may be as good as it gets. The year 2019 may mark the all-time peak in global oil demand--100 million barrels a day. The backlash against globalisation, the increasing efficiency of electric vehicles and better gas-mileage of cars has brought a plateau in oil consumption. According to the EIA, U.S. the highest level US demand to date was registered all the way back in 2005 at 20.8m b/d. The persistence of such a trend could lead toward a backwardation strip of higher front-end prices than back-end prices.
Given that trading in oil futures is concentrated in the earlier maturities, I tend to look at WTI and Brent crude’s front month contract and the following nine months. On Friday, the WTI spot price was ($17.11) and in July 2020 was ($21.46) and Mar 2021 ($29.97). Comparatively, the Brent spot price was ($21.84) and July 2020 was ($25.14) and Mar 2021 ($33.44). Monitoring the term structure, known as the STRIP, on a regular basis could become instructive and helpful for those who are willing to make bets in the oil patch.
Copyright © Palos Management