


by Brooke Thackray, Horizons ETFs
Up until the week of March 23rd, stimulus and fiscal packages from the central banks and the governments were met with investor skepticism. It seemed that every attempt to support the economy caused selling in the stock markets. In the week of March 23rd, investor sentiment shifted. The overwhelming number of fiscal packages from governments and monetary stimulus from central banks around the world, convinced investors that the economy would be able to survive the effects of Covid-19.
Investors are wondering if the current “bounce” in the stock market is the start of a strong rally that will carry the S&P 500 up to its old highs, or if it is a bear trap (a rally in a bear market that once it clears opportunistic buyers and investors covering their short sell positions, the bear market resumes).
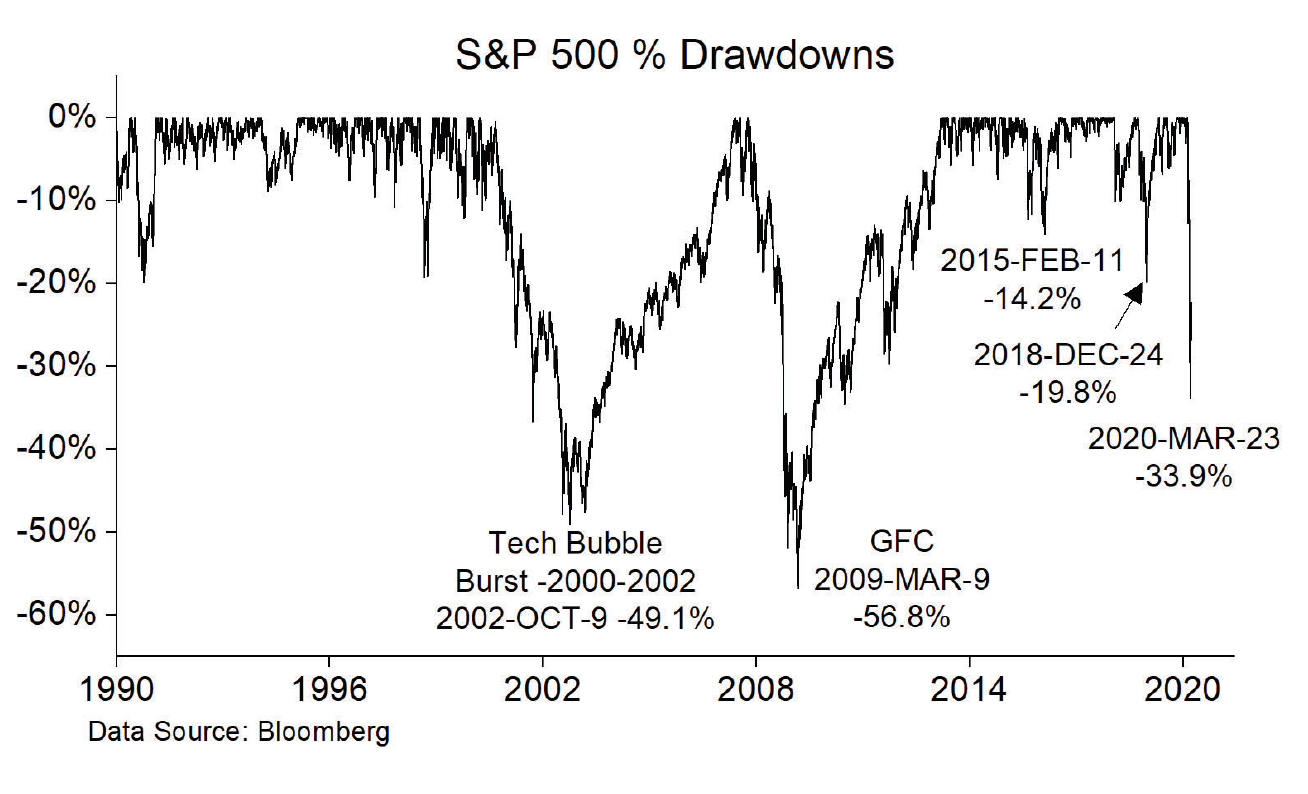
One of the unique characteristics of this bear market is the speed that the stock market has dropped. The velocity (drop in short amount of time) has been unprecedented. Even in the Great Depression, the stock market did not drop as fast in such a short amount of time. In its current correction, the S&P 500 fell 33.9% in 23 trading days from its peak of 3,386 on February 19, 2020 to 2,237 on March 23. The size and speed of this decline can be seen in the drawdown graph below.
The bursting of the Technology Bubble (2000-2002) took a total of 183 trading days for the S&P 500 to reach a 33.9% decline (same drawdown level in 2020) and 637 trading days to reach its bottom of a 49.1% decline on October 9, 2002. The Great Financial Crisis (GFC) took 251 trading days to reach a 33.9% decline and a total of 355 trading days to finally reach a decline of 56.8% on March 9, 2009. At the time, the speed of both of these bear markets seemed fast, but they have proven to be much slower than the speed of the decline in 2020.
Unlucky 8 - Failed rallies at 8%
In the section below, I analyze rallies of 8% in the S&P 500 when corrections of 10% or greater have taken place off new highs. I use the 8% gain as a threshold for a rally within a correction and a subsequent 8% correction to reset before another rally can be counted. The grey bars in the graphs below represent 8% failed rallies where a new high was not established. There is nothing magical about an 8% rally, but it does illustrate that a rally approximately the size of the average annual return for the S&P 500 since 1950, does not guarantee that the stock market is necessarily rallying to new highs.
Even in bear markets, there are typically some counter-rallies. During the recent longest bull market in history, investors have been rewarded for buying the dips (BTD). After corrections, investors would look back and typically proclaim that buying the dips is a good long-term strategy. In a strong bull market, the strategy pays off. The result of so many investors and institutions buying the dips, created a buying loop that substantially reduced volatility, which in turn helped to justify putting more money into the stock market, pushing prices higher once again.
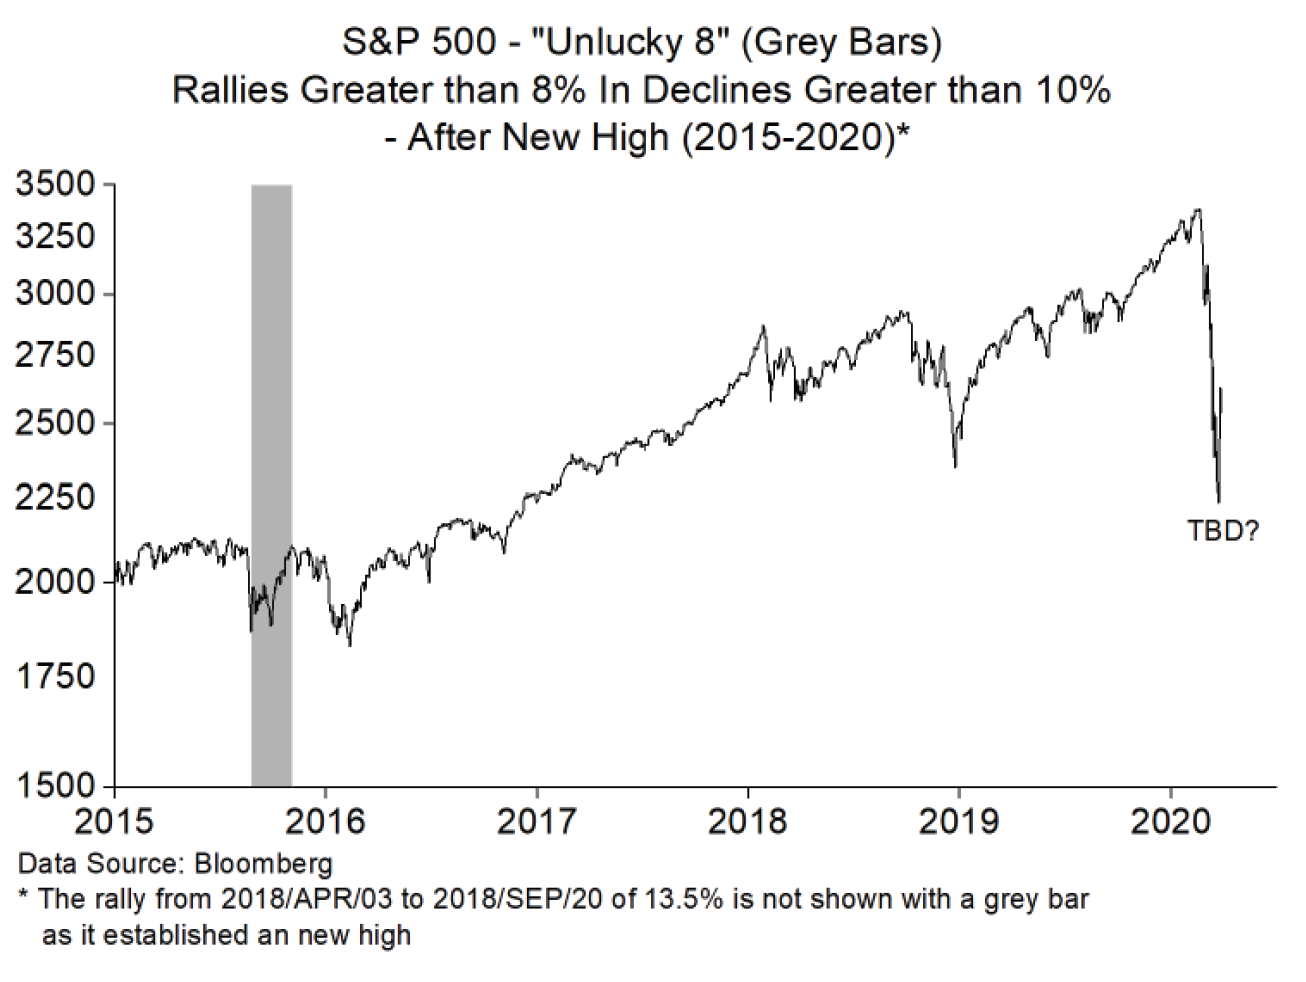
The last correction in the S&P 500, which occurred in 2018 caused a lot of angst with investors at the time, but the stock market rebounded out of the correction and moved to all-time new highs. When the stock market was declining in the Q4, there were not any significant rallies in the stock market. The stock market moved down, sometimes with a quick drop, but there were no rallies above an 8% threshold. A rising stock market was a signal to get back in. Buying the dip once again paid off.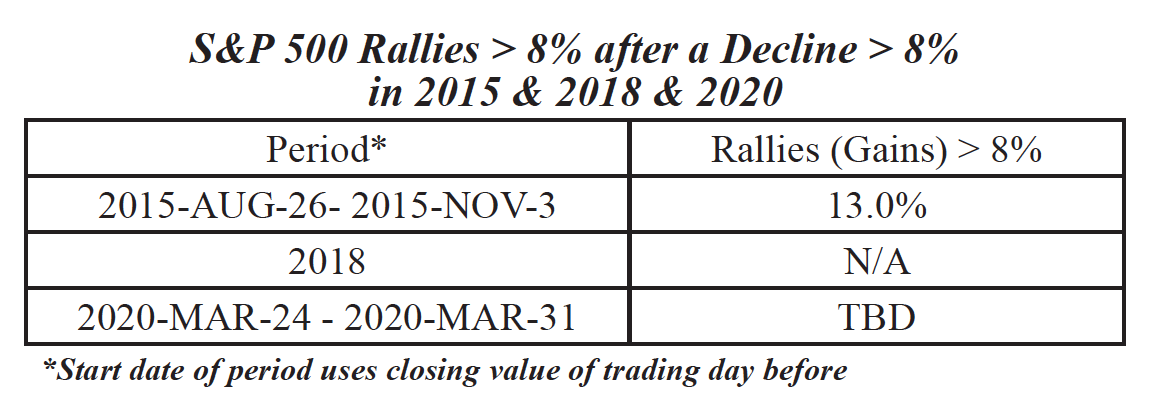
In the 2015/16 correction, the S&P 500 peaked on May 21, 2015. It fell 12.3% and then rallied 13.0% from August 26, 2015 to November 3, 2015; before correcting once again and putting in a final bottom on February 11, 2016. Most investors equate the correction to have started in late in 2015. The peak in the S&P 500 on November 3, 2015 was just marginally below the previous peak of May 21, 2015. As such, once again the perception was that if the S&P 500 starts to rally after a correction, it is good to join the party as buying the dip works .
In both the corrections in 2015/16 and 2018, the perception that the monetary policy was fl awed because it was too tight, was the primary cause of the stock market decline. Once the Federal Reserve was able to convince investors that they had made a mistake and a change in monetary policy was underway, the stock market forgave the central bank and pushed the stock market higher. In other words, a change in monetary policy fixed a perceived monetary policy problem. The experience that investors had with buying the dips in both 2015/16 and 2018 was that it works, as new highs were established not long after the stock market bottomed.

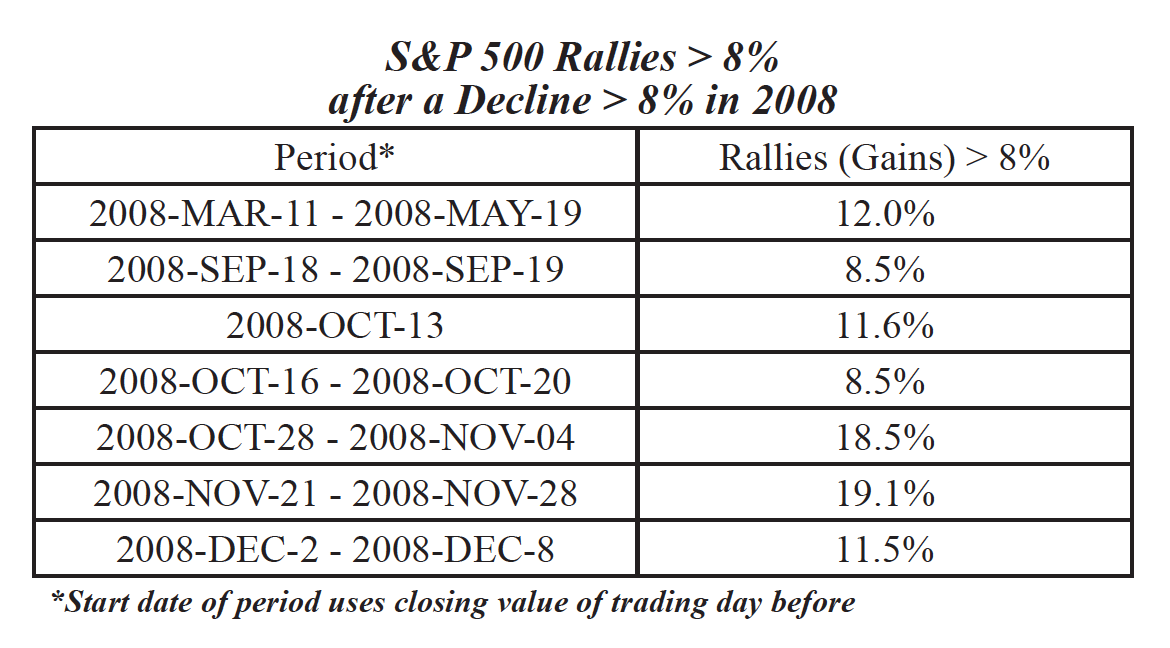
A correction in the stock market without any strong counter rallies and further declines is not the norm. If we look back at the Great Financial Crisis (GFC), there were six rallies of greater than 8%, as the stock market worked its way downwards. In each rally, investors believed that the correction was over and it was time to get back into the stock market- they were wrong as the rallies were bear traps. The stock market needed more time to move lower.
The current decline in the stock market is not a monetary issue, so the Federal Reserve, like 2008/09 cannot fix the problem. It is a health issue, which has caused governments to engineer an economic coma. The Federal Reserve can only provide stimulus to help stabilize the markets, hoping to counteract the economic slowdown.
Most businesses in North America are not allowed to function during the Covid-19 pandemic, so it does not matter how low the Federal Reserve lowers its federal funds rate, it is not going to create economic growth at this time. A lot of investors are betting that the stimulus from the Federal Reserve will help to push the stock market much higher when the Covid-19 crisis is over, but it is difficult to say that their actions will dramatically promote economic growth.
In the 2008/09 Great Financial Crisis, governments around the world chose not to take action and instead let the central banks play an active roll. In this crisis, governments are introducing all sorts of fiscal programs. They are mainly designed to help people, families and companies survive. They are not, so far, designed to stimulate economic growth above and beyond what existed before the current crisis. Even if they were designed to increase future productivity, such as well targeted infrastructure spending, the benefits would not be realized for more than a year.
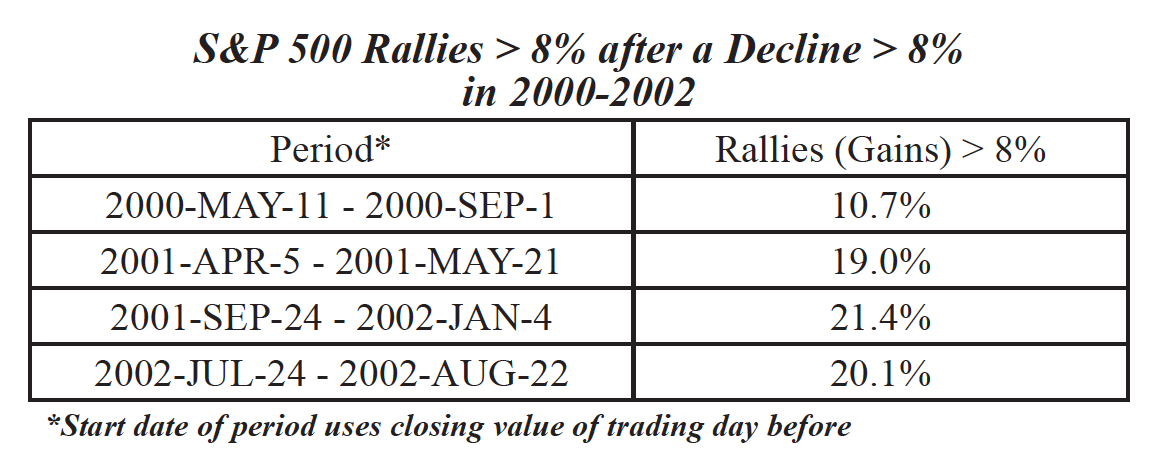
The decline of the S&P 500 in the technology bubble bust in 2000-2002 was largely the result of an overstretched market based upon valuations. Although the federal funds rate was not as low as today, investors believed that the Federal Reserve had their “backs,” and would step in to support falling stock markets. Greenspan, the chairperson of the Federal Reserve at the time had previously bailed out hedge funds when they suffered a liquidity crisis. In 1998 when hedge fund Long Term Capital Management was teetering on the verge of collapse and threatened to bring the financial system down if it imploded. Greenspan orchestrated a survival package and pumped liquidity into the market in order to stabilize the financial system. In the technology bubble, the stock market became very susceptible to a major correction because of extreme speculation and euphoria. When the stock market did turn lower, it was almost a two year process of grinding lower. In the process, the S&P 500 rallied four times more than 8%. Each time the stock market rallied, many investors believed that the bottom was “in,” with the lows of the market in the rear view mirror. They were wrong up until late 2002.
The Federal Reserve tried to counter the falling stock markets with lower federal funds rates. It helped mitigate the damage, but it did not stop it. There was too much leverage in the system and it had to work its way out.
A Seasonal Perspective
Seasonal trends for the stock market and sectors are based upon on average outperformance occurring at certain times of the year as the result of a causation factor that occurs on a yearly basis. There are many factors that effect the performance of the different sectors of the stock market, or the broad stock market. Over the long-term, seasonal factors have been shown to be beneficial for investing. In any one year, a large endogenous event can take place and overwhelm, seasonal tendencies, technical indicators and fundamental analysis.
Covid-19 has reeked havoc in the stock market in its favourable six-month period that lasts from October 27 to May 5. With a global pandemic event, seasonal trends are going to be overwhelmed. Many investors may surmise that because the stock market is performing poorly in its seasonally strong period, the seasonal tendencies have been thrown off and he stock market is likely to move higher in its unfavourable seasonal period (May 6 to October 27). This is not necessarily true. It could happen, but it is not guaranteed or more likely to happen.
The unfavourable period for the stock market is just weeks away. Just because the stock market is moving into its weaker six-month seasonal period starting in May 6th, it does not mean that there are not any seasonal opportunities. There are a number of seasonal investment opportunities that occur in the weaker six-month period for the stock market, including: consumer staples, utilities, health care, biotech, gold, government bonds, broad stock markets at certain times and other opportunities.
Over the long-term, on average, over the full six-month unfavourable period, investing on a seasonal basis has generally reduced risk compared to the broad stock market. Given the current market situation, a seasonal investing approach is probably a good strategy to help reduce risk in the transition into the six-month unfavourable period for the stock market.
To Answer the Question - Melt-Up or Bear Market Rally?
No one knows if we have bottomed already or are in a bear market rally. The Covid-19 pandemic is unique and cannot be “solved” by central banks and governments. In 2015/16 and 2018, central banks were able to save the day because they fixed the problem that they created. This is not the case in the current situation. As a reference point, the declines in 2000-2002 and 2008-2009 are better comparables. In both of these bear markets, multiple rallies greater than 8% failed. This does not bode well for the current decline in the stock market.
Many investors are looking forward to the future anticipating when peak infection rates will occur with Covid-19 and are investing accordingly. But it is difficult to fully access the damage to economy and how long it will take to recover. Just recently, Nomura (international financial services company) put out a report saying that it did not expect the Eurozone GDP to recover to previous levels until 2023. Most investors have not priced in this pace of slow GDP growth in their financial expectations.
Central banks and governments will continue to announce new measures to help support their people and economies. Both governments and central banks tend to release their programs in stages. There is good reason for this incremental policy. First, it appears that they are being proactive and reacting to changing developments. In other words, they want to look like they are constantly doing something. Second, if they announce too much all at once (the “big bazooka” approach), and it does not get the desired effect, they will have wasted their ammunition and will have limited options in the future A “big bazooka” policy is one that is so big that investors will perceive that the problem will surely be overcome.
Timing the announcement of a “big bazooka” policy is tricky and really should be done when the crisis is showing some signs of stability. Mario Dhragi, the past President of the ECB, announced in 2012 that the ECB would do whatever it takes to support the economy. It worked, even though the ECB took limited action. I will bet that if he announced his bazooka policy in 2010, the market would have responded positively, but then faded.
The bottom line is that investors should expect many more policy announcements by central banks and governments that could cause the stock market to move higher in the short-term. As investors judge the efficacy of the policies, the stock market will probably continue to be volatile. In other words, we probably have not seen the end of the stock market having rallies of “8%” and declines of “8%”.
There is still a significant chance that the stock market could re-test its March 23 low sometime over the next few months.
*****
Disclaimer: Comments, charts and opinions offered in this report are produced by www.alphamountain. com and are for information purposes only. They should not be considered as advice to purchase or to sell mentioned securities. Any information offered in this report is believed to be accurate, but is not guaranteed. Brooke Thackray is a Research Analyst with Horizons ETFs Management (Canada) Inc. (“Horizons ETFs”). All of the views expressed herein are the personal views of Brooke Thackray and are not necessarily the views of Horizons ETFs (Canada), although any of the opinions or recommendations found herein may be reflected in positions or transactions in the various client portfolios managed by Horizons ETFs, including the Horizons Seasonal Rotation ETF. Comments, opinions and views expressed are of a general nature and should not be considered as advice to purchase or to sell mentioned securities. Horizons ETFs has a direct interest in the management and performance fees of the Horizons Seasonal Rotation ETF (the “ETF”), and may, at any given time, have a direct or indirect interest in the ETF or its holdings. Commissions, trailing commissions, management fees and expenses all may be associated with an investment in the ETF which is managed by Horizons ETFs Management (Canada) Inc. The ETF is not guaranteed, its values change frequently and past performance may not be repeated. The ETF may have exposure to leveraged investment techniques that magnify gains and losses and which may result in greater volatility in value and could be subject to aggressive investment risk and price volatility risk. Such risks are described in the ETFs prospectus. The prospectus contains important detailed information about the ETF. Please read the prospectus before investing.
While the writer of this newsletter has used his best efforts in preparing this publication, no warranty with respect to the accuracy or completeness is given. The information presented is for educational purposes and is not investment advice. Historical results do not guarantee future results.
Copyright © Horizons ETFs


