
by Craig Basinger, Chris Kerlow, Derek Benedet, Alexander Tjiang, Richardson GMP
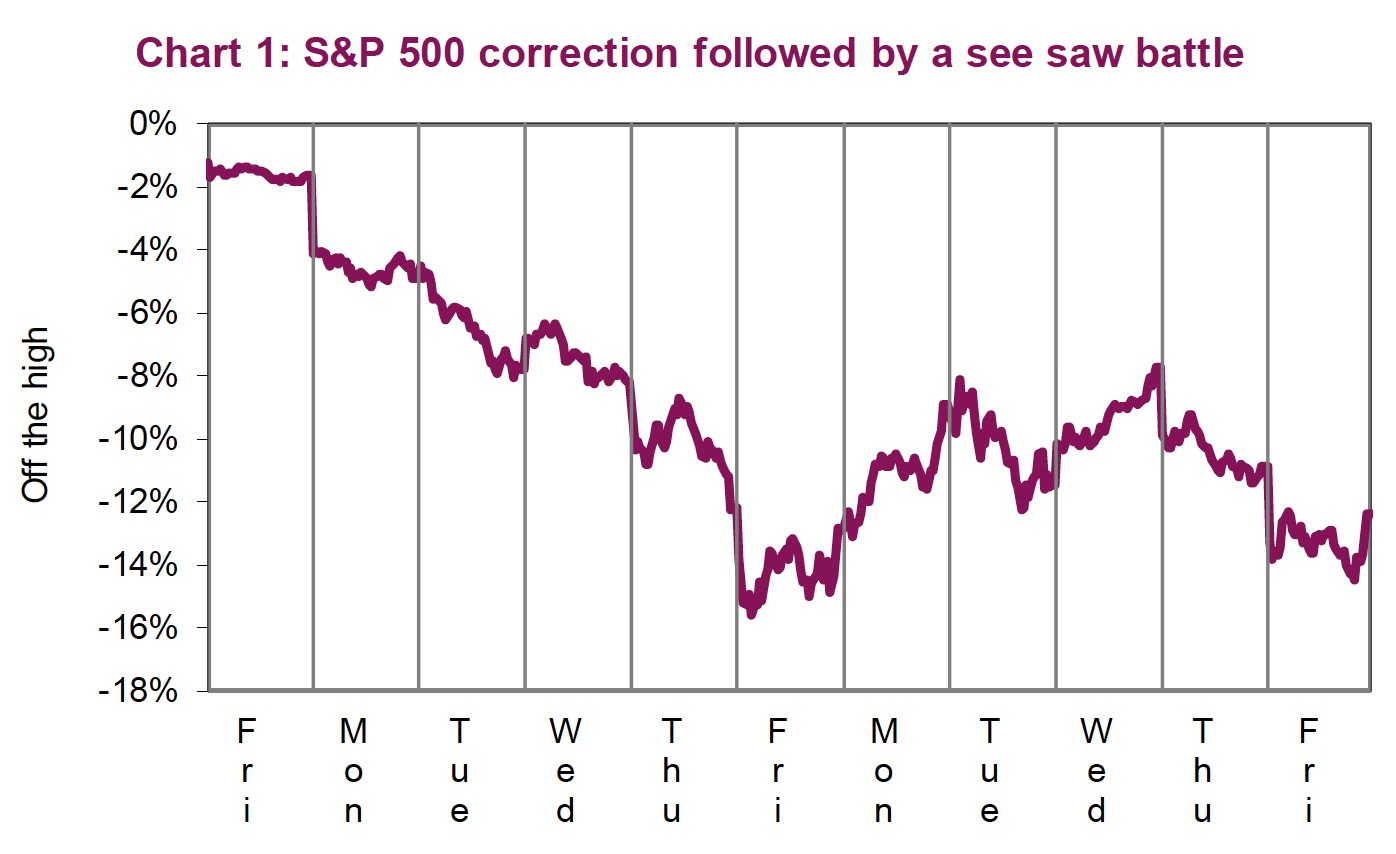
After the fastest correction in the history of the S&P 500 at the end of February, the first week of March was an epic battle between the bulls and the bears. Last week saw the following head-spinning daily closing moves in the S&P 500: +4.6%, -2.8%, +4.2%, -3.4% and -1.7%. A similar pattern was followed by the TSX and many global equity indices. This had the volatility index (VIX) touching 50, a level not seen since the correction in early 2018. North American bond yields tumbled to levels only seen in Europe and Japan.
So, moving forward, who will win this fight between the bull and the bear? Nobody knows, but given the start of an oil war over the weekend, the bears appear to be in the drivers seat. Oil prices have dropped 20% on the breakdown of OPEC+, equity futures are limit down (-5%) and bond yields have collapsed. The 10-year U.S. Treasury touched 32bps and are currently sitting at 46bps. In fact, the bears certainly have lots of fodder including oil, the coronavirus situation, which surpassed 100K global cases, stoking widespread fears and changing behaviours. Everyone is now talking about it and media content is being created at a feverish pace to meet the demand for information. On the side of the bulls, there is a very oversold equity market and over-bought bond market. Valuations have become more appealing and correction exhaustion indicators are increasing.
Will the coronavirus get worse? Likely yes (See ‘Virus update’ below). But don’t underestimate the market’s ability to become desensitized to events, even as bad as this one could be. Market sentiment can change without notice, often without rhyme or reason. Assets may be oversold and extended with emotions running high. But first, oil.
 Well, at a time the world is wresting with a pandemic (not labeled as such yet, but likely will be), Russia has decided to upset the OPEC+ ‘working group’. It played out like this, on Friday at the OPEC+ meeting Russia balked at going along with an additional 1.5 million barrels a day (mbd) production cut designed to reduce global supply due to falling demand. The coronavirus spread and resulting drop in economic activity has reduced oil demand globally. Russia wants the pain from falling prices to be shared, namely with American shale producers. So they said ‘no’ (or ‘net’) to production cuts. In response the Saudis pivoted, by announcing over the weekend they would increase production by up to 2mpb, effectively flooding the oil market with more product while demand is going in the other direction.
 ``
``
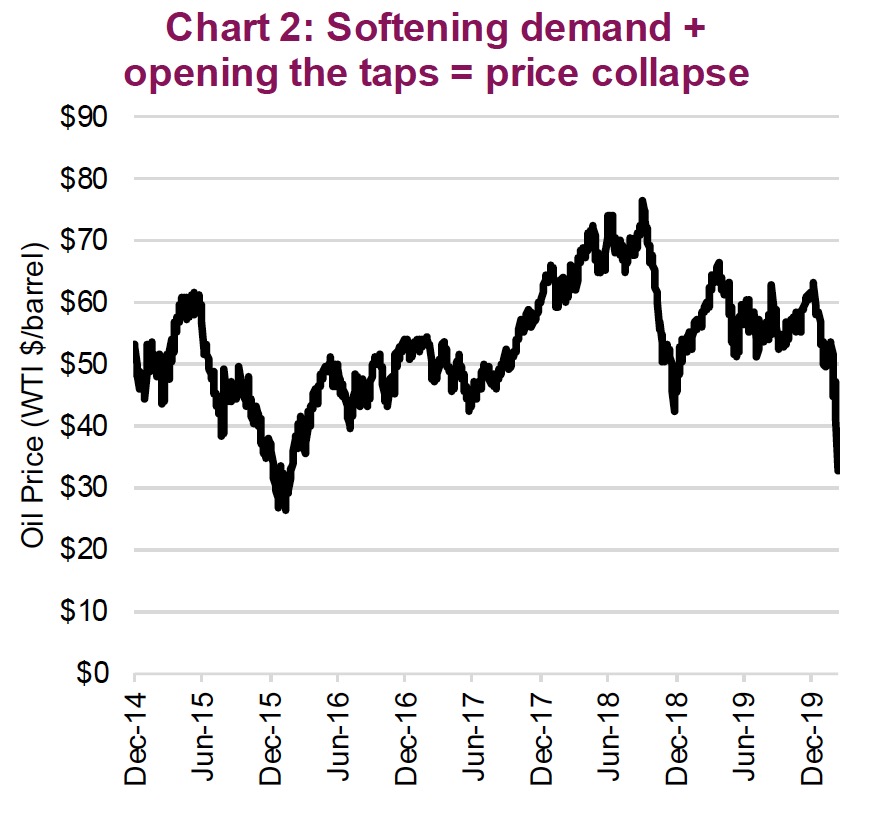
Oil prices dropped $10 on Friday during the OPEC meeting as news started to leak out and following Saudi Arabia’s announcement over the weekend, crude is off another 23% Monday morning to $32/b (chart 2). This drop is going to land squarely on oil producers, including the intended target of U.S. shale. It will also weigh on countries reliant on oil revenue, including Russia and Saudi Arabia that require $50 and $80 oil prices to balance their budgets. This may limit how long these countries are willing keeps the taps open at such levels but that is likely to be a minor consolation in the coming months.
One silver lining, a $20 drop in oil prices is the equivalent of $680 billion dollars of global savings on an annualized basis from cheaper prices.
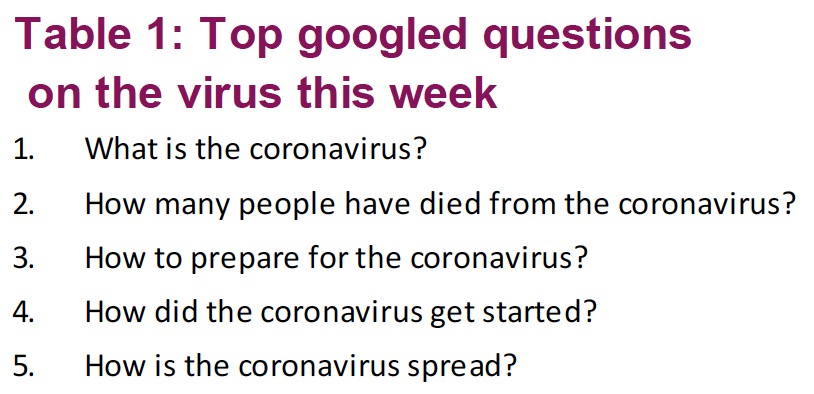
The wall of worry continued to mount last week as media coverage of the coronavirus known as COVID-19 spread faster than the virus itself. Analyzing the twitter-verse, Goldman Sachs research noted that negative sentiment on the economy and virus mentions increased by around five-fold last week. Notably, the top questions about the virus on Google were high level (Table 1). We believe last week was the first real indication of widespread fear, which could potentially be near its peak level. Hysteria was glaringly obvious in equity markets as the battle between the proverbial bear and bull swung wildly in either direction.

The panic gripping society has at least two positive effects: First, when most people are already concerned, it makes it statistically challenging for that number to continue to grow as quickly as it appeared last week. Second, the fear drives that large population of nervous citizens to take preventative measures to contain the virus. And helps drive government actions such as Italy’s quarantine lockdown of Lombardy (plus other regions).
Sanitization and the reduced congregation of people appear to be effective methods in reducing the spread of virus. This is proving to be true in mainland China, the outbreak’s epicentre, and where the most obvious measures of prevention are being taken. Active cases in China have been falling since mid-February and continue to do so. This had contributed to a decline in global active cases, more than offsetting the rise in cases outside China, that is until the last few days (Chart 3).
The number of serious or critical cases are also falling as the virus seems to have mutated into a less fatal form. Researchers at Peking University in Shanghai have revealed there are now two strands designated L and S. L, the more aggressive strand, has become less prevalent since January. This appears to make sense: if a sickness causes you to be bedridden, it is likely to be more difficult to spread than one where you co-mingle in society. This should contribute to a lower death rate as time goes on. Many, including the World Health Organization cite the death rate at 3.4% (confirmed deaths / confirmed cases). The flaw is that the data doesn’t account for everyone that has been infected and never tested.
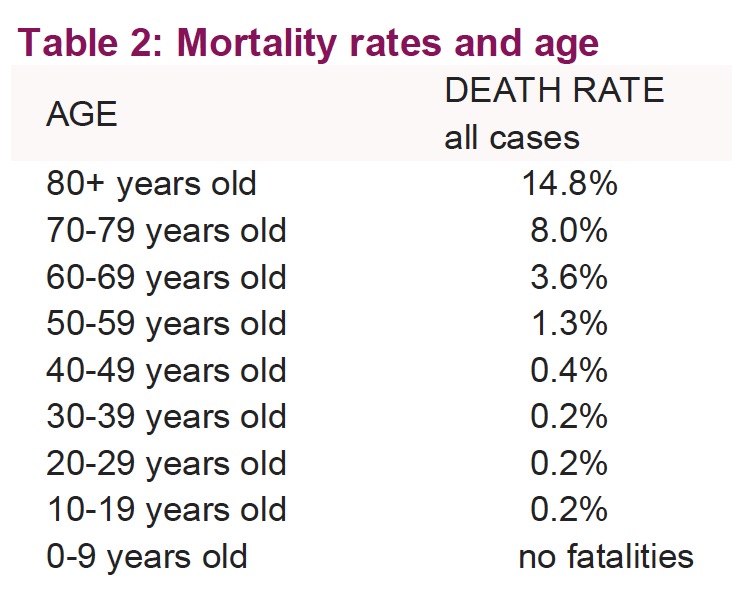
U.S. Vice President Mike Pence, who is heading their prevention efforts, asked last week for one-million people to be tested, but health officials are saying that number will be far lower as supplies are not available. Also, death rates are skewed by demographics; it is much more fatal for the older population than the younger population (Table 2). If you’re a healthy individual under the age of 50, your chances of dying from the coronavirus are extremely low based on current data. Likely a more indicative depiction of the virus is found looking at the 705 people infected on the Diamond Princess cruise liner. So far, only seven have died (less than 1%), of which all were over the age of 70, had exposure to concentrated viral loads and some had experienced delayed treatment along with a much longer cruise than planned.
Although fear will remain elevated and the media will feed our confirmation bias, inundating us with the information we are seeking via Google and Twitter, this tends to paint a more dire picture than reality. Active cases continue to be the one to watch, which are rising but so are the number recovered. At some point the market may simply become less sensitive to this outbreak. The key fundamental question is whether the spread of the virus is brief or prolonged, as each situation will produce very different economic impacts. And of course how much is already being priced in. The surprise 50-basis-point cut last week by the U.S. Federal Reserve (Fed) will likely do nothing in the near-term to ease the damage of the virus but helps partially offset areas of market stress. This week will likely see more monetary and potentially fiscal support announcements.

Value or opportunistic investors are starting to do some buying and that’s likely contributing to the see-saw battle we’ve been experiencing of late. Interestingly, there’s been net buying of Canadian equity ETFs over the past week to the tune of $588 million. On the U.S. side, net buying has totalled around $1.6 billion, which is encouraging but pales in comparison to the $10 billion of net bond purchases. It will be interesting to see how that resolve is tested this coming week.
With a big market drop followed by a week of big ups and downs, the jury is out on who will win this battle – the bulls or the bears. A few of our Market Cycle indicators have slipped from bullish to bearish, which we expected and will continue to see in the coming weeks as the fallout seeps into the data. Still, 19 bullish indicators seem fairly supportive. In addition, a number of correction indicators are showing potential capitulation levels. However, a few are not. Ultimately then, signals are currently mixed.
Notably, with the VIX index breaching 50 Monday morning, this has been at or near capitulation in pretty much every big market decline over the past decade (Chart 4). While this is encouraging, we should note the VIX almost reached 90 during the financial crisis. So, if you believe the current situation is not a repeat of the financial crisis, then it appears to be an opportunity.
Somewhat less encouraging, other capitulation indicators are not flashing buy. Amazingly, the survey of individual investors who are bullish increased last week from 30% to 39% while the bears remained steady at just under 40%. As a contrarian indicator, we would prefer to see more bearish investors than bullish.
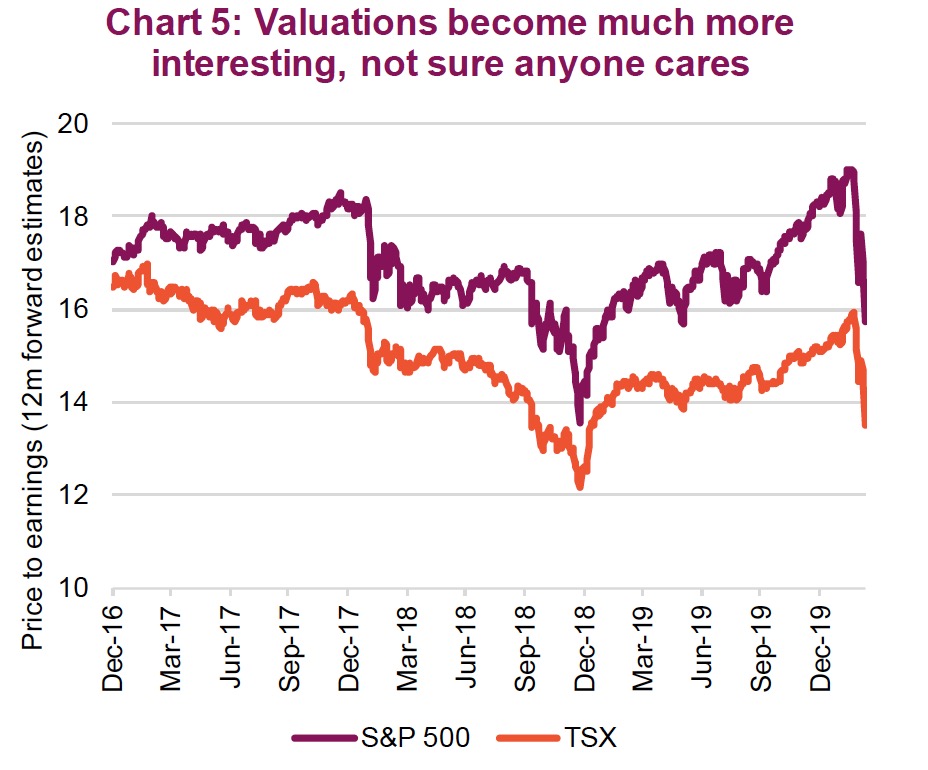
Valuations have come down and there are pockets that are showing deep value. The S&P 500 is now 15.9x forward earnings (Monday morning), down from over 19x a few weeks back. The TSX is now 13.6x, down from over 16x. This is certainly starting to look more interesting. (chart 5)
Portfolio implications
We have done some minor buying during this sell-off, mainly in Canada and the U.S. While we do not know if the bottom is in, or how the virus situation will play out, we do believe we may be near peak hysteria. The launch of an oil war certainly throws more uncertainty into the mix. So, our current playback is to do some buying now and some later if we get another leg down, assuming market cycle indicators continue to hold. Having cash on hand proves very useful.