


by Bryce Coward, CFA, Knowledge Leaders Capital
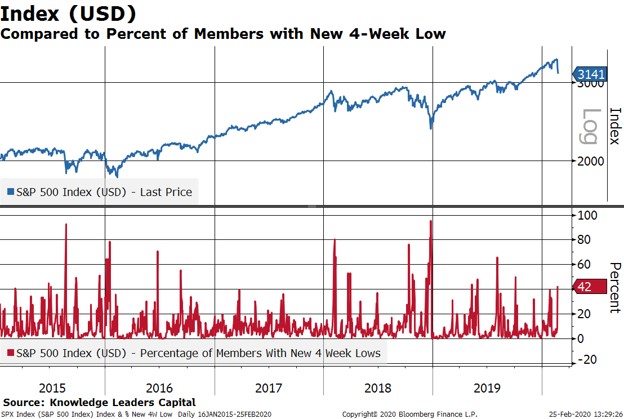
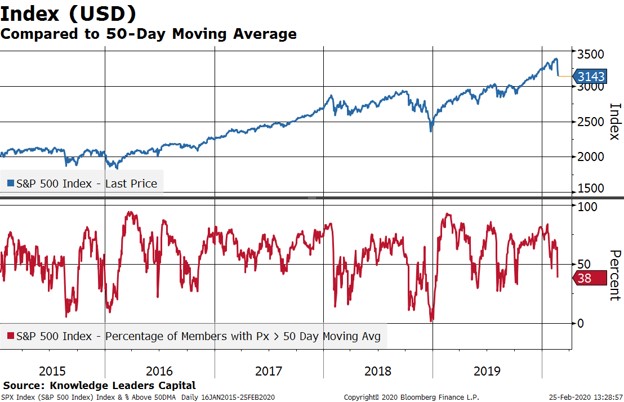
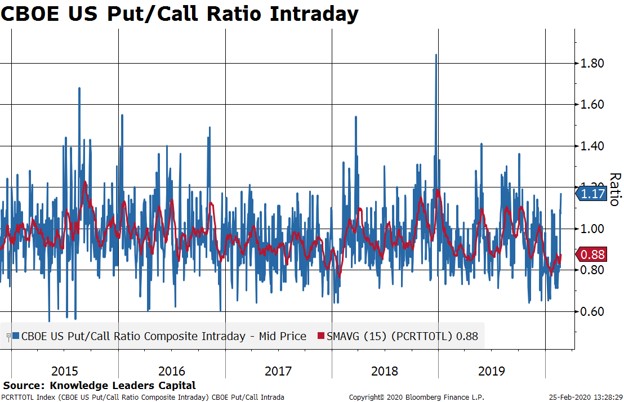
Watching while the largest equity market in the world falls by a whopping 8% in four trading days brings us back to the 2008-2009 meltdown period of the financial crisis. Normally an 8% drop in such a short time frame would present an interesting intermediate-term buying or rebalancing opportunity outside of a recessionary environment. Normally, fear gauges in the market would be flashing red as weak hands simultaneously hit the panic button and sell anything with a price. And yet, even in the face of such a dramatic drawdown event, statistical measures of fear are far from where we typically find them at actionable market lows. That is, despite the price action that certainly looks and feels panicky, we may have yet more to go on the downside before the “chuck it” mentality really takes hold. In each of the charts below take note of the extremes reached at the “good lows” of late 2015, early 2016, early 2018 and late 2018.
New Lows
At all the good market lows over the previous 5 years, the percent of stocks at new 4-week lows reached the 80% range. This new lows indicator jumps when selling breadth among individual stocks hits extremes (i.e. when nearly all stocks experience significant selling pressure). At just 42%, we need to see more intermediate-term new lows to suggest a selling climax has occurred.
Percent of Stocks Below their 50-Day Average
Similarly, the percent of stocks trading above their own 50-day moving average is still in middling territory despite the steep price action. At all the good lows seen over the last 5 years, the percent of stocks trading above their own 50-day moving average got down to the single digits.
TRIN
The TRIN index is a measure of volume flowing into advancing vs declining stocks. Specifically, it’s calculated by dividing the advance/decline ratio by the advance/decline volume ratio. High readings are associated with selloffs and low readings with buying pressure. Currently, the TRIN is nowhere near the levels we saw at each of the important market lows of the last few years.

Option Sentiment
The options market is a good place to look to uncover sentiment extremes because options enable one to easily express a view with levered exposure. What we normally see at stock market lows is the speculative options community betting on yet more downside to equities by buying many more put options than call options. For example, back in December of 2018, the put/call ratio got all the way up to 1.8, meaning that 1.8 puts were purchased for each call. Even in less extreme selloffs, the put/call ratio consistently gets to the 1.5 range. Even with today’s 3% selloff and yesterday’s 4% plunge, the put/call ratio only got to 1.17. This suggests we have plenty left to go to get to a sentiment extreme in options.
Copyright © Knowledge Leaders Capital