by Craig Basinger, Chris Kerlow, Derek Benedet, Alexander Tjiang, Richardson GMP
Summary
I. Market recap – Good start despite lots of bad news
II. Market cycle
• Coronavirus
• Market cycle – Old and a bit less healthy
III. Credit – Not a great risk/reward trade-off at the moment
IV. Portfolio positioning
I. Market recap – Good start, bad finish
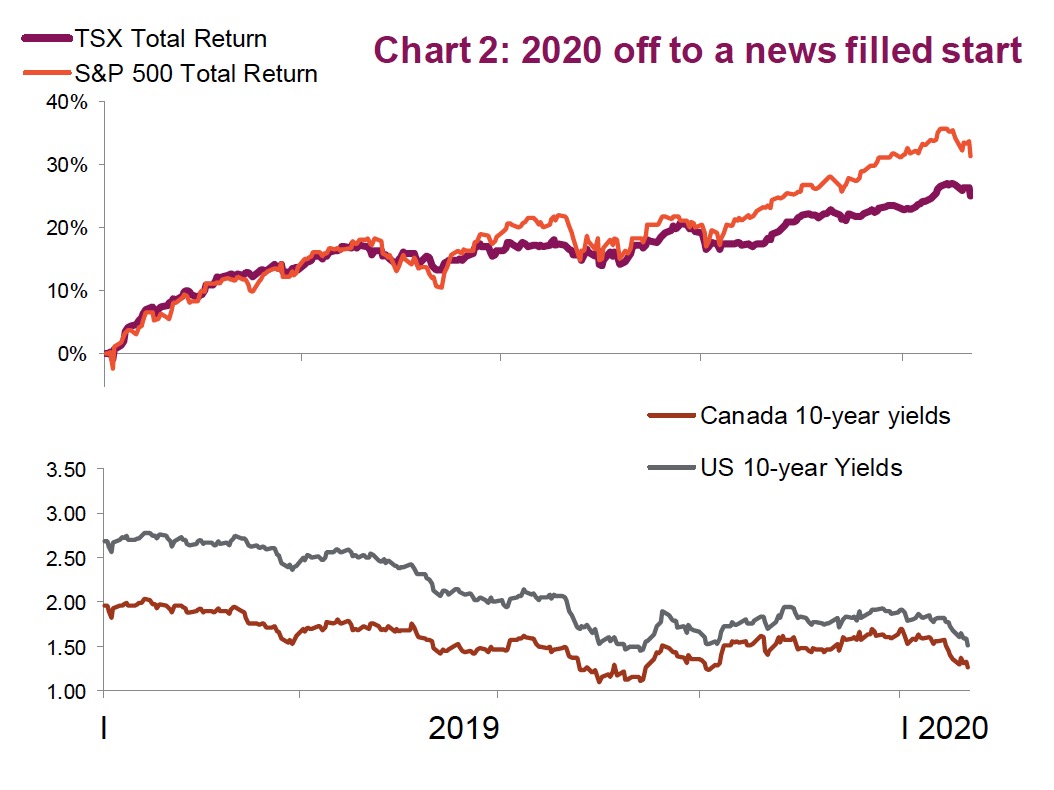
Heading into the New Year, markets appeared vulnerable to a correction given elevated valuations, strong momentum and frothy sentiment. January started as December finished: with markets continuing to make new highs. There is always a temptation in our industry to find a fundamental rationale for everything that happens. We had the signing of the U.S./China Phase One trade deal, signing of USCMA and some improvement in economic data. The lone blip was the brief escalation in geopolitical risks with the tit-for-tat confrontation between the U.S. and Iran; but this was largely ignored by markets, which showed a surprising sense of resiliency. Embracing good news, while generally ignoring bad news, can only last so long before a reversion.
Then a sudden burst of market-moving events happened – the emergence of the coronavirus – producing the first stumble of the year and with it a surge of fear and some hysteria. Following the impressive start, markets are essentially where they started. One critical question remains: is this the start of something more ominous, or just another blip in this 11-year-old bull market?
One month into the new year, and we are still waiting for the expected resurgence of global growth, but muddying the situation is the still yet unknown economic ramifications of China essentially shutting down to combat the virus’ spread. Markets fear what they cannot see and measure – especially, it seems, when the culprit is microscopic. The unknown is constant in investing, but the degree of uncertainty has risen and with it so has volatility.
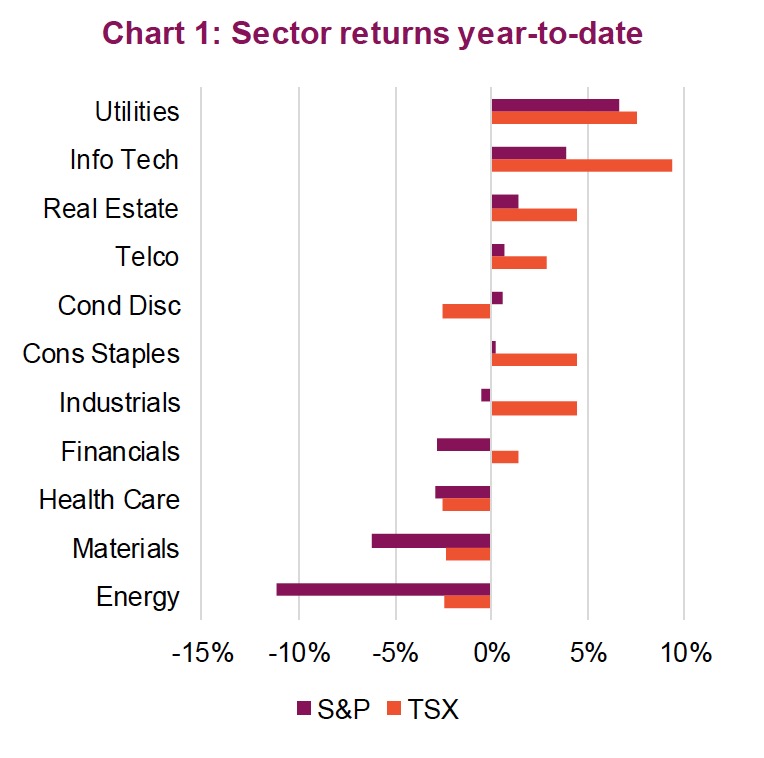 From a factor perspective we’re seeing a rare contrast. Momentum is having a strong run, but there has also been relative outperformance across high-quality stocks, as well as defensives. Utilities (+6.6 lifted by falling yields) and Technology (+3.0 lifted by good earnings results) are typically at the opposite end of the spectrum; however, so far this year they are the two top-performing sectors – a rare occurrence.
New highs were the dominant trend for most of the month. The recent sell off has left the S&P 500 in negative territory – it fell 0.2%, while Canada’s S&P TSX Composite, which rose 1.5%, was one of the few indexes to remain in positive territory. European shares tumbled amid renewed concerns about global growth – the Euro STOXX 50 index dropped 2.8% in January.
The whipsaw was most evident in the commodity markets, particularly oil. Supply disruptions along with tensions in the Middle East caused oil prices to reach their highest level in nine months in early January. However, this was soon overtaken by demand concerns, which led to a subsequent 22% decline. Commodities in general have had a tough month: the Bloomberg Commodity Index fell 7.3% in January, it’s worst month since July 2015. In contrast, gold and other precious metals had a strong month, rising 4.4%.
In a strange premonition of the recent risk-off events, bond yields have been falling since the start of the year. Yields are nearly back down to their August lows with Canadian 10-year yields falling 43 basis points (bps) to 1.27% and U.S. yields falling 38 bps to 1.53%. The yield curve is also once again inverted. Policy makers have held rates steady but remain accommodative with a dovish tilt, which has proven to be a backbone of support for equities.
We expect stocks to be much more volatile and continue to be at risk to corrective forces so long as fears of global economic disruptions remain. China will have to deal with a significant economic loss and, unfortunately, this limits the immediate economic benefit of the trade resolution. What markets may not be fully discounting is the chance that any near-term disturbance will be made up for with a subsequent rebound in pent-up demand. Economic fundaments have been good – we saw better-than-expected Q4 GDP in the U.S. and jobs numbers remain strong. The U.S. consumer remains key. So far, the coronavirus remains primarily an acute and local market event, but the situation is still fluid and there remains risk of further contagion. Meanwhile, investors are using it as an excuse to sell.
II. Market cycle
Markets, including bond, equity and commodities, can be very fickle. Sometimes there is bad news and the market just shrugs it off. But there are times when bad news has a much more dramatic impact. The differentiating factor is often the confidence of the market, i.e., how resilient it is. It would be fair to say that at the beginning of January, the market was very confident, so much so that the rising geopolitical tension between the U.S. and Iran was almost a non-event from the market’s perspective. We are not downplaying the longer-term implications of rising tensions between these two powers, but the market absorbed the news quickly and resumed its upward trend. At the moment, with the rising news of the coronavirus in the final weeks of January, that confidence appears to have been sapped.
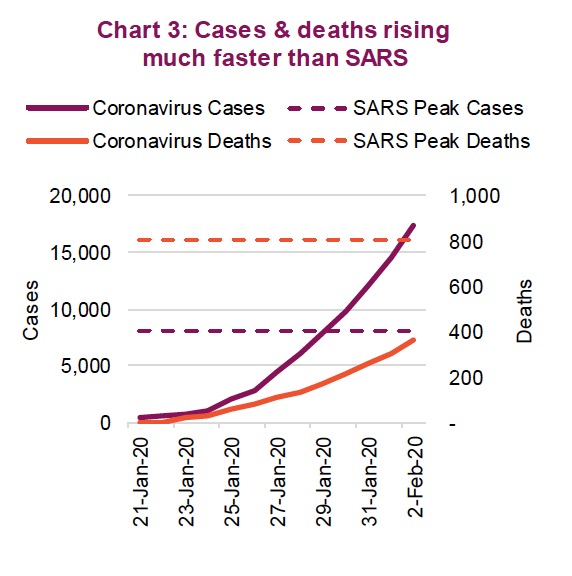 As of February 3, there are a little over 350 deaths and 17,000 individuals infected by this virus. The first death has now occurred outside China – an individual in the Philippines who was a resident of Wuhan. The uncertainty remains very high as to the degree this pandemic will spread and how long it will take to become contained. If you rely on SARS as a roadmap, the market reaction peaked alongside new cases. Clearly, these cases are still rising quickly and have already surpassed the global SARS tally of a little over 8,000. However, comparing the absolute numbers may be misleading as society has become more efficient in diagnosing disease and the SARS outbreak was masked in more unknowns. (Chart 3)
Still, with cases rising, so too are the risks. The next shoe to drop that could weigh on markets would be a second epicenter of human-to-human transmissions. While it may change, the death rate in those affected remains materially lower than SARS (10-15% versus 2-3%). But it’s possible these numbers will likely rise given the data is still early.
We continue to believe that attempting to draw comparisons with SARS or the market impact of other health issues is likely more misleading than insightful – a case of apples and oranges! SARS hit when markets were near the tail end of a 2+ year bear market, with the S&P 500 already down 23% in 2002. In contrast, the S&P rose 29% in 2019. Plus, the sample size of one doesn’t instil confidence when it comes to making any comparisons. We do know, however, that regardless of the source of the issue, markets hate uncertainty, and this skittishness has dramatically elevated.
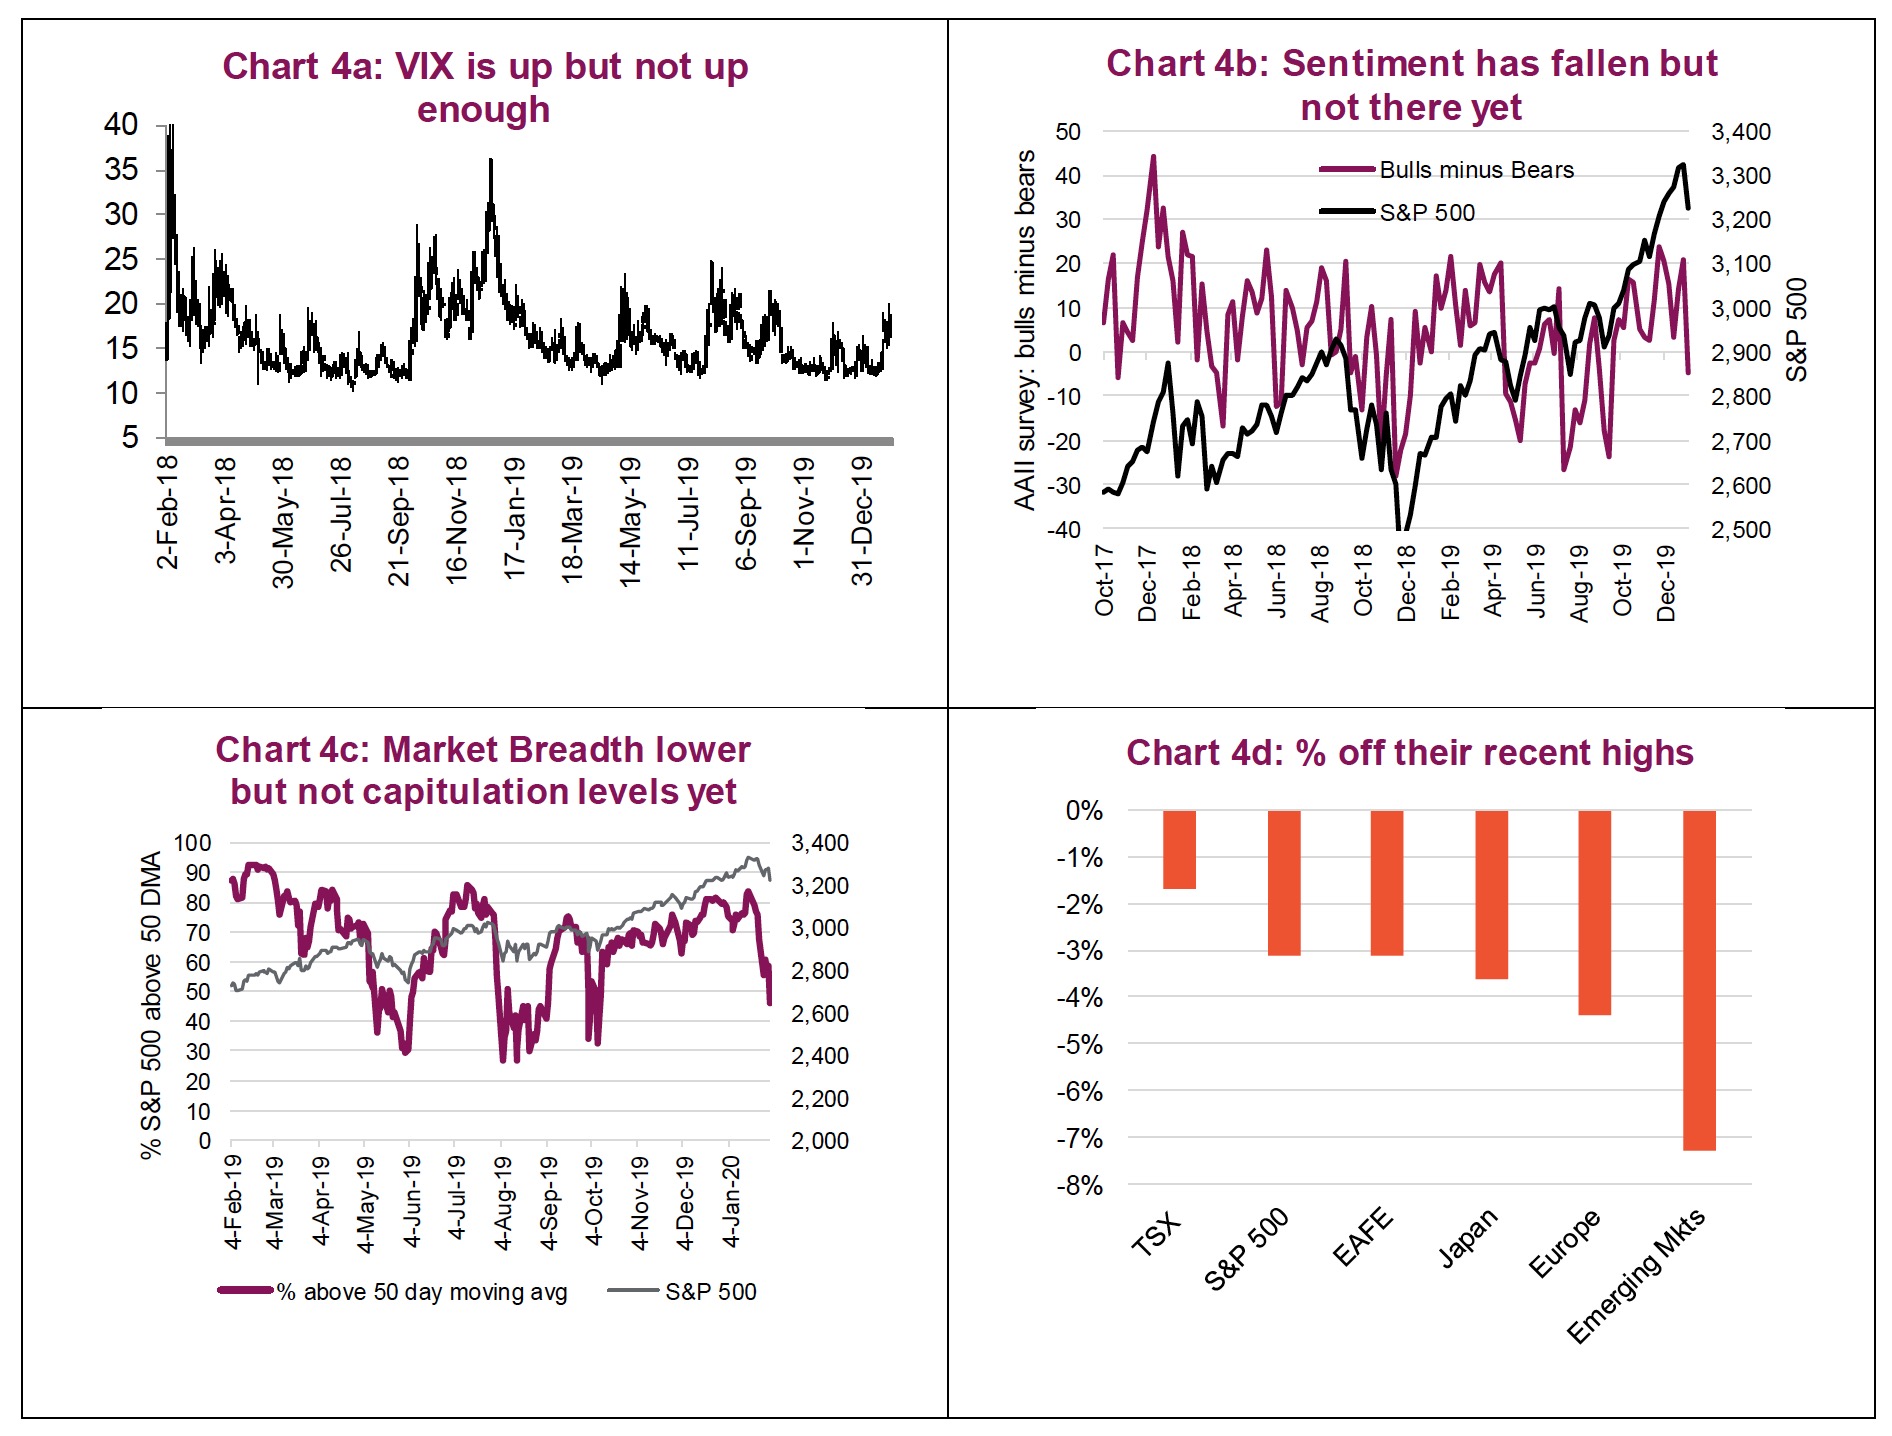
The next few weeks will likely be very volatile. At this point we have not witnessed enough of a pullback to get us too excited about a potential opportunity. In Charts 4A-D we have updated a few of our market correction watch indicators that can be reliable in finding capitulation points for the market in general. To date, none are there yet. The VIX is up but remains below 20. Investor sentiment, a survey released on Thursday, took a hit but has not reached capitulation levels. Interestingly, ETF flows in equities globally were still positive last week. Market breadth has dropped but corrections often see this down to 25-30%. And of course, then there is the amount of drop in the indices. TSX is doing well, thanks to gold. Emerging markets, not surprisingly, are being hit the hardest.
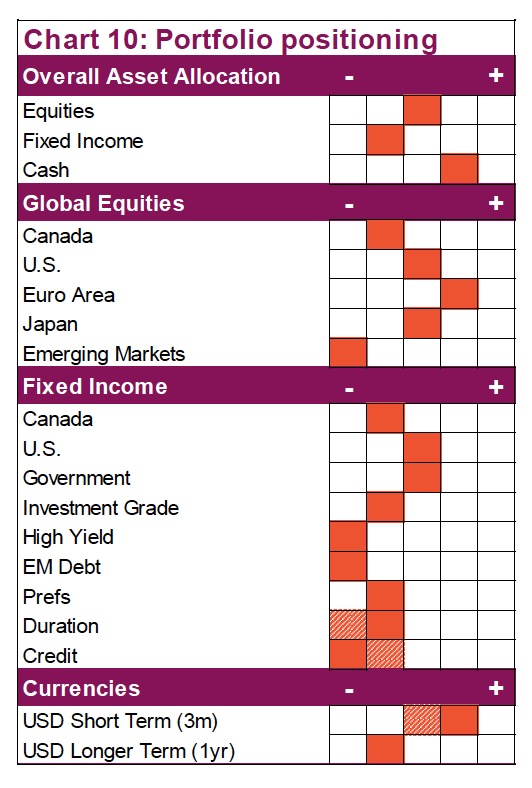
Portfolio action – Not much at this time. If you were looking for a buying opportunity there is a good chance this may be forming. The next few weeks will be key – among the developments to watch for are any new documented cases as a potential signal. Notably, markets that are off 2-4% won’t prompt us to deploy our overweight cash position. And we continue to be happy with our ‘no EM’ stance.
Market Cycle – Old and a bit less healthy
 Historically, these recent health outbreaks have not had a material impact on the global economy. The region where the outbreak first occurred is hard hit, but so far this hasn’t escalated to the global economy. SARS was estimated as having a 0.1-0.2% impact on global GDP (remember, this comparison is risky). Ebola was similar in having a minimal impact on global GDP. Nonetheless, during a time when investors are increasingly concerned about slowing global growth, this isn’t good economic timing (not that there is ever a good time for something like this). Add to this the fact that Q1 is typically a soft quarter, plus the return of an inverted yield curve, it is a safe bet you will see recession talk become more prevalent in the coming months.
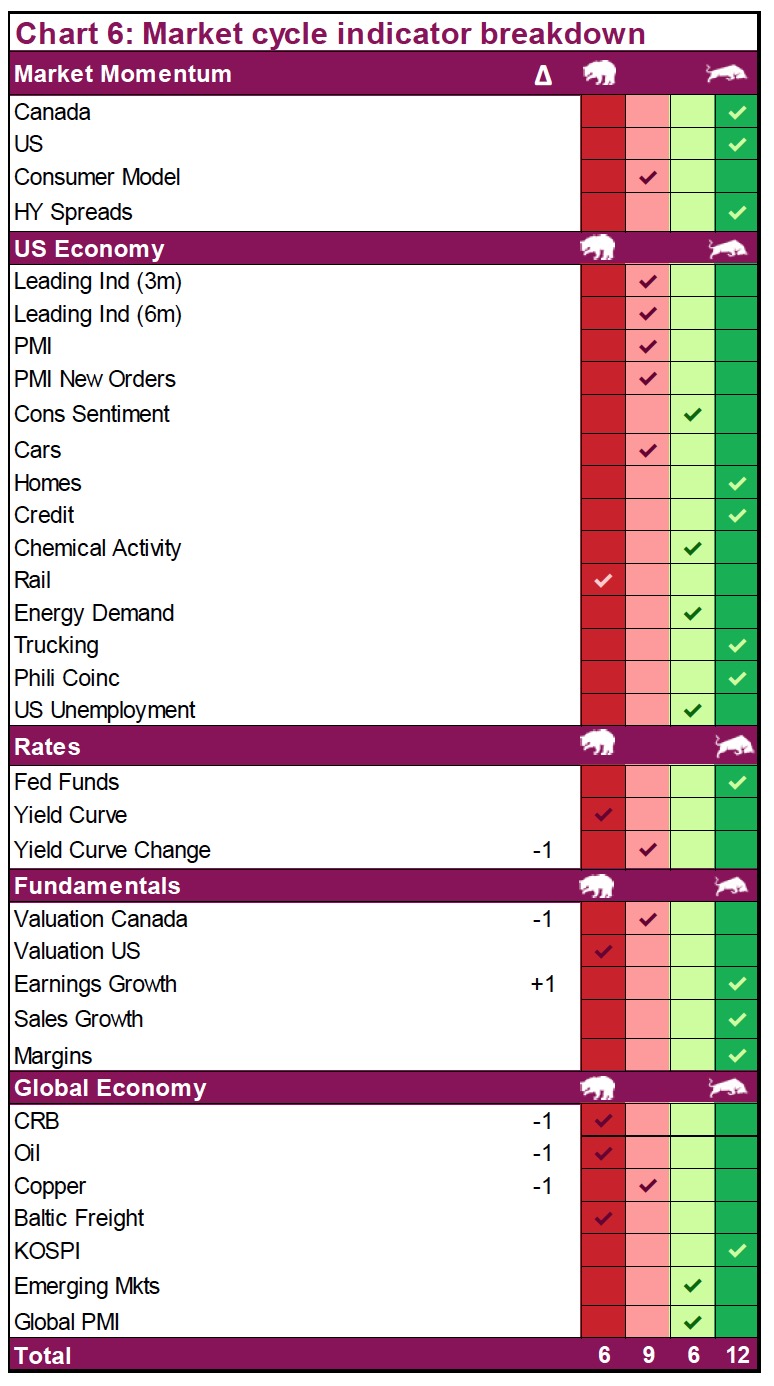
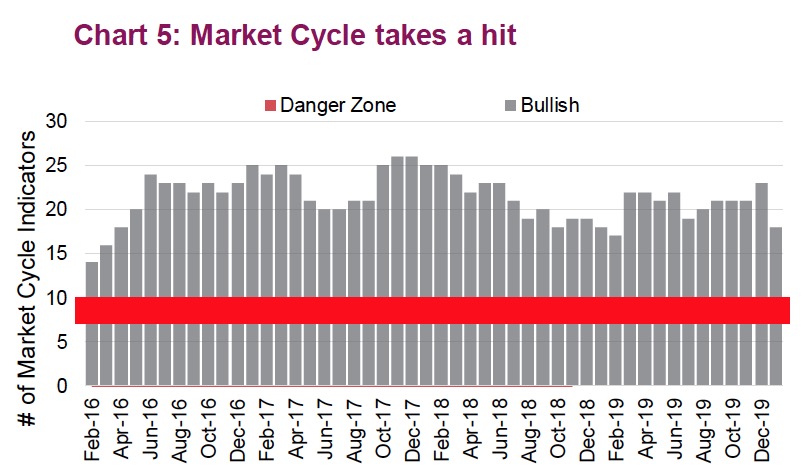
This uncertainty, plus soft data, plus yield curve inversion has translated into our Market Cycle indicators dropping. From the end of December we have seen the number of positive indicators drop from 22 to 18 (Chart 5). They are still well above the danger zone, but the drop is rather sudden, so lets dig into the data.
The good news first: U.S. economic data improved during the month. While there wasn’t a change in the number of bullish signals, there are now fewer strongly bearish ones (only rail volumes) and the number of strongly bullish signals rose.
Rates were a negative contributor. The yield curve remained bearish as we use a higher threshold than simply an inverted curve. For this to be bullish it needs some steepness in the yield curve. The yield curve change did drop into the bearish camp as the curve flattened and then inverted with the 10-year yield falling. Fundamentals were a wash.
The big soft spot, not surprisingly, was global economic indicators. A number of these are commodity sensitive and commodities have been falling fast. The others are holding in, but could flip should we see more weakness in emerging market equity prices.
Portfolio action – Indicators certainly took a hit over the past month, mainly driven by the uncertainty of the impact of the coronavirus. This could continue to impact some of the softer or survey indicators in the market cycle framework. The big question is to what degree this bleeds into the harder data points.
At this point there is no need for any action from our asset allocation view.
III. Credit – Not a great risk/reward trade-off at the moment
In a world starved of yield and with corporate debt financings showing little-to-no signs of slowing, we think it prudent to take a step back and reflect on the changing dynamics we’ve observed in the bond market over the past few years. Leveraged loans, for example, are in our view beginning to exhibit discomforting structural signs of weakness. Though one may be tempted to use the perils of the 2008 credit crunch as a historical benchmark, we’ve identified key changes that are unique to today’s environment. Though history never repeats itself, it does indeed tend to rhyme.
As we’ve highlighted extensively in our past research pieces, speculative-grade corporate debt issuances are on the rise. Expectations of further growth are currently muted; however, there is no shortage of demand for high-yielding debt instruments and funds. One driving force that has allowed companies to continue issuing riskier debt is the robust demand from collateralized loan obligation (CLO) originators, exhibiting a willingness to purchase riskier issuances. CLOs are the biggest buyers of loans and have similar characteristics to mortgage backed securities (MBS), which were at the heart of the global financial crisis in 2008. Institutional and high net worth investors are highly bullish towards the asset class and have been piling money into the space in recent years. Most of these securities can offer high-single-digit to low-double-digit net returns, and so it doesn’t require great judgement to discern why investors would be so willing to invest.
As a refresher, CLOs are a pool of loans structured as a single security. These securities are often comprised of corporate loans with lower-than-average credit ratings or private debt created by private equity firms from leveraged-buyouts. The structure of these securities provides buyers with diverse exposure to multiple loans of varying credit characteristics, often at higher-than-average interest rates. However, it should be noted that the companies that often comprise these portfolios tend to sit low on the rating spectrum. Based on the high level of risk, this debt bears higher interest rates. In general, companies forced to borrow at higher yields generally have a higher risk of default. As you can imagine, problems with CLOs tend to arise when an abnormally high number of loans default at the same time.
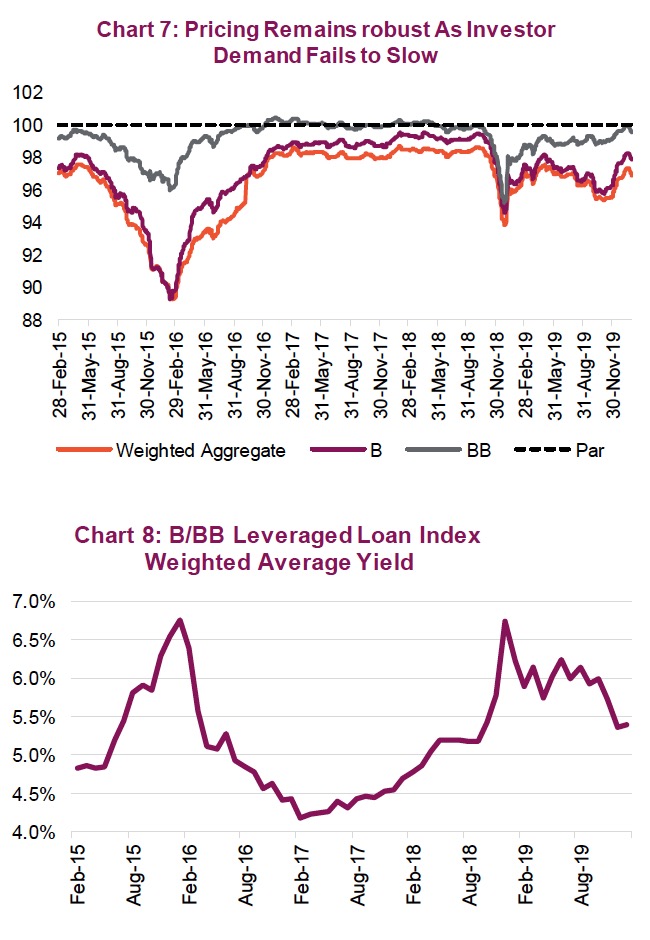 This risk is being exacerbated by re-ratings on covenant-lite corporate loans (Chart 7). These loans are starting to trade higher, back up to par after a sell off in Q4 2018. These types of loans often trade lower much quicker because recovery covenants tend to be absent in the issue. It is in the bondholder’s favour to have such covenants built into a bond, because when times get tough, they tend to act as a reason to negotiate. In the absence of protective covenants, borrowers will likely give up quicker if operations flutter. Consequently, a mild recession, tepid earnings, or a slowdown in business activity could intensify the pace of bankruptcies.
Another sign that the space is getting expensive has been the acceleration of “repricing” transactions in the past two years. Such a transaction occurs when private equity firms refinance their debt, leaving the current loan in place and simply earning the spread between the original loan and new financing rate, which is lower than before. With many loans now trading over par, as a function of yields falling (Chart 8), it would not be surprising to see that trend continue to accelerate into 2020. Even iHeartMedia, which exited bankruptcy less than a year ago, was able to execute a repricing transaction last week. Effectively, repricing lowers the return expectations of buyers, which could deter future capital from supporting the space.
Goings on within the loan market tend to be a leading indicator of draw downs in the credit market and, subsequently, equity markets (Chart 9). Today, banks, regulators, and market participants are growing increasingly worried. However, stubborn investor demand has only seen yields pushed lower rather than higher despite deteriorating quality.
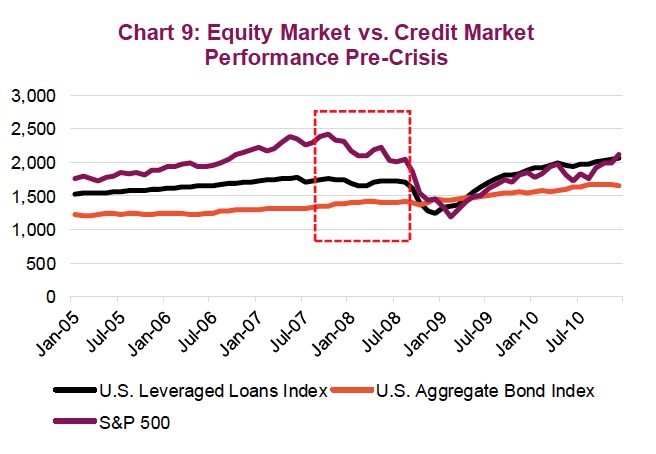 Credit markets are cyclical in nature; when times are good, lenders tend to ease standards. However, lending practices will continue to deteriorate only until losses cause lenders to pull back. We continue to emphasize the importance of cash flow and the distinction between a company’s reported earnings and its true underlying economics. Years of monetary easing and cheap credit have tilted the risk/reward paradigm in favour of balance sheet expansion. Thus, issuing more debt at more favourable rates becomes a less burdensome activity.
With this in mid, we are keeping a close eye on this segment of the market as an early warning sign of weakness in the broader economy. We have reduced credit exposure in our asset allocation models as we do not believe we are being adequately rewarded for incurring such credit risk.
IV. Portfolio Positioning
The only material change to our asset allocation recommendations in January was a shift on the bond and currency side. Around mid month, we decided to further reduce our credit exposure given spreads had fallen back down to cycle lows. In our opinion, investors were not being adaquately rewarded for taking on credit risk. Within the change we also reduced Canadian short-term bond exposure and used the combined proceeds to add a U.S. TIPs position. This reduced credit, increased duration and inreased U.S. dollar exposure.
This is more of a short-term trade given our view that inflation expectations, credit spreads and the strong Canadian dollar at the end of 2019 created this opportunity.
Outside of this, we await to see if markets fall further and this would likely be the buying opportunity we highlighted in our outlook report. Of course, we would need the market cycle indicators to remain reasonably healthy. Time will tell.
Charts are sourced to Bloomberg L.P. & Richardson GMP unless otherwise noted
Source: All charts are sourced to Bloomberg L.P. and Richardson GMP unless otherwise stated.
The opinions expressed in this report are the opinions of the author and readers should not assume they reflect the opinions or recommendations of Richardson GMP Limited or its affiliates. Assumptions, opinions and estimates constitute the author's judgment as of the date of this material and are subject to change without notice. We do not warrant the completeness or accuracy of this material, and it should not be relied upon as such. Before acting on any recommendation, you should consider whether it is suitable for your particular circumstances and, if necessary, seek professional advice. Past performance is not indicative of future results. The comments contained herein are general in nature and are not intended to be, nor should be construed to be, legal or tax advice to any particular individual. Accordingly, individuals should consult their own legal or tax advisors for advice with respect to the tax consequences to them, having regard to their own particular circumstances. Insurance services are offered through Richardson GMP Insurance Services Limited in BC, AB, SK, MB, NWT, ON, QC, NB, NS, NL and PEI. Additional administrative support and policy management are provided by PPI Partners. Insurance products are not covered by the Canadian Investor Protection Fund.
Richardson GMP Limited, Member Canadian Investor Protection Fund. Richardson and GMP are registered trademarks of their respective owners used under license by Richardson GMP Limited.
Richardson GMP © Copyright February 3, 2020. All rights reserved.


