


by Hubert Marleau, Palos Management
The Federal Reserve left its benchmark interest rate unchanged on Wednesday. All ten members of the rate setting committee unanimously agreed. The Fed reaffirmed its no-move stance for the immediate future, repeating nearly verbatim the policy outlook in December. Yet, the Fed officials signaled that there is a greater risk of surprises that could force them to lower rates than raise them.
Also, the Fed made two technical adjustments that essentially amount to housekeeping moves. It raised interest rate paid on deposits (IOER) made by banks which are excess reserves by 5 bps to 1.6% in an effort to keep the effective federal funds rate within the 1.50% to 1.75% range and committed to supporting the repo market through April.
The big message was the concern that inflation could drift even lower if the Fed officials cannot credibly meet its 2.0% inflation target. On Friday, the Bureau of Economic Analysis reported that the core PCE deflator was up 1.6% from a year ago while Bureau of Labor Statistics showed that employment costs increased 2.7% for the comparable period. If one were to factor in 1.0% for productivity, labour input cost was only up 1.7%.
That’s too low for the Fed to accept. The market reads that the Fed objective is not about having a policy that supports inflation neared 2.0% but one that will bring it to 2.0%. The spread of globalization, the advancements in technology plus the slowing and aging demographics are structurally deep and so secularly strong that they work against the efforts of the Fed to rekindle inflation.
Moody’s inflation probit model which does a decent job of determining the inflation odds is giving only an 18% chance that the core PCE deflator will reach 2.0% and zero chance that it will hit 2.25% in the next year.
In my judgement, it were not for the Fed’s past and current monetary posture to push the economy forward, inflation rates would be a lot lower than they are now. Consequently, investors can continue to expect an abundance of liquidity (QE) and low cost of money (Federal Funds Rate) and cheap capital (Ten-Year Bond Yield).
This impacts growth. For as long as the aforementioned conditions remain in place, the odds are pretty good that the economy will keep on increasing near its growth potential of 2.0% per year. The U.S. Gross Domestic Product grew at a 2.1% annual rate in Q/4---roughly the pace that has prevailed during the ten-year old expansion.
In order to eliminate as much noise as possible, I’ve analysed what has been going on in the economy from a monetary and supply side perspective over the past year. The level of U.S. economic activity was up 2.3% in Q/4. Employment accounted for 1.3% of the increase while productivity pitched in the other 1.0%. Meanwhile, the price deflator rose 1.7%.
Interestingly, the money supply with zero maturity grew 8.1% during the year compared to 4.0% for N-GDP---that is a big difference. I recognize that changes in the money supply get reflected in the real economy only after an undefined lag, it nevertheless shows that the monetary stimulants provided by the Fed are not coming across in either more inflation or growth.
It confirms that the deflationary conditions stemming from the aforementioned structural forces are more powerful than the amount of exertion expended by the Fed to inject inflation into the system. No wonder the Fed officials are in the middle of a major policy review that’s expected to bring about an important shift on how to deal with inflation.
Since Christmas, ten-year bond yields had plunged 43 bps to 1.50% on Friday--that is three standard deviations. According to my calculation, the coronavirus accounts for about 55% of the bond rally. It explains why the J.P. Morgan Fair-Value Model shows treasury yields are presently rich.
Our N-GDP/Bond Yield Model reveals that the ten-year treasury yield should be between 1.75% and 1.90%. The current bond yield of 1.50% suggests that the annual pace of N-GDP is heading towards 3.00%. It reflects an inflation rate of 1.00% with 2.00% growth or a growth rate of 1.00% with a 2.00% inflation. Tracking nominal growth is the right way because it takes everything that is fundamental into consideration and avoids the debate surrounding inflation, employment and productivity measurements, keeping the chicken-egg problem out of the way.
Disentangling what is happening in the bond market shows that even with the anticipation that the Fed will likely cut rates by June and definately sometime in 2020, inflationary expectations have not even nudged. It basically means that the Fed will need to cut rates many more times if it really wants to get inflation permanently up to 2.0%.
Are these scenarios possible? The short answer is yes. Until now, the recession risk has looked improbable. On balance the economic data from around the world has been reasonably good and encouraging. For example, the University of Michigan consumer survey showed confidence among the people remained near record high and rising.
The index was 99.8 on January 20. Suddenly and unfortunately, the yield curve turned negative last week, sending a warning flash. Moody updated its probit recession model on Friday and it sang a similar tune. The financial data put the odds of a recession in the next 12 months at 32%.
Contrary to the earlier zero-expectation, the intermediate portion of the treasury curve and short term interest futures are now betting that there is a 60% chance that the Fed will cut the policy rate as early as June.
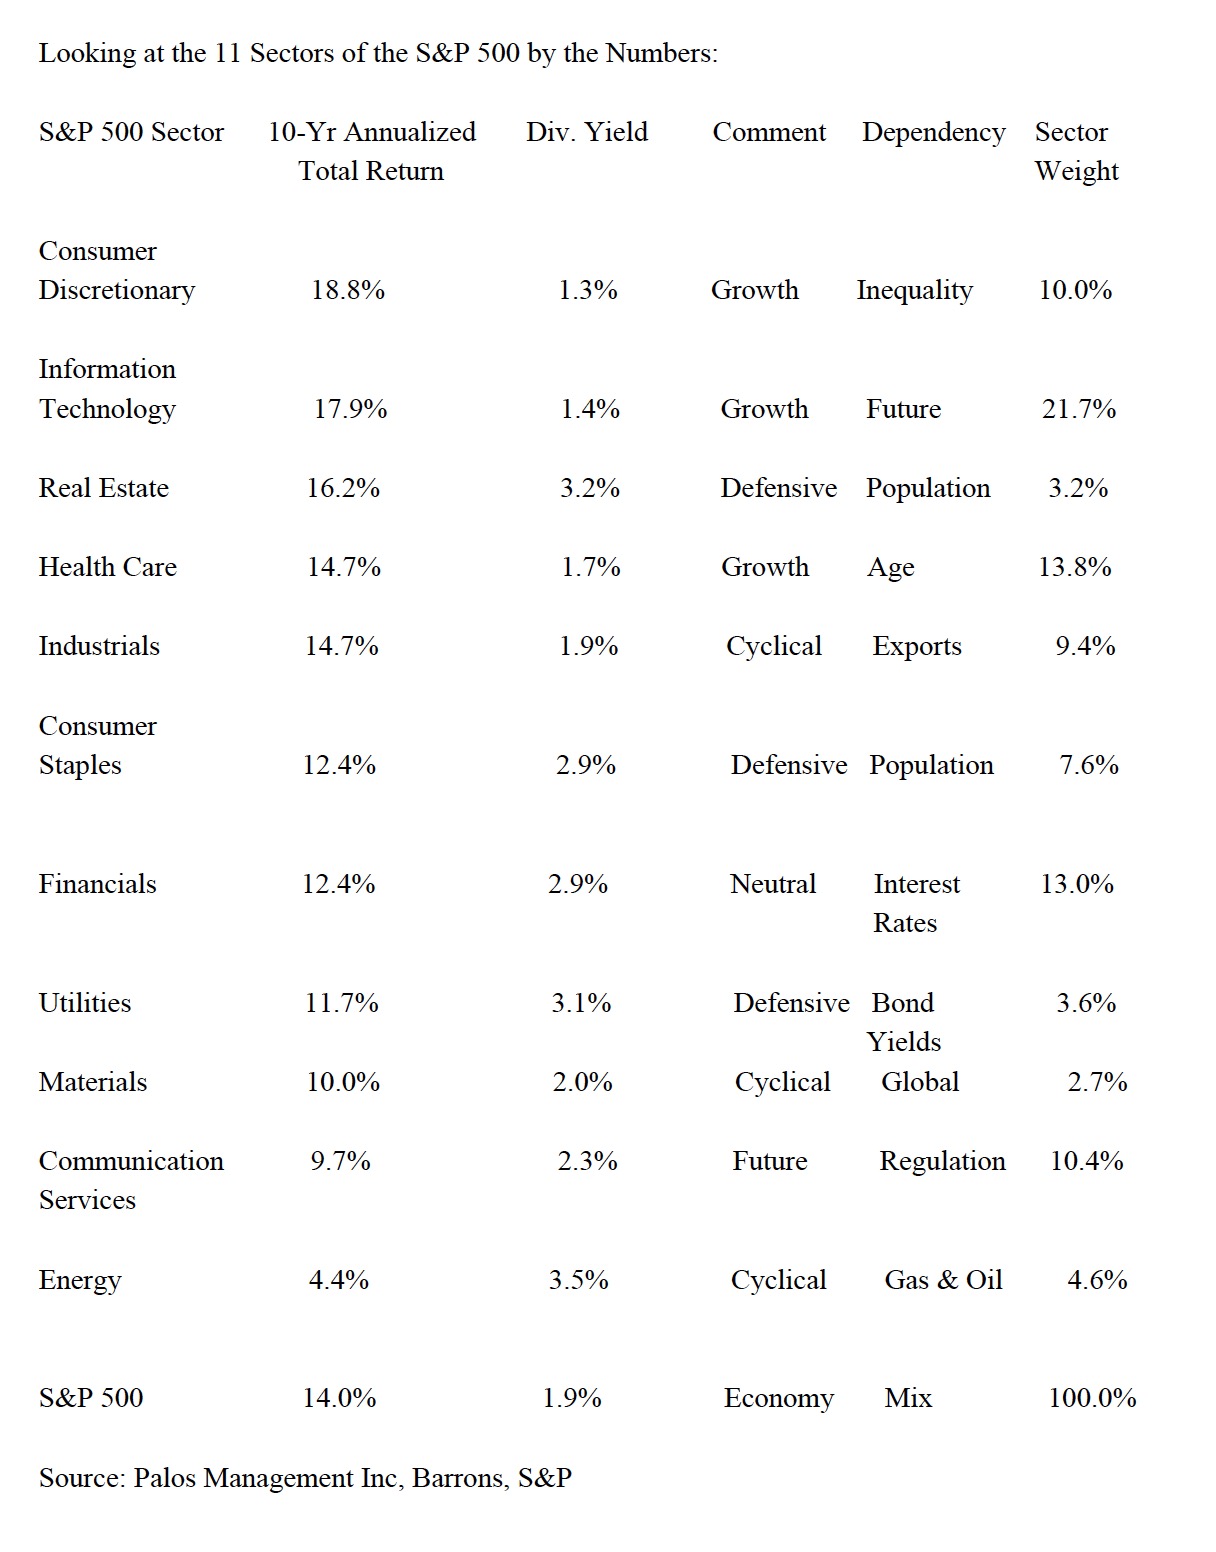
While I recognize that the coronavirus outbreak is threatening the business cycle, doubts are also emerging over the ability of central banks to shore up growth and spur inflation. It explains why I hold some bond proxies like REITs, Utilities and Telecoms and Gold stocks as ballast in my portfolio. There is no alternative to dividend paying stocks in a low-yield world. On average, U.S. stocks are yielding 1.90%, 40 bps above treasuries and 70 bps after tax. Additionally, dividend rates are rarely cut.
There is even a bigger reason why I have ballast in my portfolio. Paul Schmelzing. Gwynn Guilford of Quartz provides an overview of a working paper by Schmelzing which I further winnow to the following;
“Paul Schmelzing, an historical economist with Harvard University, wrote a fascinating working paper which reconstructs real interest rates in advanced economies using a staggeringly rich collection of records culled from diaries, account books, local archives and municipal registers, including everything from Medici bank loans and the Bank of England to France’s revolutionary loans to the US government, dating back to 1311. The conclusion of the work shows that in the fullness of time negative real long term bond yields are not unusual. Between 1313 and 2018, around 25% of advanced economies experienced negative long term yields (Interest rates less inflation), on average. In keeping with his larger finding, that share has risen over time and also the frequency of these episodes is rising. For example, the average share from 1313 to 1750 was 18.6%, compared to 20.8% from 1880 to 2018. Since 2009, that share now stands at 25.9%. What is weird is that the trend does square off with real GDP growth, productivity and population. It looks as if there was an inflection point in the late 1400s that gave way to the current trend in declining real interest rates. In a sudden manner, capital began pooling in great quantities with a jump in savings rates. It has to do with the long term wealth evolution. As saving rates began climbing in the late 1400s, money flowed back into bonds, pushing down rates—and setting off the centuries-long decline that continues still today. It indicates that later this decade, short-term real rates around the world will have dipped into permanent negative territory. Based on historical extrapolation Schmelzing also pinpoints 2038 as the year where all long term yields will also be negative.”
It will certainly not be a smooth slide down the slope. Throughout the last 700 years, up-cyclical forces have temporarily bucked the long term trend. Yet, I have a hard time believing that a deflationary bust is upon us, other than a possible short term and shallow cyclical upswing. Evidence does not support the idea that we may be on the cusp of one of these counter-secular reversals. Breaking a 700-year trend, really! No chance.
Copyright © Palos Management


