


Last week, I discussed the registering of the monthly buy signals, which confirmed the bull market in the S&P 500 had resumed following the 2018 Fed/Trade induced sell off. Here is a snippet of our history in this regard:
“In April of 2018, I penned an article entitled ‘10-Reasons The Bull Market Ended,‘ in which we discussed the yield curve, slowing economic growth, valuations, volatility, and sentiment. Of course, 2018 turned out to be a tough year culminating in a 20% slide into the end of the year. Since then, we have daily reminders we are ‘close to a trade deal,’ and the Fed has completely reversed course on hiking rates and extracting liquidity. In July, we published “S&P 3300, The Bull Vs. Bear Case.”
While volatility and sentiment have reverted back to levels of more extreme complacency, the fundamental and economic backdrop has deteriorated further.
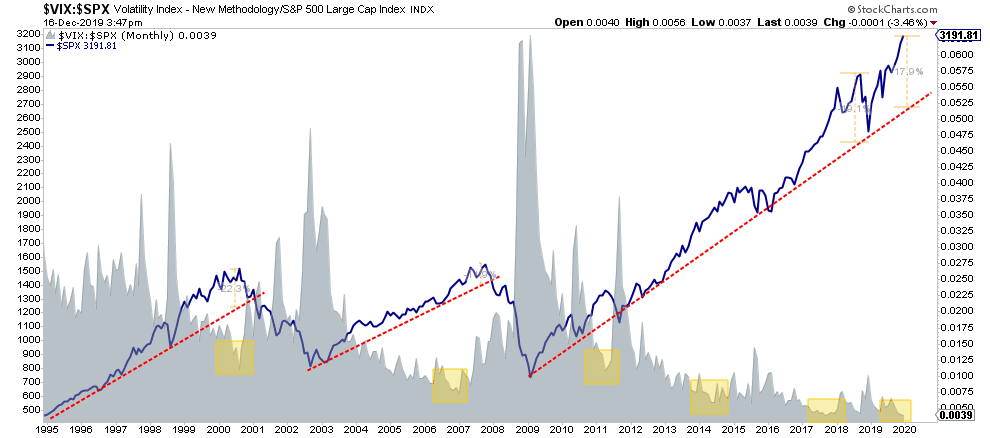
The first chart shows the monthly buy/sell signals stretched back to 1995 (25 Years). As shown, these monthly ‘buy’ and ‘sell’ indications are fairly rare over that stretch. What is interesting is that since 2015 there have been two-major sell signals, both of which were arrested by Central Bank interventions.”

With these “buy signals” in place, and the market pushing higher on conclusions of “trade deals” and the election of the conservative party in the U.K. (which clears the way for Brexit), the markets rallied further toward our target of 3300.
Over the last couple of weeks, we have slowly been increasing the equity allocation in portfolios toward being fully exposed.
This is because the Fed’s “QE-NOT QE” was being interpreted by the markets as QE. The chart below shows the increase in the Fed’s balance sheet as compared to the rally in the market.
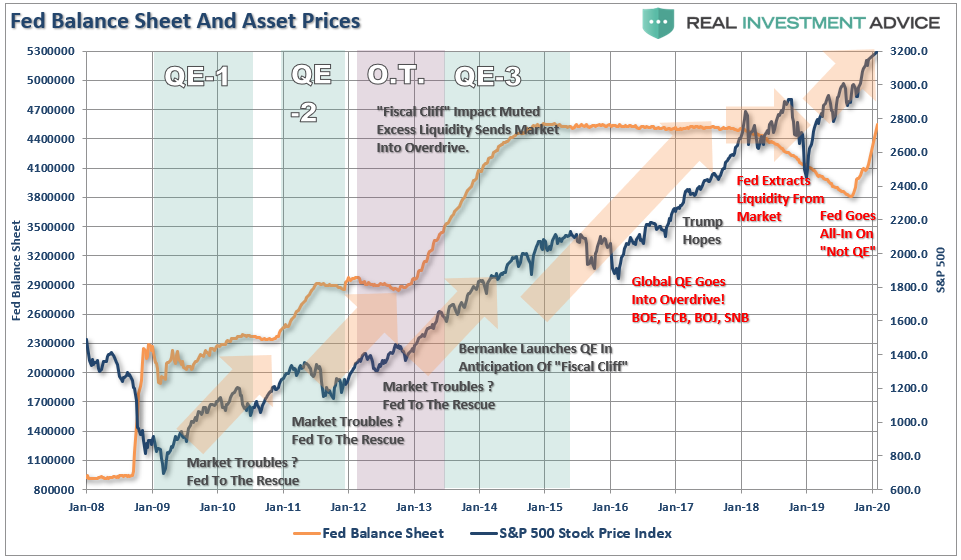
The recent market surge, which started coincident with the Fed’s restart of “QE, Not QE,” is very reminiscent of the surge in asset prices we saw at the end of 1999 as the Fed flooded the system with liquidity in advance of the potential “Y2K” issues.
As noted in our Daily Market Commentary:
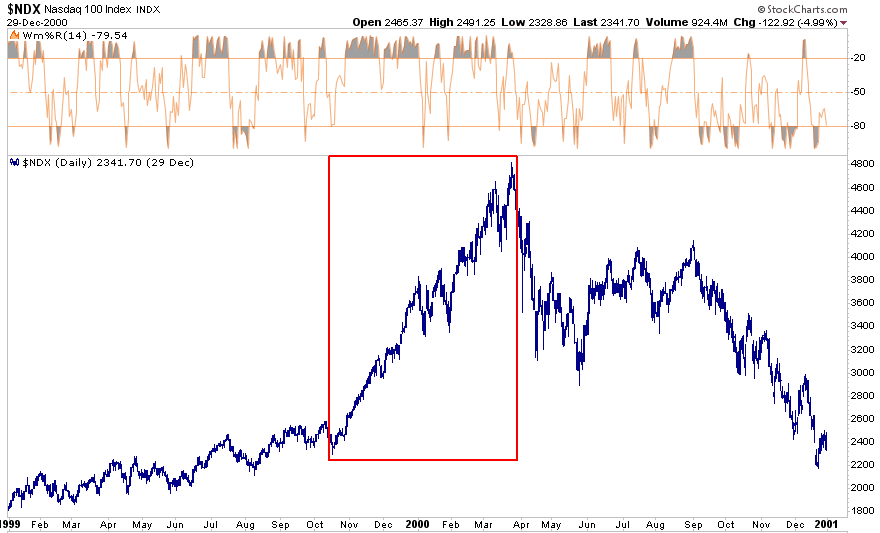
“Today’s ‘Chart of the Day’ shows the surge in the NASDAQ index, which occurred during the last few months of 1999. Most people attribute the massive gain to the feverish pitch in the dot com bubble. We believe the real culprit was the Fed which added substantial amounts of repo liquidity to the banking sector due to concerns of Y2K and the potential for mass computer malfunctioning. Those repo funds gravitated to the financial markets.
For more, please read the following WSJ article from 1999- Federal Reserve Clears Loan Facility Linked To Y2K Computer Problems.“
“The graph below shows the 10x surge in repo during late 1999 and its quick removal shortly after the New Year. Note the recent surge, on the right side of the graph, dwarfs the 1999 experience and that is before an expected $500 billion spike in repo financing over the next week or two.”
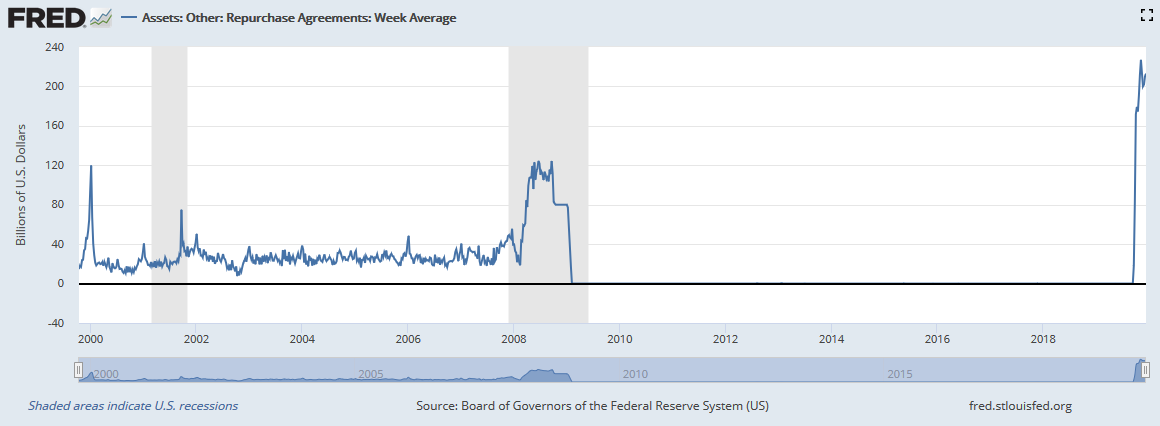
“Unlike 1999, we have our doubts as to how quickly the graph normalizes, as the Fed continues to underestimate the scope of the growing overnight funding issues.
To quote Yogi Berra “it’s deja vu, all over again.”
Overly Extended, Bullish & Valued
While we have been adding exposure in recent weeks to participate with the rise in the markets, the issues of technical price deviations, valuations, and subsequent risk has not been forgotten. By the majority of measures that we track from momentum, to price, and deviation, the market’s sharp advance has pushed the totality of those indicators back to overbought.
These overbought conditions, combined with the more extreme deviation from the 200-dma, and the longer-term bullish trend, have led to short-term corrections.
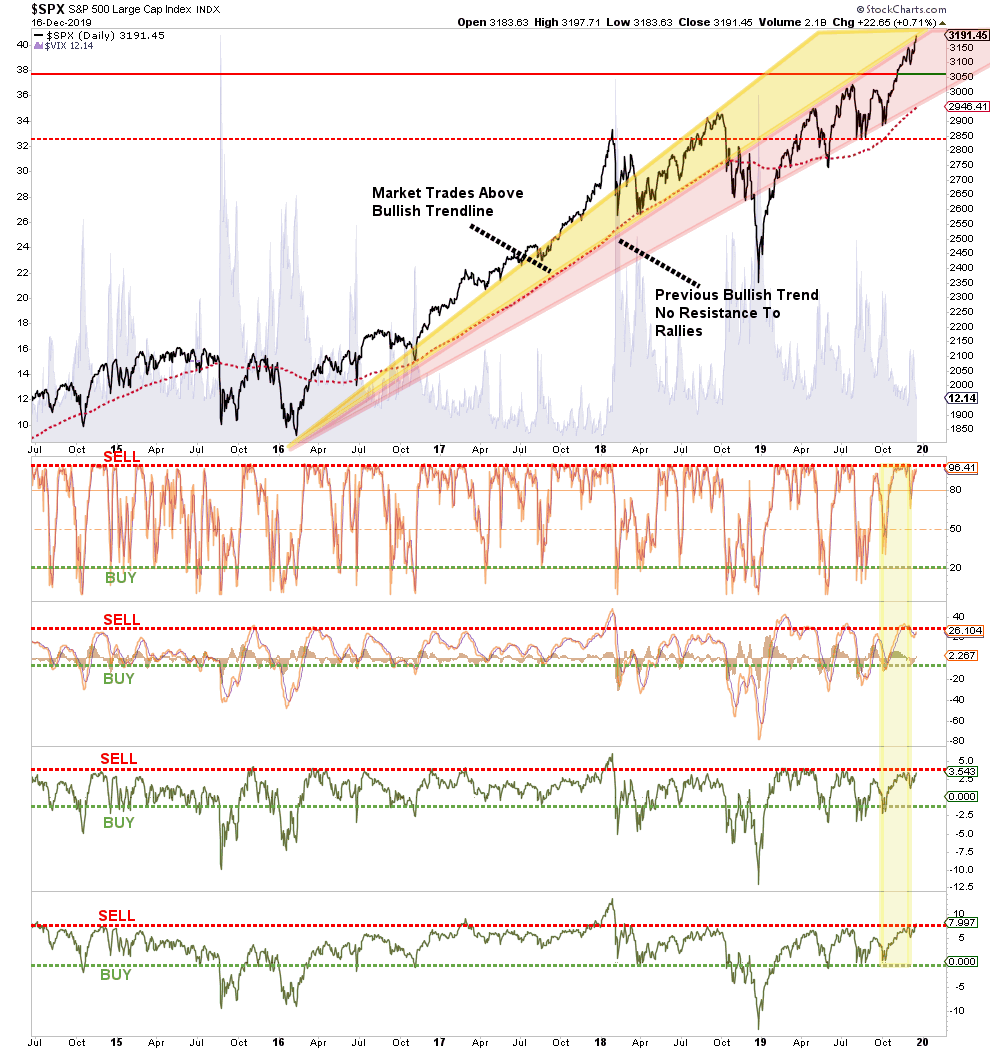
The deviations from the longer-term bullish trend are shown below, along with the more extreme levels of complacency by investors.
Historically, when all of the indicators are suggesting the market has likely encompassed the majority of its price advance, a correction to reverse those conditions is often not far away.
For these reasons, and others, this is why the exposure we have added has been only partial holdings, that we will build into opportunistically, and have a “value tilt” to them. Currently, there are the early signs of a rotation from momentum to value in the market, which gives “value” a bit of a “defensive” posture currently.
We still remain fully weighted in our fixed income portfolios, which consist of high quality holdings and a bit shorter-duration, with a slight overweight in cash.
How To Add Exposure
Adding exposure at these levels can be a challenge, unless you just don’t care about the “risk of loss.” Since we manage money for clients who are near, or in, retirement, we care about the risk very much. So, the answer to how to add exposure at this stage of the bull cycle is the same as the answer to that age-old question:
“How do you pick up a porcupine? Carefully.”
Here are the guidelines we are following:
- Move slowly. There is no rush in adding equity exposure to your portfolio. Use pullbacks to previous support levels to make adjustments.
- If you are heavily UNDER-weight equities, DO NOT try and fully adjust your portfolio to your target allocation in one move.This could be disastrous if the market reverses sharply in the short term. Again, move slowly.
- Begin by selling laggards and losers. These positions are dragging on performance as the market rises and tend to lead when markets fall. Like “weeds choking a garden,” pull them.
- Add to sectors, or positions, that are performing with, or outperforming, the broader market.
- Move “stop loss” levels up to current breakout levels for each position. Managing a portfolio without “stop loss” levels is like driving with your eyes closed.
- While the technical trends are intact, risk considerably outweighs the reward. If you are not comfortable with potentially having to sell at a LOSS what you just bought, then wait for a larger correction to add exposure more safely. There is no harm in waiting for the “fat pitch” as the current market setup is not one.
- If none of this makes any sense to you – please consider hiring someone to manage your portfolio for you. It will be worth the additional expense over the long term.
Buying Because I Have To. You Don’t.
“So, if you believe the market is overbought, why are you buying?”
There is a difference between views of long-term fundamentally driven potential outcomes, and short-term opportunities in the markets.
Let me be VERY clear about something.
As a portfolio manager, we buy “opportunity” because we have to. If we don’t, we suffer career risk, plain and simple.
However, you don’t have to. If you are truly a long-term investor, you have to question the risk being undertaken to achieve further returns in the market.
Think about it this way.
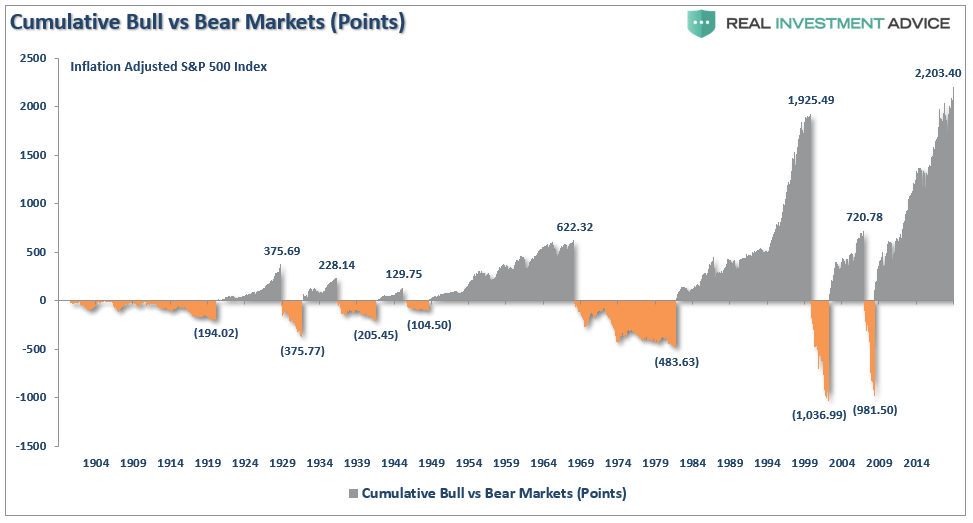
The markets have returned more than 300% since the 2009 lows in the longest bull market on record. Yes, it is still just one bull market.
Assuming that you were astute enough to buy the “cherry picked” low, and didn’t spend the bulk of the bull market rally simply getting back to even, you would have accumulated years of excess returns towards meeting your retirement goals.
If you went to cash now, the odds are EXTREMELY high that in the years ahead you will far outpace investors who remain invested. Sure, they may get an edge on you in the short-term, and chastise you for “missing out,” but when the next “mean reverting event” occurs the decline will destroy most, if not all, of the returns accumulated over the last decade. (That isn’t a theoretical assumption. It’s historical fact.)
While we may indeed be shifting exposure and taking on some additional risk, we do so very cautiously.
Cracks In The Bull Market Armor
While we did increase our exposure to the markets, as the bullish trend does currently persist, there is growing evidence of “cracks” appearing.
With the Fed flooding the system with liquidity to fund short-term repurchase operations, this is not normal and suggests that something has “broken” in the system.
Given the current rally is built on substantially weaker fundamental and economic underpinnings, weaker earnings growth, and an exhausted consumer, increases in equity risk could very well be reversed in short order. This due to the following reasons:
- We are in the latter stages of the bull market.
- Economic data continues to remain weak
- Earnings are beating continually reduced estimates
- Volume is weak
- Longer-term technical underpinnings are weakening and extremely stretched.
- Complacency is extremely high
- Share buybacks are slowing
It is worth remembering that markets have a very nasty habit of sucking individuals into them when prices become detached from fundamentals. Such is the case currently and has generally not had a positive outcome.
What you decide to do with this information is entirely up to you. As I stated, I do think there is enough of a bullish case, technically, to warrant taking on some equity risk on a very short-term basis. We will see what happens over the next couple of weeks.
However, the longer-term dynamics are turning more bearish. When those negative price dynamics are combined with the fundamental and economic backdrop, the “risk” of having excessive exposure to the markets greatly outweighs the potential “reward. “
Remember, investing is not a competition, it is a game of long-term survival.


