by Steven Vanelli, CFA, Knowledge Leaders Capital
As hopes for a trade deal fade, similar to May and August, the CNY is devaluing against the USD again. In our work there are a handful of fairly mechanical relationships that should follow if the CNY continues to devalue.
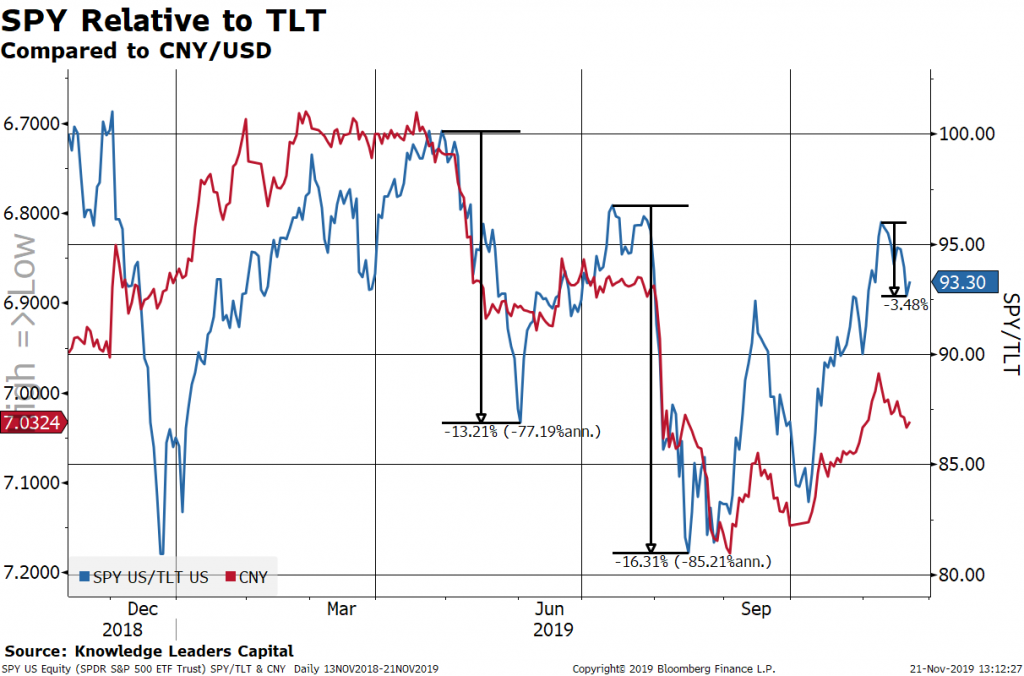
First, in the US, stocks have tended to underperform bonds. In the chart below, I show the SPDR S&P 500 ETF (SPY) relative to the iShares 20+ year US Treasury Bond ETF (TLT). In May and August, when the CNY fell, stocks fell relative to bonds 13.2% and 16.3% respectively. So far, stocks have underperformed bonds by about 3.4%. If history is any guide, this would indicate we are only about a quarter of the way through the relative underperformance US stocks vs. bonds.
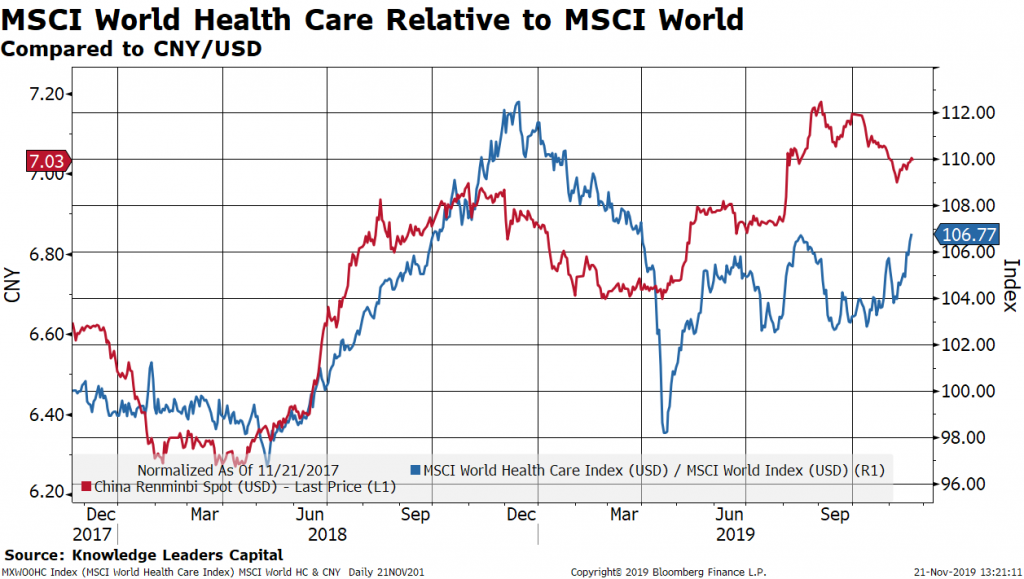
Among global equities, the sectors that tended to work the best were the more defensive oriented sectors. In the chart below, I show the MSCI World Health Care Sector relative to the MSCI World Index (both in USD). As the CNY has pivoted from its 6.98 lows recently, health care has outperformed by about 3%.
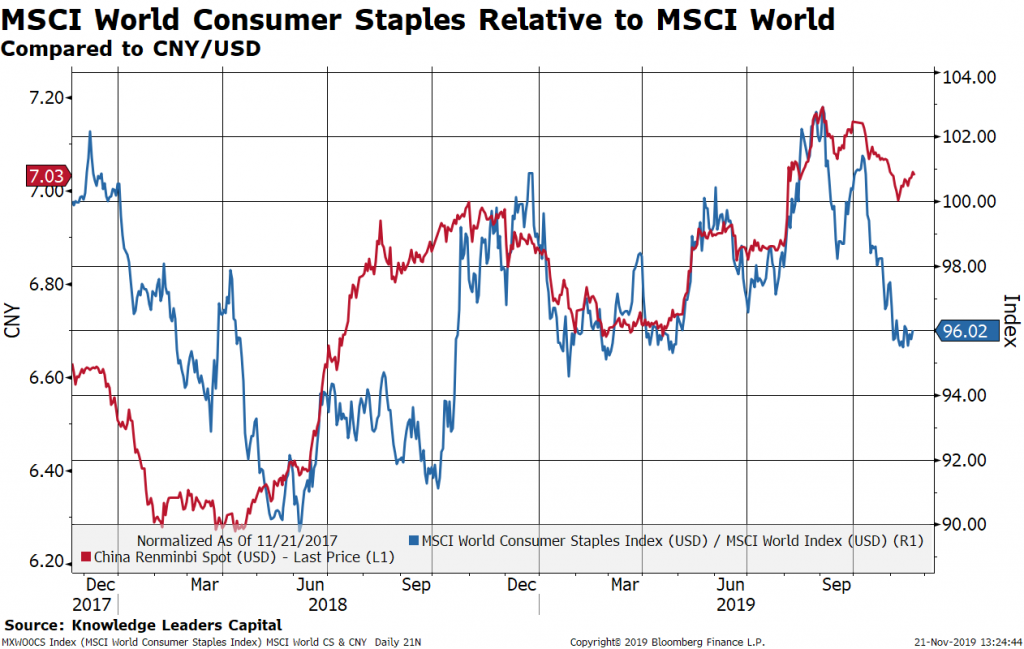
Consumer staples are perhaps the more interesting group here since they haven’t yet reacted to the move lower in the CNY. If the CNY pushes back to lows of 7.15-7.20, global staples may outperform.
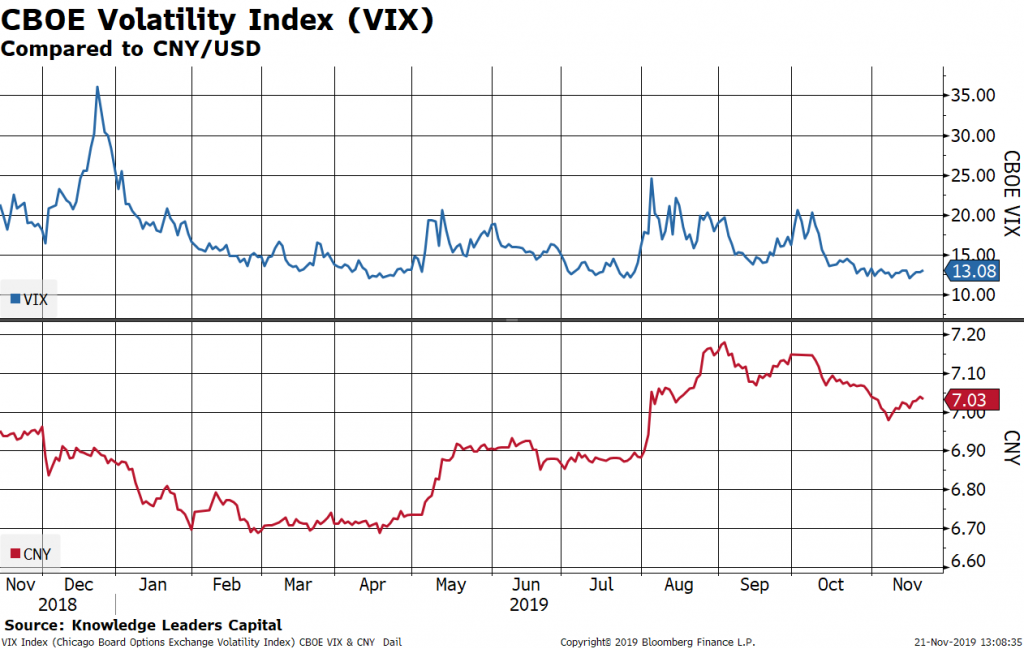
Stocks normally have an inverse relationship with equity volatility—when stocks drop, volatility spikes. This year, flare-ups in the VIX have correlated with periods of CNY devaluation (May and August). The VIX is about 1pt higher than recent lows, but if the CNY starts working back toward 7.20, the VIX has the potential to spike.
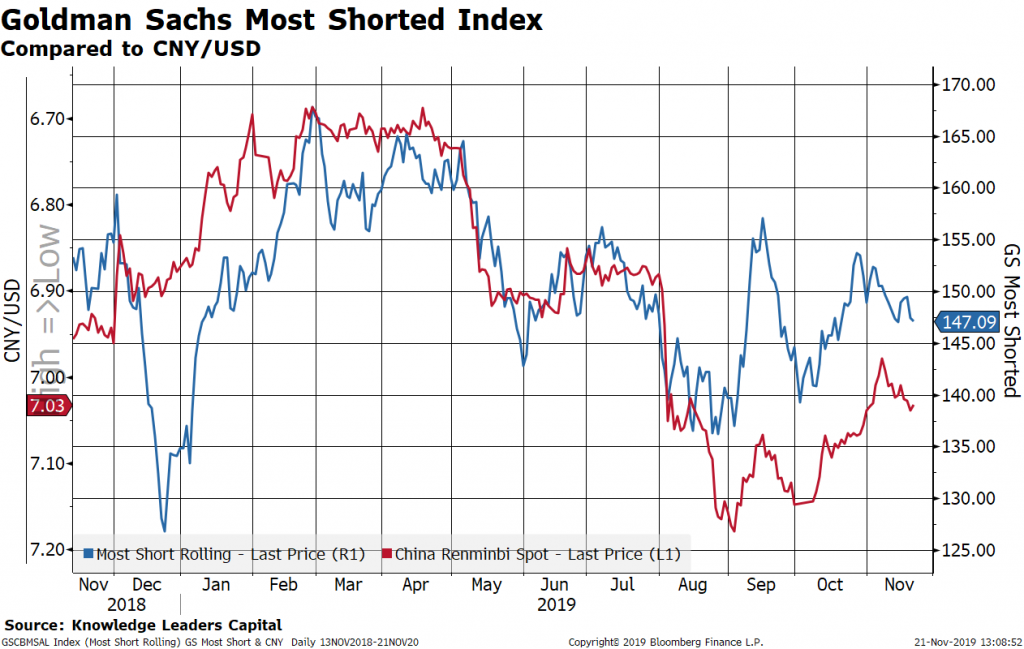
Among US equities, the most shorted stocks tended to underperform. In the below chart, I show the Goldman Sachs Most Shorted Index overlaid on the CNY (inverted). The most shorted stocks fell by several percent as the S&P 500 reached new highs recently.
The economic background music of a devaluing Chinese Yuan is pretty simple. There is an import substitution effect that negatively impacts US producers. In the chart below, I plot the US import price index from China (right axis) overlaid on the Chinese Yuan (left axis). US import prices from China have fallen by about 6% over the last 5 years as the CNY has devalued by about 12%. It is important to note here that import price indexes don’t include the effect of tariffs.
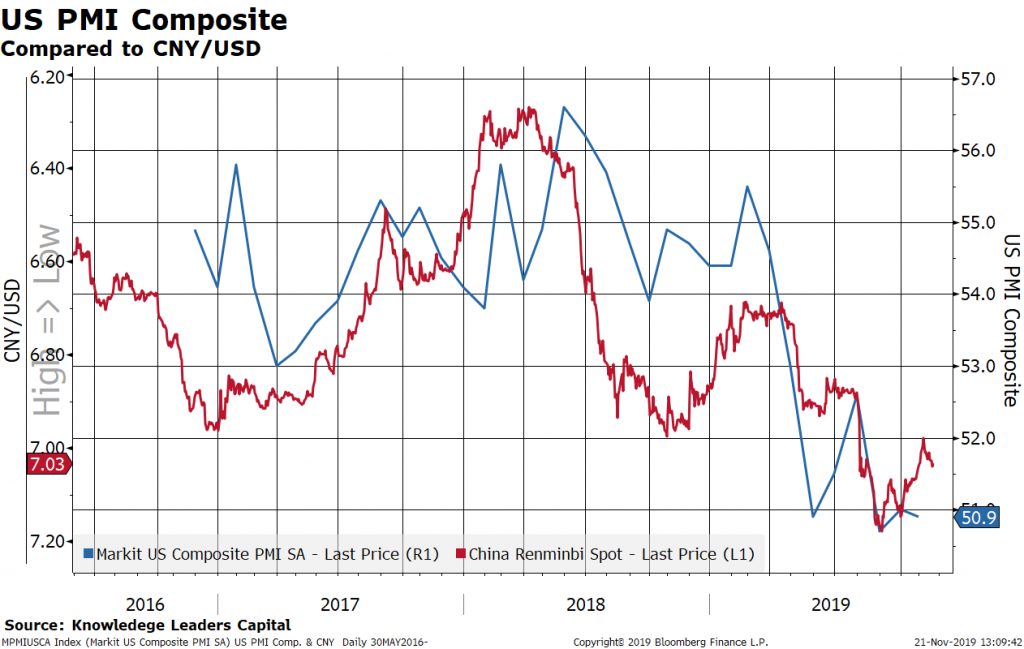
As US producers faced competition from cheaper imports, output and in turn employment, were negatively affected.
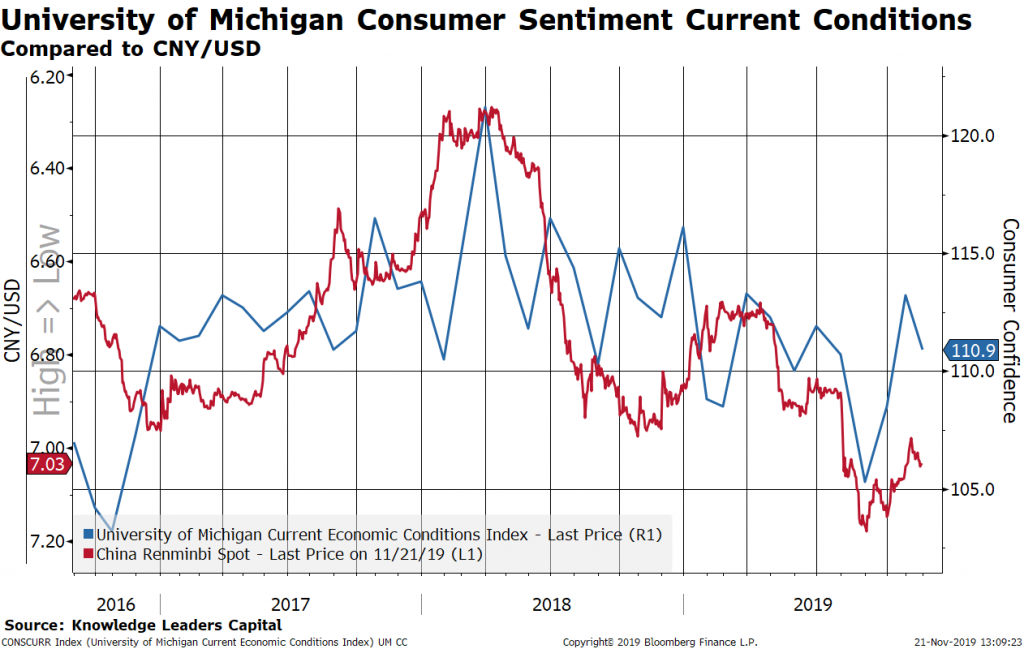
The devaluing Yuan has a depressing effect on the US consumer, manifest in consumer confidence readings. In the chart below I plot the University of Michigan Consumer Sentiment Current Situations Index compared to the CNY. The latest notch lower in consumer confidence is a predictable outcome of a devaluing CNY.
Putting this all together suggests a relatively simple asset allocation structure. When the CNY is devaluing, such as is currently the case again, we believe investors should consider overweighting bonds and defensive equity sectors, with appropriate hedges for equity volatility.
As of 9/30/19, SPY and TLT were not held in the Knowledge Leaders Strategy.


