
by Rob Arnott, Amie Ko, Jonathan Treussard, Research Affiliates
Key Points
- In a prolonged anti-value momentum-driven rally, it’s easy and natural to forget the long-term value proposition of a rebalancing discipline.
- The evidence and intuition underlying a contrarian value investing discipline has proven merit in cycle after cycle across history.
- By steadily rebalancing against the market’s most extravagant bets, RAFI strategies are positioned to recoup accumulated shortfall at the cycle’s turn, delivering meaningful long-term value-add.
- The continued outperformance of today’s most dominant companies is unlikely to be sustainable in the long run.
The current value–growth cycle has been particularly daunting for anyone with a value orientation. Value has been out of favor for approximately 12 years at this point. In this prolonged phase of growth dominance, the patience of investors in RAFI™ and other value-tilted strategies is naturally tested. How do we retain confidence in the disciplined rebalancing strategy that characterizes RAFI? In this paper, we examine the data underlying this extreme and—we believe—unsustainable growth-dominated market. And we review why our conviction in contrarian rebalancing is actually stronger than ever, reinforced by some nuances of this surge in growth stocks.
“It’s easy to stand with the crowd. It takes courage to stand alone.”
—Mahatma Gandhi
Introduction
Since the 1957 launch of capitalization-weighted indices, critics of these indices have pointed out it makes no sense to put more money into a company just because the company is expensive—that is, all else equal, if a company’s valuation multiple doubles, the cap index’s exposure to that stock doubles. Yet for a half-century, academe has taught investors a finance theory orthodoxy anchored on the concept of efficient markets, which requires us to view the world of investments from a cap-weight-centric perspective. From this one-dimensional viewpoint, the cap-weighted market is the “neutral” starting point and any departures are “active bets” that require a healthy dose of insight and/or hubris. While mainstream academics have slowly, but significantly, strayed from a strict efficient markets stance, the prevailing narrative continues to promote a cap-weight-centric view of the markets.
An alternative economy-centric worldview echoes the longstanding wisdom of Benjamin Graham (1949). While management teams work hard to convince market participants their tactics will ensure long-term market dominance for the public company they manage, investors can easily assess that same company’s current scale in the macroeconomy—in the very knowable here and now—by looking at its share of economy-wide corporate revenues, sales, and other fundamental metrics that determine the company’s economic footprint. When considered from an economy-centric standpoint, capitalization weighting is hardly passive: It is a growth-tilted, momentum-chasing, popularity-weighted index that makes huge active bets relative to today’s reality.
We think of these two perspectives on the market—market-cap-centric and economy-centric—as complementary. Each gives an incomplete picture of companies and markets. We believe investors should not be expected to solely adopt the cap-centric view when there are benefits to adding the economy-centric view to their toolbox. These benefits include both a richer understanding of capital markets and the opportunity to counteract the inherent return drag that comes from a 100% cap-centric worldview.
Should we trust our investment dollars to cap-indices growth-centric bets? While the ongoing 12-year growth rally appears to superficially support this view, consider the following. As of October 31, 2019, Tesla was worth more than any other auto company in the United States, indeed surpassing all auto companies in the world other than Volkswagen and Toyota. Tesla’s annual revenues, however, are only 17% as large as those of General Motors and less than 10% of the revenues of Volkswagen or Toyota. The market is tacitly saying that Tesla is a more important part of our future—and will deliver more discounted cash flow in the decades ahead—than any auto company in the world except for Toyota and Volkswagen. No one would dare say this glorious future cannot happen, but the market is prepaying for this outcome as if it is a fait accompli. Once again, just a little bit of good news from Tesla in October 2019 (a small quarterly profit) was extrapolated to mean clear skies ahead for the company.
The data we analyze in this paper show that the current underperformance of value stocks relative to growth stocks has exceeded most, and in emerging markets all, previous drawdowns. Historically, value stocks around the globe tend to win more often than they lose, beating growth over 5-year rolling intervals approximately 55% of the time for the full period of our analysis, rising to 70% over rolling 10-year intervals.1 That’s not reliable enough for most investors, but the starting points for winning spans and losing spans are very different, and the most recent decade is one of the worst of these spans.
As value lags, the economy-centric RAFI Fundamental Index™ strategy, unlike conventional cap-weighted value indices, takes on an ever-deeper value tilt, trading around the globe at unusually deep discounts relative to cap-weighted indices. These discounts range from near the respective strategy’s long-term median valuation level to far below its historical norm. If history is any guide, now is the time to increase allocations to value strategies and is not the time to lose confidence.
Exhibit 1 shows that when value lags, RAFI generally lags by less, and when value rebounds, RAFI generally rebounds by considerably more. The Russell 1000 Value Index (Russell Value) beat the Russell 1000 Index from 1984 to 1988, then went into a long span of underperformance from 1988 to 2000 as first the biotech bubble, then the tech bubble, took hold. The value index ultimately lagged the Russell 1000 by 28.6%. The 21.7% drawdown for RAFI in the 1990s lasted barely five years. The current drawdown, beginning in 2007, has been longer but somewhat less severe, reaching a maximum of 24.0% at the end of August 2019. The more recent drawdown for RAFI relative to the market has been shorter than in the 1990s—not even three years—and far milder at 8.2%.
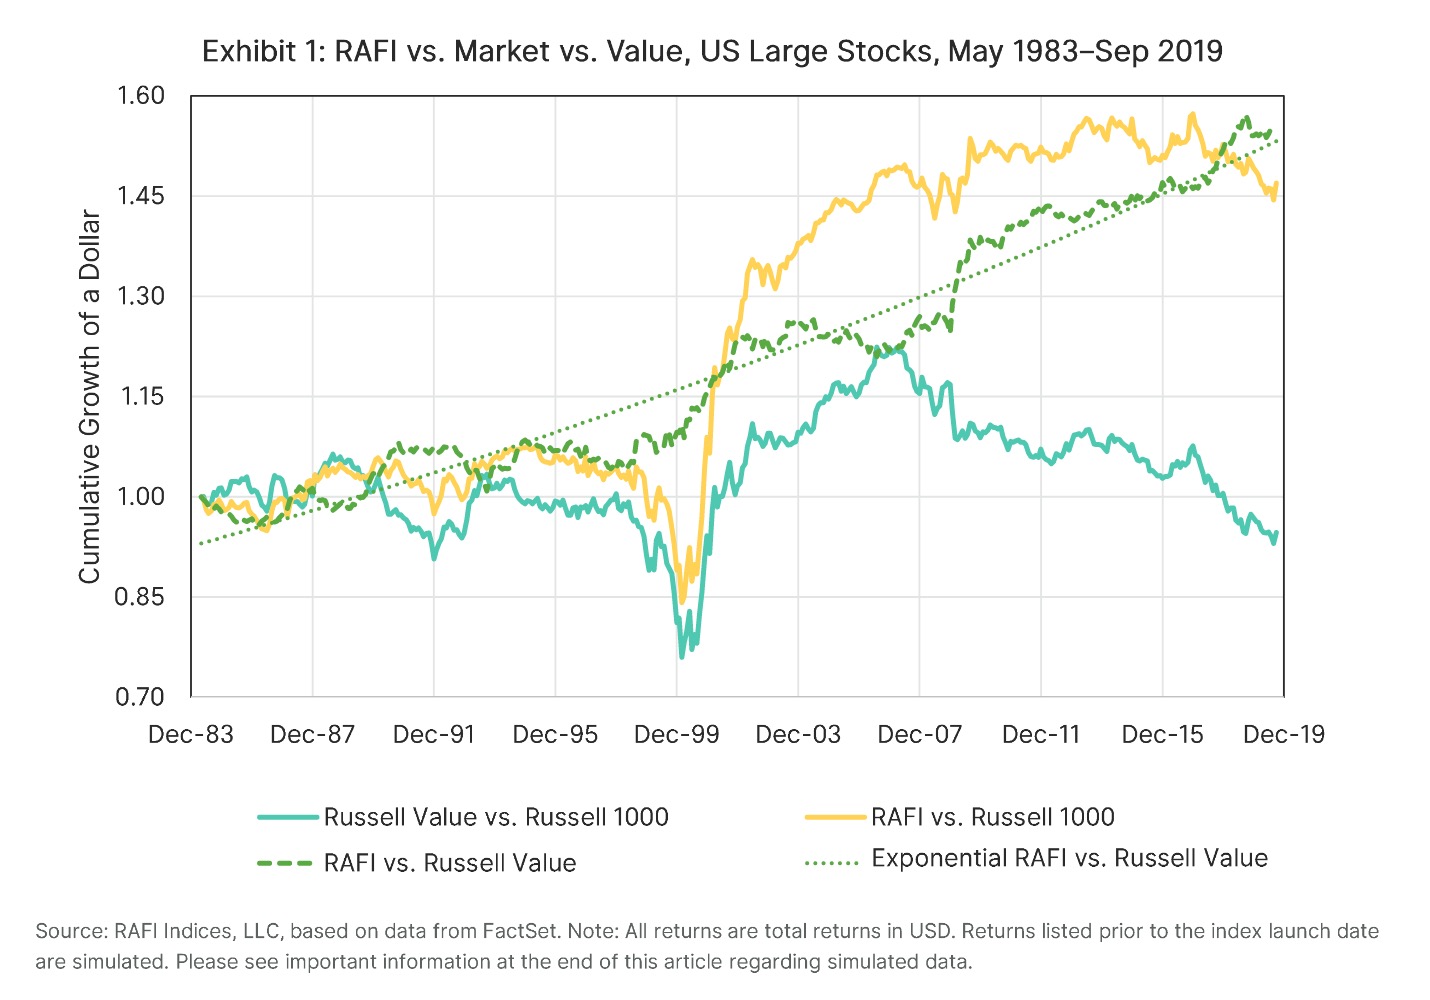
This record is a far more powerful proof statement for the Fundamental Index concept than if RAFI had beat the market over the last decade while value was winning. Value may beat the market over long spans, creating a sideways “sawtooth” pattern with a very modest upward slope, but RAFI beats the market by transforming this sawtooth pattern into an “upward ratchet” characterized by modest drawdowns and explosive recoveries. The dashed line compares RAFI with Russell Value. The outperformance is relentless with typically short and modest drawdowns. The longest drawdowns are two to three years from peak to trough, and the deepest is only 4% from peak to trough.
Download PDF of complete report
When (not if!) the market cycle inevitably turns in value’s favor, RAFI should experience a performance rebound. Past experience shows that RAFI quickly recoups any accumulated performance shortfall and achieves a swift, powerful recovery for the patient investor.
Why Should a Rebalancing Discipline Add Value?
We expect a value-oriented approach based on systematic rebalancing, such as the RAFI Fundamental Index strategy (a contrarian approach in the current growth-dominated market cycle), to add value in the long run for these reasons:
- Security prices are inherently noisy. Because the market is always seeking the fair value for every asset, the errors in security prices mean revert toward zero over time, with near-continuous new shocks in either direction. Long-horizon mean reversion is one of the largest and most persistent active investment opportunities, which is one of Research Affiliates’ core investment beliefs.2
- True bargains cannot exist in the absence of fear, reflecting a generally accepted narrative that conditions will get worse before they get better. This narrative is typically based on objective facts and has some likelihood of being true, at least near term. Reciprocally, what is comfortable and beloved is rarely profitable. A bubble cannot form without widespread comfort and complacency,3 paired with a reluctance to “miss out.” When the fear of missing out exceeds the fear of downside risk, the result is a negative risk premium—far too little-explored in academe!
- Third, behavioral finance teaches us that human nature creates anomalies in the capital markets that the patient investor can systematically exploit. Successful contrarian investing takes time because the market often requires years, even decades, to discern fair value. Performance chasers—who prefer the comfort of conformity and favor short-term profits over the interim discomfort associated with the potential of capturing longer-term profits—are on the other side of a long-term winning contrarian investor’s trades. Contrarian investing is inherently uncomfortable: A favorite maxim of George Soros is “to be in the game, you have to endure the pain.” Not the least source of discomfort is that an investor cannot know when a cheap asset will turn and thus must be prepared to buy before the turn, looking and feeling stupid until the turn happens, and must be prepared to buy more of whatever is newly cheaper, risking even more discomfort.
The efficient market hypothesis posits that any profitable mispricing—one that doesn’t introduce added risk to the investor—will be arbitraged away. Why do these market dynamics and investor behaviors not disappear over time? We can find the answer in how the RAFI Fundamental Index portfolio systematically rebalances. At any point in time, the portfolio resembles a broad market portfolio, but with a distinctive value tilt, a rather easy-to-accept proposition for an investor. Its trading strategy, however, is uncomfortable to say the least, placing itself at a distance from recurring and prevalent trading patterns.4
The RAFI rebalancing strategy is likely to be selling securities that are newly beloved and recently soaring, while buying whatever is newly feared and loathed and has recently tumbled in price. RAFI, therefore, puts its investors in a persistently uncomfortable position from a trading perspective as they repeatedly hear plausible rationales for why cheap stocks are just value traps along with glowing narratives about the glorious future prospects of growth stocks, further driving their prices higher and their valuations more expensive. Investors naturally lose patience when buying whatever is unpopular and selling whatever is popular does not quickly add value. This struggle for investors is, in and of itself, the primary reason a contrarian rebalancing discipline can add value over the long run.
The Value–Growth Cycle and Long-Term Excess Returns
Armed with an understanding of the philosophy and principles underlying a contrarian value investing strategy, we are better equipped to understand the pattern of returns that arises from the RAFI approach. We use long-horizon historical quarterly data across five geographic regions5 to analyze the RAFI Fundamental Index strategies’ outcomes, relative to both the cap-weighted market and to value stocks, over rolling five-year spans.
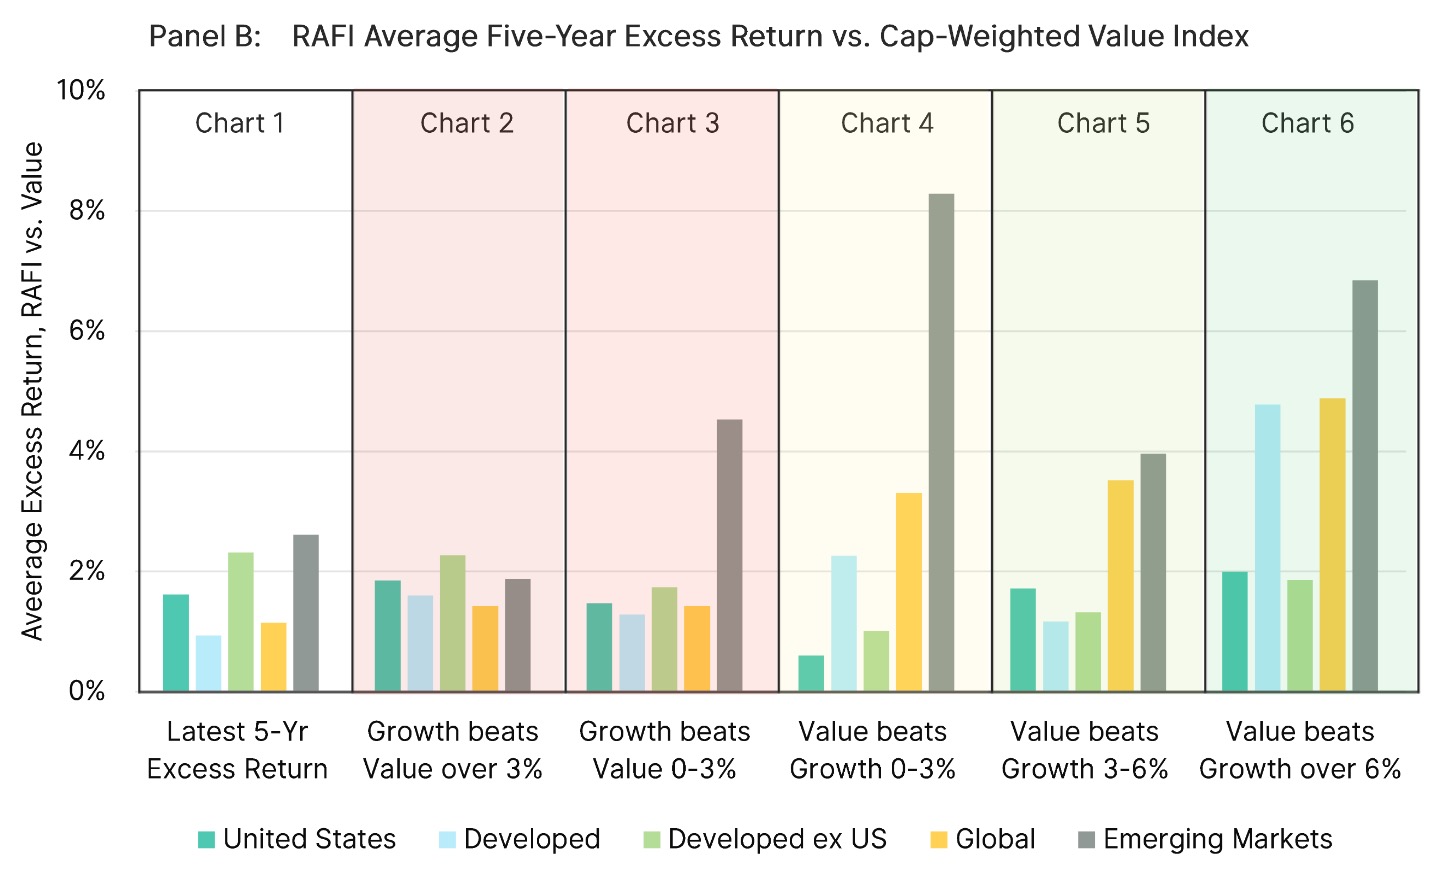
Exhibit 2 displays the average rolling five-year excess returns of each of the regional RAFI strategies versus the broad cap-weighted market index (Panel A) and the value index (Panel B). Charts 5 and 6 of Panels A and B show periods of strong value outperformance. In this environment, value stocks soundly beat their growth counterparts by more than 3% a year compounded over a five-year span. This regime occurred over one-third of the time on average across all five regions. Unsurprisingly, RAFI reliably outperformed, handedly beating, as shown in Panel C, both the market (98% in the 3–6% category and 100% in the > 6% category) and value stocks (87% in the 3–6% category and 96% in the > 6% category).
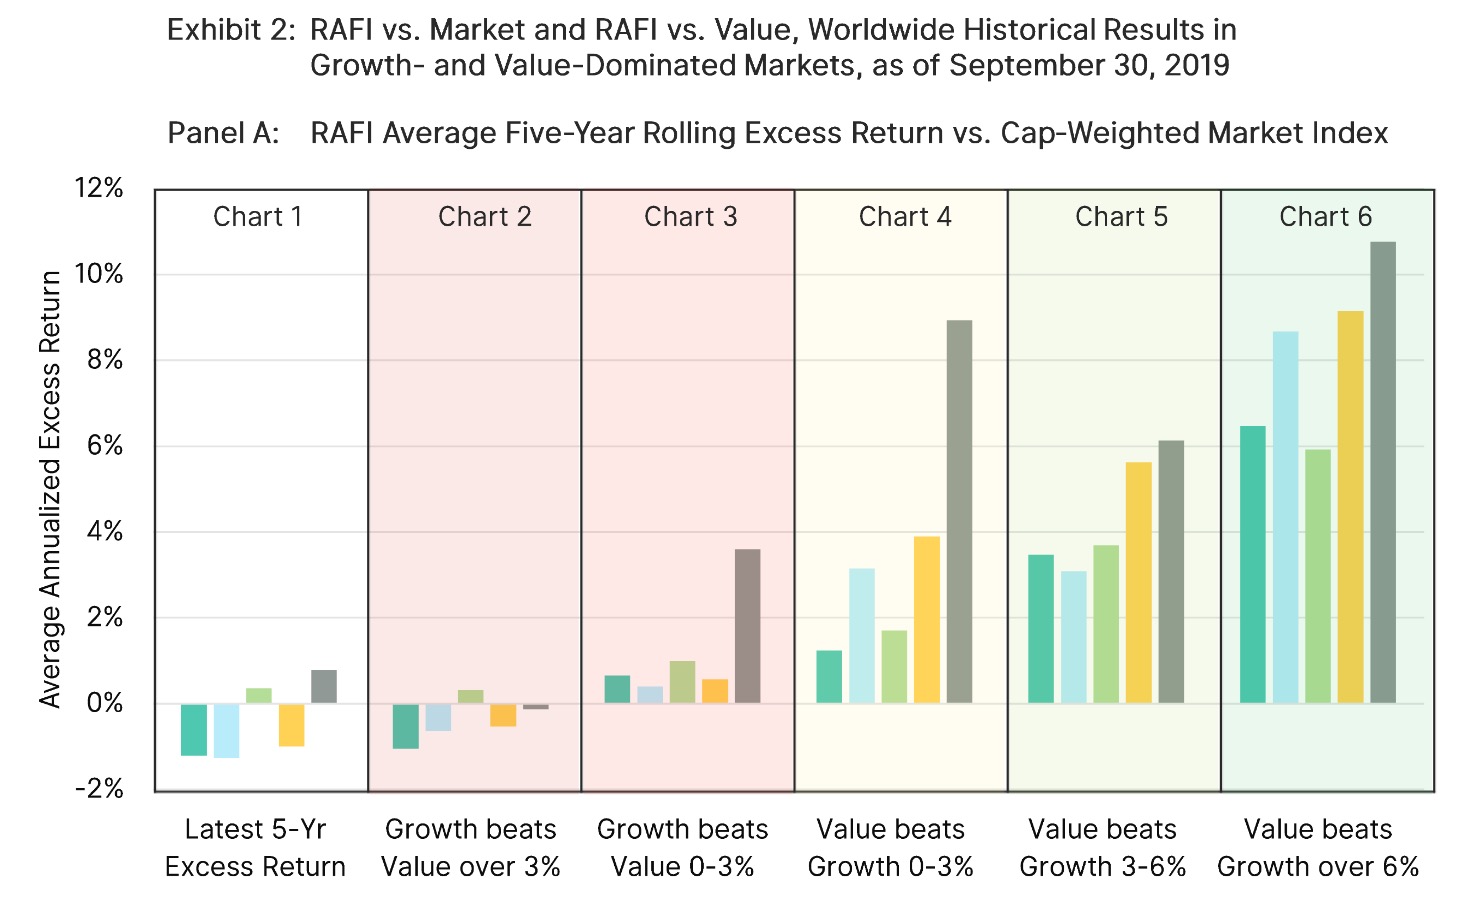
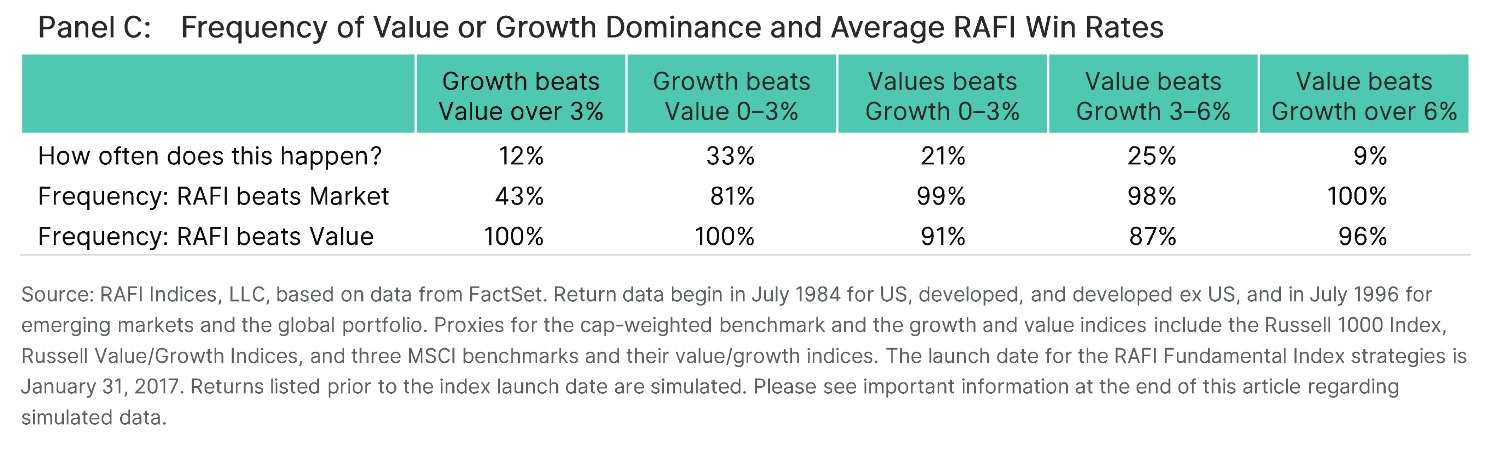
Next, let’s consider intervals during which the dominance of value or growth is moderate (or even neutral), when one beat the other by less than 3% a year over a five-year span, as illustrated by charts 3 and 4 of Panels A and B. Under these conditions, which on average occurred just over half of the time across all regions, RAFI again generally surpasses the market. Not only is the magnitude of outperformance large, but the frequency of outperformance is impressive. Of the 279 rolling observations, RAFI underperformed the market less than 12% of the time.
Finally, we turn to charts 1 and 2 of Panels A and B. Chart 2 includes all intervals when value lagged growth by at least 3% a year compounded over five years. Chart 1 shows the most recent five years, a period in which value has lagged growth by roughly 4% in each of these geographical regions.6 Across all these spans, RAFI has never failed to beat the value indices and has eked out a gain over the cap-weighted market some 43% of the time. Sound familiar? We’re actually winning — against these hurricane-force headwinds — in two of five (40%) geographical areas over the past five years!
The 12-year period since August 2007 has been a formidable growth-dominated environment; both magnitude and duration of this value–growth cycle rival the tech bubble. Naturally, many investors are wondering why value has persistently underperformed for so very long with no sign of let up in the most recent five years. Is it different this time?7
The most recent underperformance of value stocks relative to growth stocks falls within the worst decile of all outcomes in all regions. For developed ex US stocks, the rolling five-year losses of value stocks versus growth stocks are at the worst levels seen over the last 35 years. Over the last quarter-century, the value premium for global stocks ranks in the bottom 2nd percentile. And in the US market, an annualized value premium exceeding −5% over the last five years ending September 30, 2019, falls in the bottom 7th percent of all rolling outcomes since 1979.
How have the RAFI Fundamental Index strategies fared in these conditions? Despite having a deep value tilt, all five of the RAFI regional strategies have managed to outperform value stocks, from 0.8% to 2.6% a year, over the last five years, and over the last decade. The results against the broad respective markets, however, are mixed. The RAFI regional strategies fall short in the three regions that include the US market, where the FANMAG-led growth surge has been the most impressive.8 In two regions, developed ex US and emerging markets, RAFI shrugged off a dismal span for value investors, beating the cap-weighted broad market despite a value tilt every bit as deep as that of the cap-weighted value indices. These outcomes are consonant with the design of the RAFI strategies—and a far more striking proof statement for the efficacy of the RAFI strategy than outperforming the market when value is winning.
A growth-dominated market over the past decade has served as a headwind and a gift in the form of a potential opportunity for the long-term contrarian investor. As value has struggled, the RAFI Fundamental Index strategies have been continually rebalancing against the markets’ most extravagant bets. The result? The RAFI strategy is positioned to experience a performance snapback when the cycle turns once again in favor of value investing and to recoup the accumulated shortfall in astonishingly short order, achieving a swift and powerful recovery for the patient investor.
FANMAG: A New Paradigm?
During the tech bubble of 1998–2000, investors often heard the expression “new paradigm” to explain why profits, and even sales, were not important in valuing companies. The subsequent crash in tech and growth stocks was breathtaking. That expression is now toxic and shunned, but we’re hearing new variations on the same theme. While most investors understand that any value-oriented or contrarian strategy disproportionally underweights highfliers such as the FANMAG companies, the spectacular performance of these six stocks has left many questioning the structural positioning of the RAFI Fundamental Index and other value-tilted strategies.9
Let’s begin with some context. We notice an interesting contrast in the size and scale of the FANMAG stocks compared to the stock market capitalization of entire nations. As of September 30, 2019, these six companies had a combined capitalization of $4.3 trillion, representing nearly 14% of the US stock market’s total capitalization. If these six stocks were viewed as a single nation, the country of FANMAG would be more valuable than the entire publicly traded economy of the United Kingdom, China, France, or Germany. Indeed, other than the United States, only Japan has a total stock market capitalization larger than the aggregate capitalization of these six companies. Just as startlingly, if we remove FANMAG from the technology sector, we are left with a sector that is smaller than either the financial or healthcare sectors as well as the six-stock FANMAG collection itself.
Over the past decade, the FANMAG stocks’ aggregate market cap has grown nearly eightfold. Interestingly, Apple is now worth more than the entire S&P 500 energy sector, and Apple and Microsoft combined are worth more than the Russell 2000 Index. Representing a small handful of companies with extraordinary valuations, these six FANMAG stocks have delivered a 10-year return averaging a cumulative 720%, outpacing the growth of every other sector. All stocks except Apple currently trade at higher price-to-earnings (P/E) multiples than the market, and two are in excess of 50x earnings.
Contrast this exorbitant rise to the market’s performance, which has returned a cumulative 246% over the last decade and trades at a P/E level of 21x. Are these stocks likely to produce impressive growth to justify current market cap or have they gotten ahead of themselves? Are we in a new era, in which trending tech-flying market leaders can collectively outperform on a long-term basis, without some of them devouring the others’ market share? Unlikely.
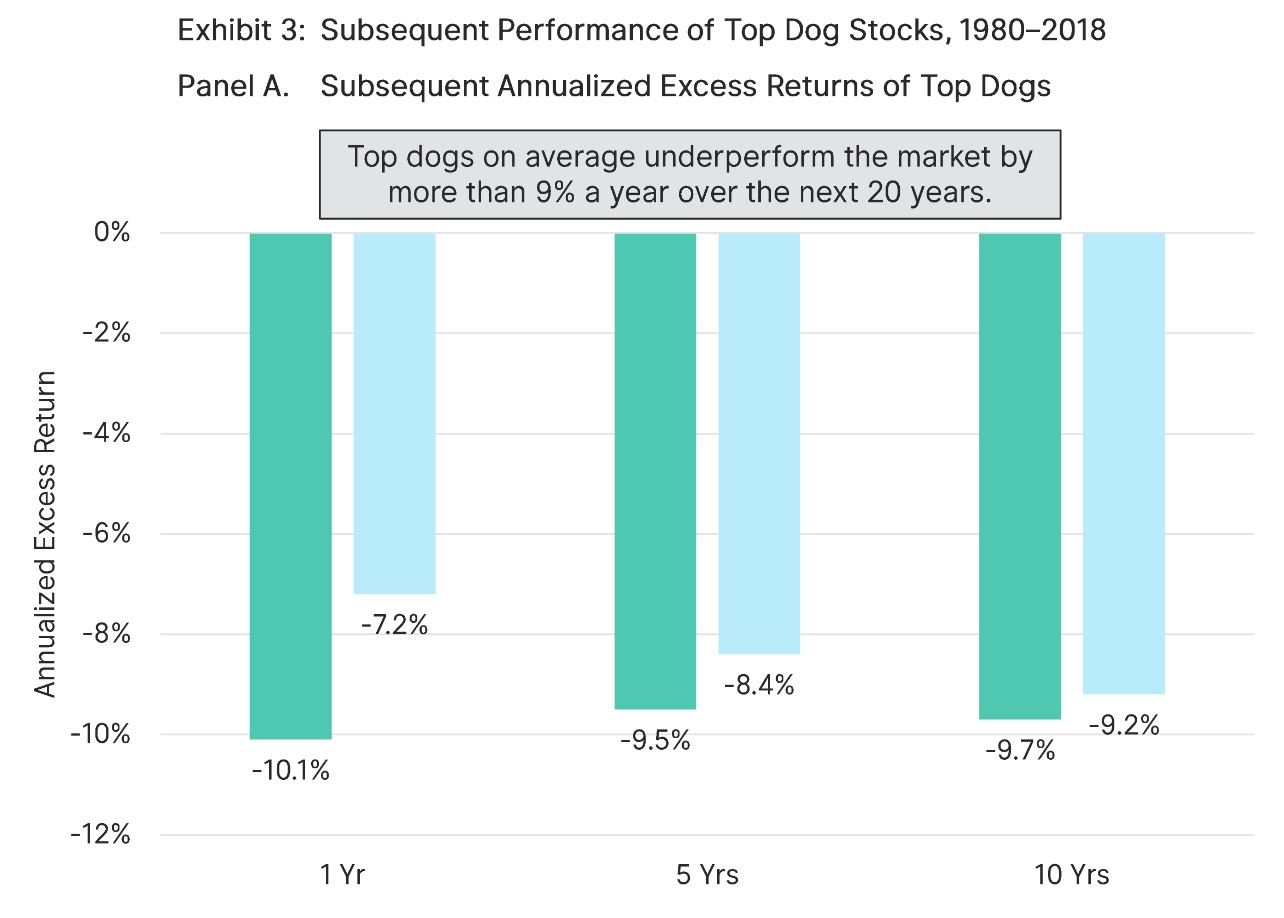
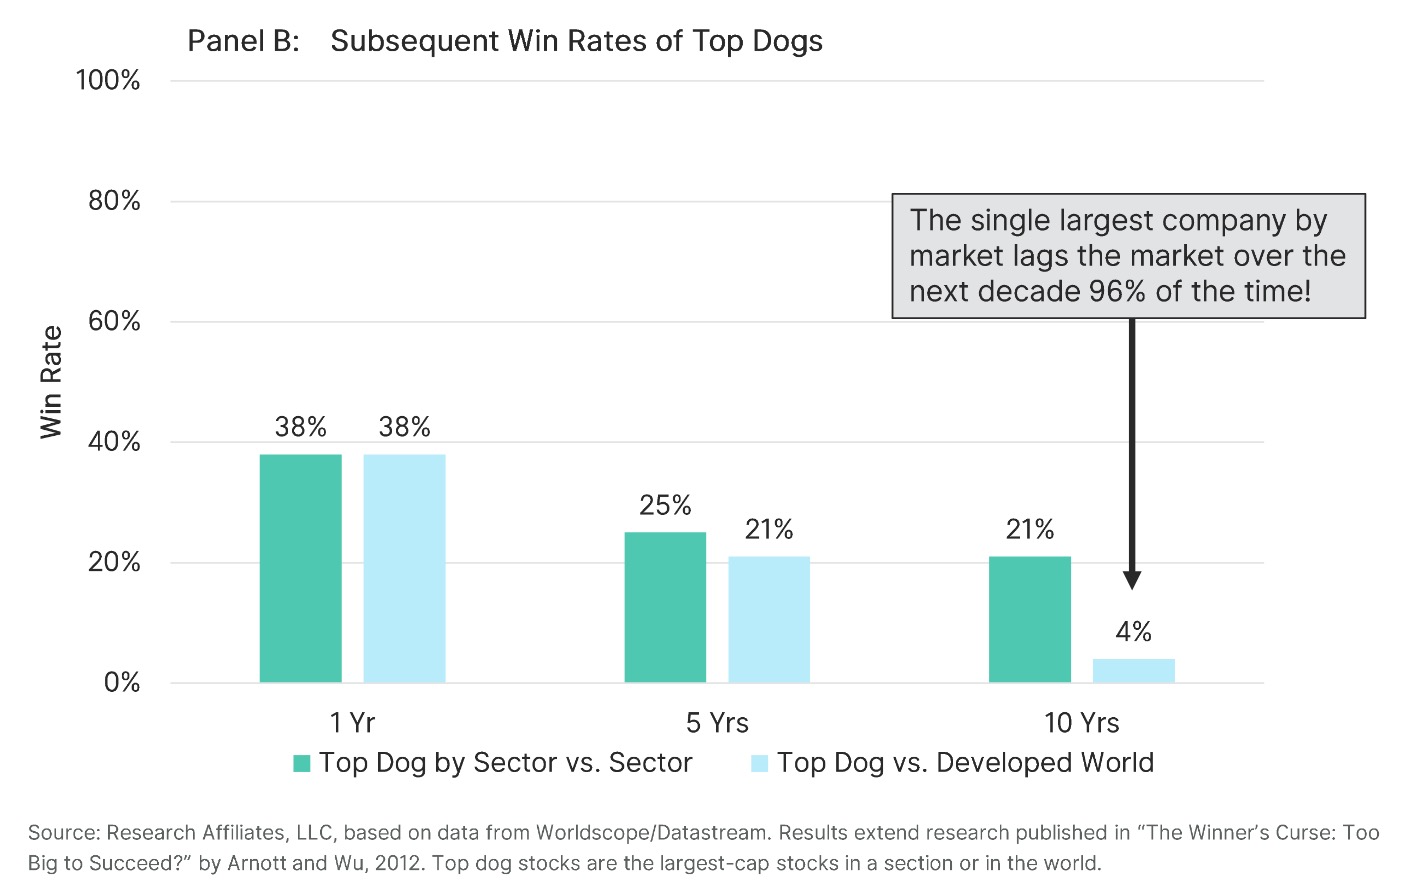
Based on past experience, the continued outperformance of today’s most dominant companies is unlikely to be sustainable in the long run. We have studied the largest companies by market capitalization (we call these the “top dogs”) over the last 40 years in each sector in each of the nine largest stock markets in the world.10 As shown in Exhibit 3, we find that nearly 80% underperformed their own sector over the next decade, falling short of the average return for that sector in each country by an average of 9.7% a year. For the number one stock in the world, the average shortfall was 9.2% a year, compounded, over the next decade relative to the MSCI ACWI Index. The largest market-cap stock in the world has outperformed the MSCI world index over a subsequent decade only once in the last 39 years.11 On average, since 1980, 8 of the 10 biggest companies in the world by market capitalization were no longer in the top ten list 10 years later.
Today the most dominant companies—7 of the 10 largest global companies measured by market capitalization—all come from just one slice of the market, the high-flying technology sector.12 Interestingly, at the peak of the tech bubble the tech sector was less dominant than it is today. What happened to those top tech dogs when the bubble burst? Of the 10 largest US market-cap tech companies in 2000, 2 disappeared entirely and only 3 remained in the top 10 over the next decade. None outperformed the S&P 500 Index: the average underperformance of that top 10 list was 5.3% a year for the subsequent 18 years.
What knocks companies from the top perch and contributes to disappointing subsequent outcomes? Plausible reasons include the heightened scrutiny from regulators or the punditry, competitors looking for an edge, the natural human (and political) tendency to resent success, and reduced agility as a company grows. Disruptors are often disrupted by newcomers, who are improving on the disruptors’ own innovations! Remember Palm, briefly worth more than General Motors? The ubiquitous Palm Pilot was disrupted and displaced by the ubiquitous Blackberry, which was disrupted and displaced by the ubiquitous iPhone. Most of these beloved disruptors also tend to be priced at lofty valuations, reflecting a consensus view they will remain on top and continue to grow handily. Any disappointments are—as we know—severely punished. The winner’s curse may be reason enough to follow the French adage pour vivre heureux, vivons cachés (to live happily, live hidden), because too much publicity indeed turns into bad publicity at the first sign of trouble.
Conclusion
When value stocks struggle, the rebalancing engine in the RAFI Fundamental Index strategy capitalizes on these times of pain by methodically positioning itself to capture the eventual rebound, positioning itself for meaningful long-term excess returns. So, while value has become cheaper and cheaper in recent years, RAFI has been tilting deeper and deeper into value, setting the stage for RAFI investors to benefit.
Conventional cap-weighted value indices lack the rebalancing engine of RAFI. Chaves and Arnott (2012) found that the systematic rebalancing approach of RAFI, which includes the Fama–French (2007) migration effect as well as the reweighting of its index constituents, contributes 20% more alpha than the rebalancing approach used by conventional value indices. Indeed, as growth stocks soar relative to value stocks, conventional growth indices become more concentrated, holding fewer and fewer stocks, as former growth stocks are increasingly pushed out of the growth portfolio and into the value portfolio. This is the antithesis of contrarian contra-trading.
We can’t promise that tough times are behind us—although the early weeks of September 2019 showed glimmers of a fast and forceful value rebound. Neither do we try to predict what the catalyst to a value rebound will be or how long the handful of high-flying technology market leaders will stay on their current path. Indeed, because the catalyst is inevitably a surprise to most market participants (otherwise it wouldn’t move the markets!), the quest for a potential catalyst is more of a fun parlor game than a reliable tool for investment strategy.
We cannot know whether this time is truly different, whether we really have entered a new era. Perhaps we have, but that doesn’t mean value investing should continue to underperform, it merely explains why value is newly cheaper. In his March 2000 letter to the Tiger Funds’ investors, Julian Robertson reminded them that in a rational environment value investing functions well and remains the best course. He explained that “in an irrational market, where earnings and price considerations take a back seat to mouse clicks and momentum, such logic, as we have learned, does not count for much.” He gave up on value at exactly the wrong time! Perhaps, similar to the new paradigm of the 1990s, things once again are not so very different this time.
So what do we have assurance in and what is our commitment to you? We can state with confidence that the evidence and intuition underlying a contrarian value investing discipline has proven merit in cycle after cycle across history. When value becomes cheap, it almost always and almost everywhere comes back as an outperforming investment strategy.13 After studying the RAFI approach across geographic market regions over long time horizons, we are convinced that in this protracted anti-value environment, the RAFI Fundamental Index strategy’s recent results fall within the expected range and pattern of outcomes. Looking forward, the RAFI approach is like a coiled spring ready to uncoil. When this occurs, patient investors stand poised to benefit.
An early mentor of one of us was fond of saying “This too shall pass.”14 Dare we flinch today? We owe it to investors to stay true to our principles.
Appendix. A Brief Synopsis of the Fundamental Index
Fifteen years ago in 2004, Research Affiliates launched the Research Affiliates Fundamental Index (RAFI) as an economy-centric alternative to cap indices, studiously mirroring the look and composition of the publicly traded macroeconomy, much as capitalization weighting matches the look and composition of the stock market. Arnott, Hsu, and Moore (2005) presented the initial studies supporting the Fundamental Index, which aligned with Benjamin Graham’s observation that the market is, in the long run, a “weighing machine.”
The RAFI strategy selects and weights stocks based on each company’s percentage share of the macroeconomy, using a blend of measures of a company’s economic footprint—sales, cash flow, dividends, and book value; the exact metrics can vary and some RAFI strategies have even selected and weighted companies based on measures as diverse as a company’s number of employees.
The result is a value-tilted strategy relative to the cap-weighted market index: premium-multiple growth stocks are reweighted down to their macroeconomic footprint and value stocks are reweighted up to their economic scale. These strategies tend to have roughly as much value tilt (or for the quantitatively inclined, approximately the same HML value factor loading) as the cap-weighted value indices, even though the latter exclude hundreds of growth stocks while RAFI does not. But, it’s a special value tilt, a mirror image of the cap-weighted market’s willingness to pay a premium for expectations of future growth. The RAFI value tilt is mild whenever value is trading at a modest discount to growth (1977 and 2007) and takes on a deep value bias when value is trading abnormally cheaply (1972, 2000, 2009, and today).
Importantly, note that RAFI does not earn an excess return because of the fundamentals (or the fundamental weighting) of the stocks it holds and owes only a fraction of its value-add to its classically defined value tilt. Most of the excess return is due to rebalancing against the market’s most extravagant bets. RAFI is, therefore, inherently a systematic buy-low/sell-high strategy, profiting from long-horizon mean reversion. As such, RAFI will struggle with short-term performance during periods when the markets are pricing growth stocks ever higher and value stocks ever lower. As value lags, RAFI takes on an ever-deeper value tilt, so that when value eventually rebounds, RAFI historically tends to recoup any shortfall remarkably quickly.
The RAFI Fundamental Index strategies weight companies based on their economic footprint and thus adopt an economy-centric lens. The Fundamental Index strategy’s nonprice measures of company size act as a stable anchor weight to trade against often exaggerated price movements. Consequently, the RAFI strategies thank Mr. Market for portfolio gains from appreciating growth companies and trim such positions back down to their economic footprint. They also thank Mr. Market for newly available low prices on value stocks and top up those positions back to their economic footprint. In other words, the market offers gains and bargains to those who are willing to contra-trade based on investor psychology.
In today’s prolonged anti-value momentum-driven rally, it’s easy to let the principles of buy-low/sell-high fall by the wayside. It’s also convenient to forget the long-term value proposition of contra-trading and overlook the fact that the rebalancing engine embedded in the RAFI Fundamental Index strategies drives long-term value-add. Contrarian value investors of an economically intuitive strategy have an edge in the long run—but here’s the catch. Investors must arm themselves with enough patience and courage to accept intervening bouts of grief in exchange for the longer-run payoff of a grand gift of outperformance.
Endnotes
1. Using quarterly returns data over five-year rolling periods from September 1984 to September 2019, where available, we find that value stocks outperform growth stocks in 284 of 510 rolling outcomes, or 56% of the time, across five geographic regions: US, developed, developed ex US, global, and emerging markets. In the US market, value and growth stocks are represented by the Russell 1000 Value and Russell 1000 Growth indices. For developed, developed ex US, global, and emerging market (EM) stocks, the value and growth indices are represented by applicable MSCI value and growth indices. Our analysis begins in September 1984 for US, developed, and developed ex US stocks, and in September 1996 for global and EM stocks.
2. Brightman, Masturzo, and Treussard (2014) explained the three core investment beliefs that support Research Affiliates’ investment philosophy: 1) investor preferences are broader than risk and return, 2) prices vary around fair value, and 3) lack of conviction restricts investors from exploiting long-term value.
3. Arnott, Cornell, and Shepherd (2018, 2019) discussed how to identify a bubble (and an anti-bubble) in real-time instead of years after the fact. In addition, Baz et al. (forthcoming) of PIMCO make the critical observation that a bubble requires a high probability of continuing into the next period for its existence in the present moment. This high probability of a small movement in the prevailing direction is better aligned with the investment horizon of most investors, even when it is counteracted by a smaller probability of a larger correction, setting the stage for the bubble to eventually burst.
4. We have often suggested that if a half-century ago finance theory had embraced the concept of a “fear premium” instead of a risk premium, many of the anomalies, puzzles, and paradoxes in finance would have been expected, even predicted, rather than coming as a surprise in search of a risk-based explanation. Investors fear unloved deep-value stocks and fear missing out on the trendiest growth stocks. The former should have a higher risk premium, while the latter should have a smaller risk premium, if any at all—hence, the value effect. Investors may typically fear small, unknown companies, while not fearing large, well-known companies they encounter in their daily lives— hence, the size effect. Investors may fear a stock in free fall, but not one that’s rising like a rocket—hence, the momentum effect. And the list goes on. These effects can be arbitraged away, but only if enough investors choose to embrace assets that would normally engender fear. Fear-based anomalies are always likely to return because their genesis is in humans’ primal impulses. This thesis was brilliantly explored by Hirschleifer (2001), who wrote an alternative history in which he asks us to
[p]icture a school of sociologists at the University of Chicago proposing the Deficient Markets Hypothesis: that prices inaccurately reflect all available information … [and] a brilliant Stanford psychologist, call him Bill Blunte, invents the Deranged Anticipation and Perception Model (or DAPM), in which proxies for market misvaluation are used to predict security returns … [leading to] the best-confirmed theory in the social sciences.
This alternative history is no less plausible than the actual history leading to the current dominance of EMH and CAPM.
5. The RAFI Fundamental Index return series in the US, developed, and developed ex US regions begin on April 30, 1984. The RAFI Fundamental global and emerging market indices begin on September 30, 1996. Readers and the investment community at large should be cognizant of the trap of placing too much faith in backtested data, including our own. As explored by Harvey, Liu, and Zhu (2016), Treussard and Arnott (2017), and Arnott, Harvey, and Markowitz (2019), technology and professional incentives have collided and created a boom in “successful” backtests that should be regarded with a great deal of caution. Arnott, Harvey, and Markowitz offer a protocol for limiting spurious data mining in the current era of cheap computational power and machine learning.
6. Over the last five years ending September 30, 2019, value lagged growth by 5.6%, 4.3%, 3.8%, 4.2%, and 3.6% a year in the US, developed, developed ex US, global, and EM markets, respectively.
7. Do value stocks have unprecedented headwinds? Are the growth opportunities for value companies abnormally poor relative to the past? No. The entire shortfall is a result of value becoming less and less expensive as measured by valuation multiples relative to growth, not because growth is in any way “better” than in previous growth cycles.One of us will cover this topic in greater depth in an upcoming journal article. Stay tuned.
8. The FANMAG stocks are the usual FANGs (Facebook, Amazon, Netflix, and Google/Alphabet) plus prior-generation tech highfliers Apple and Microsoft.
9. In the same vein, many investors are unsurprised that the RAFI strategies generally allocate more to energy stocks relative to the market’s allocation. Although RAFI largely maintained an overweight tilt to the underperforming energy sector relative to the cap-weighted index, the sector overall added an annualized excess return of 0.6% a year from July 1962 to December 2018. Why? While the overweight allocation detracted from overall excess return, the impact of security selection more than offset the loss. Systematically rebalancing across stocks in the sector added value over the long run.
10. For interested readers, Arnott and Wu (2012) explored the historical performance of top dog stocks.
11. ExxonMobil beat the MSCI ASWI Index from 1993 through 2002, although Microsoft edged it out of top-dog status. Today, ExxonMobil does not even make the top ten.
12. These include Amazon, Google, Facebook, Microsoft, Apple, Tencent, and Alibaba. Amazon is formally classified as a consumer noncyclical company, but most would agree that its edge is in technology.
13. Exceptions exist, but they are, well, exceptional and include the expropriations of the Russian stock market in 1917, Chinese stock market in 1949, Venezuelan stock market in 1908, and Egyptian stock market in 1952 as well as the near-obliteration of the Japanese stock market in 1943–45 and German stock market in 1940–45 as well as in 1922–25. This is why investors are encouraged to diversify globally!
14. Bob Lovell, the CIO for Crum & Forster Insurance, and founding chairman of First Quadrant was Rob Arnott’s boss/mentor from 1988 to 1993.
References
Arnott, Rob, Bradford Cornell, and Shane Shepherd. 2018. “Yes. It’s a Bubble. So What?” Research Affiliates Publications (April).
———. 2019. “Bubble, Bubble, Toil and Trouble.” Research Affiliates Publications (July).
Arnott, Rob, Campbell R. Harvey, and Harry Markowitz. 2019. “A Backtesting Protocol in the Era of Machine Learning.” Journal of Financial Data Science, vol. 1, no. 1 (Winter):64–74.
Arnott, Robert D., Jason C. Hsu, and Philip Moore. 2005. “Fundamental Indexation.” Financial Analysts Journal, vol. 61, no. 2 (March/April):83–99.
Arnott, Rob, and Lillian Wu. 2012. “The Winner’s Curse.” Journal of Indexes (October 29).
Baz, Jamil, Josh Davis, Christian Fuenzalida, and Jerry Tsai. “Method in the Madness: Bubbles, Trading and Incentives,” forthcoming.
Brightman, Chris, James Masturzo, and Jonathan Treussard. 2014. “Our Investment Beliefs.” Research Affiliates Fundamentals (October).
Chaves, Denis B., and Robert D. Arnott. 2012. “Rebalancing and the Value Effect.” Journal of Portfolio Management, vol. 38, no. 4 (Summer):59–74.
Fama, Eugene, and Kenneth French. 2007. “Migration.” CRSP Working Paper No. 614 (February). Available on SSRN.
Graham, Benjamin. 1949. The Intelligent Investor. New York: Harper & Brothers.
Harvey, Campbell, Yan Liu, and Heqing Zhu. 2016. “. . . and the Cross-Section of Expected Returns.” Review of Financial Studies, vol. 29, no. 1 (January):5–68.
Hirschleifer, David. 2001. “Investor Psychology and Asset Pricing.” Journal of Finance, vol. 56, no. 4 (August):1533–1597.
Robertson, Julian. 2000. Letter to clients: https://money.cnn.com/2000/03/30/mutualfunds/q_funds_tiger/sidebar.htm (March).
Treussard, Jonathan, and Robert Arnott. 2017. “I Was Blind, But Now I See: Bubbles in Academe.” Research Affiliates Publications (June).
The material contained in this document is for general information purposes only. It is not intended as an offer or a solicitation for the purchase and/or sale of any security, derivative, commodity, or financial instru-ment, nor is it advice or a recommendation to enter into any transaction. Research results relate only to a hypothetical model of past performance (i.e., a simu-lation) and not to actual results or historical data of any asset management product. Hypothetical inves-tor accounts depicted are not representative of actual client accounts. No allowance has been made for trad-ing costs or management fees, which would reduce investment performance. Actual results may differ. Simulated data may have under-or-over compensated for the impact, if any, of certain market factors. Simu-lated returns may not reflect the impact that material economic and market factors might have had on the advisor’s decision-making if the adviser were actually managing clients’ money. Simulated data is subject to the fact that it is designed with the benefit of hindsight. Simulated returns carry the risk that the performance depicted is not due to successful predictive modeling. Simulated returns cannot predict how an investment strategy will perform in the future. Simulated returns should not be considered indicative of the skill of the advisor. Investors may experience loss. Index returns represent back-tested performance based on rules used in the creation of the index, are not a guarantee of future performance, and are not indica-tive of any specific investment. Indexes are not managed invest-ment products and cannot be invested in directly. This material is based on information that is considered to be reliable, but Research Affiliates™ and its related entities (collectively “Research Affiliates”) make this information available on an “as is” basis without a duty to update, make warranties, express or implied, regard-ing the accuracy of the information contained herein. Research Affiliates is not responsible for any errors or omissions or for results obtained from the use of this information. Nothing contained in this material is intended to constitute legal, tax, securities, finan-cial or investment advice, nor an opinion regarding the appropriateness of any investment. The information contained in this material should not be acted upon without obtaining advice from a licensed professional. Research Affiliates, LLC, is an investment adviser regis-tered under the Investment Advisors Act of 1940 with the U.S. Securities and Exchange Commission (SEC). Our registration as an investment adviser does not imply a certain level of skill or training. Investors should be aware of the risks associated with data sources and quantitative processes used to create the content contained herein or the investment management process. Errors may exist in data acquired from third party vendors, the construction or coding of indices or model portfolios, and the construction of the spreadsheets, results or information provided. Research Affiliates takes reasonable steps to eliminate or miti-gate errors, and to identify data and process errors so as to minimize the potential impact of such errors, however Research Affiliates cannot guarantee that such errors will not occur. Use of this material is condi-tioned upon, and evidence of, the user’s full release of Research Affiliates from any liability or responsibility for any damages that may result from any errors herein.The trademarks Fundamental Index™, RAFI™, Research Affiliates Equity™, RAE™, and the Research Affiliates™ trademark and corporate name and all related logos are the exclusive intellectual property of Research Affiliates, LLC and in some cases are registered trade-marks in the U.S. and other countries. Various features of the Fundamental Index™ methodology, including an accounting data-based non-capitalization data processing system and method for creating and weight-ing an index of securities, are protected by various patents, and patent-pending intellectual property of Research Affiliates, LLC. (See all applicable US Patents, Patent Publications, Patent Pending intellectual prop-erty and protected trademarks located at http://www. researchaffiliates.com/Pages/legal.aspx, which are fully incorporated herein.) Any use of these trademarks, logos, patented or patent pending methodologies with-out the prior written permission of Research Affiliates, LLC, is expressly prohibited. Research Affiliates, LLC, reserves the right to take any and all necessary action to preserve all of its rights, title, and inter¬est in and to these marks, patents or pending patents. The views and opinions expressed are those of the author and not necessarily those of Research Affiliates, LLC. The opinions are subject to change without notice. ©2019 Research Affiliates, LLC. All rights reserved.
Copyright © Research Affiliates