by Craig Basinger, Chris Kerlow, Derek Benedet, Alexander Tjiang, Gerald Cheng, RichardsonGMP
Summary
I. Market recap – Getting better
II. Market cycle – Signs of improvement
III. Trimming U.S.
IV. Gold
V. Portfolio positioning
I. Market recap – Getting better
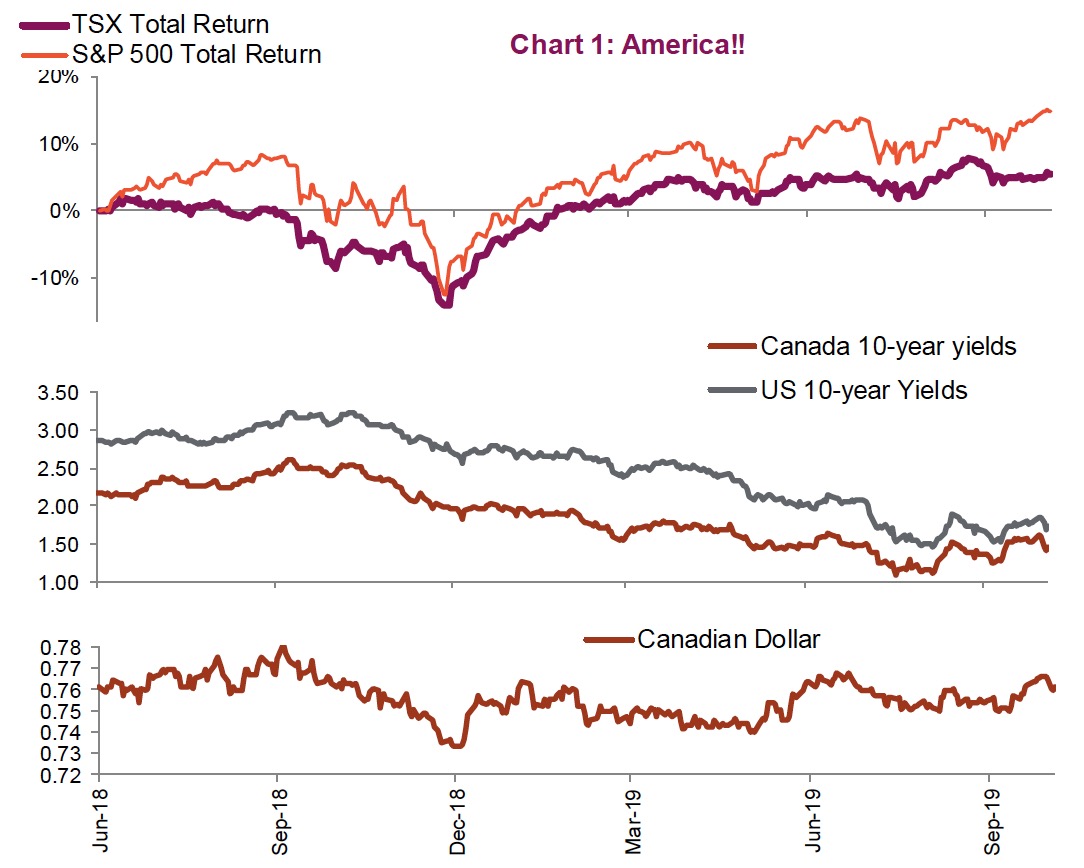
The U.S. Federal Reserve has managed to take care of its little yield curve problem. After three rate cuts in just four months, the yield curve is now un- inverted across almost all maturities. The stock market was obviously agreeable to the accommodative policy with the S&P 500 reaching new all-time highs, gaining 2.2% in October, and being led by the resurgent Health Care and Technology sectors.
Back in Canada, the S&P/TSX Composite has been left out of ‘the party’ of new highs. Canadian equities posted losses in October, with the S&P/TSX Composite down by 0.9%. Weighing on shares were the Consumer and Energy sectors.
While it’s easy to blame Energy, there really was no standout sector to help offset. October belonged to the loonie. As its namesake bird migrates south, the Canadian dollar soared early only to fall back to earth in the dying days of the month as the weather turned (Chart 1 lower panel).
The monetary policy divergence between Canada and the U.S. continued in October. The Fed cut its target rate in both September and October, while the Bank of Canada has held steady. Meanwhile, the bond market continued to sell off after topping out mid-August. Since yields bottomed, the Canadian 10-year bond yield has climbed over 30 basis points to yield 1.45%. The shift in improving risk sentiment is the primary driver – a development we’re seeing across all major economies. Bond yields in Europe are near the upper end of their three-month ranges.
Geopolitically, we’re seeing much of the same. China and the U.S. are back to playing nice with ongoing yet inconclusive trade negotiations. Brexit news continues to make headlines, yet often fails to make any lasting impressions on the overall market besides heightened volatility for the British Pound. It would seem that after three years of proceedings, traders either don’t’ care or have grown bored of giving a damn. The European economy is similarly apathetic, despite the stock market rising 12.7% this year. Looking back over the past 20 years, the EuroStoxx 50 index is actually down 8% on a price-return perspective, compared to 123% for the S&P 500.
This environment should also continue to push equity prices higher, given the substantial improvement in the risk profile for stocks. Now, it’s time to just wait for the economic data to beat the now-lowered expectations.
II. Market cycle
Signs of improvement on the margin
When it comes to investing, relative success or failure has a lot to do with how expectations change. Today, expectations or the mood appears to be slightly better than a month or two ago. While there hasn’t been a material improvement in the economic data (yet), the fact that things haven’t deteriorated or slowed more may be feeding the ‘glass half full’ perspective. European economic data remains in the dumps, but one could argue the Brexit fear has at least been kicked down the road a few months with a UK election scheduled for December. The risk of a ‘No-deal’ Brexit appears to have faded considerably. The pace of China’s economic growth has decelerated to 6.0%, but there are some early encouraging signs in manufacturing activity. The U.S. economy grew by 1.9% in the third quarter, slightly better than expected and only a hair slower than the second quarter. The consumer remains steadfast, plus net exports and corporate spending were not all that bad as expected.
The health and spending activity of the U.S. consumer remains paramount for stemming the current pace of slowing global economic growth. So far so good. Personal balance sheets are strong, savings rates are good and, based on the latest quarterly GDP data, the consumer did a good amount of spending on durable goods. Add to this the current healthy employment environment and low interest rates, and the consumer remains well positioned.
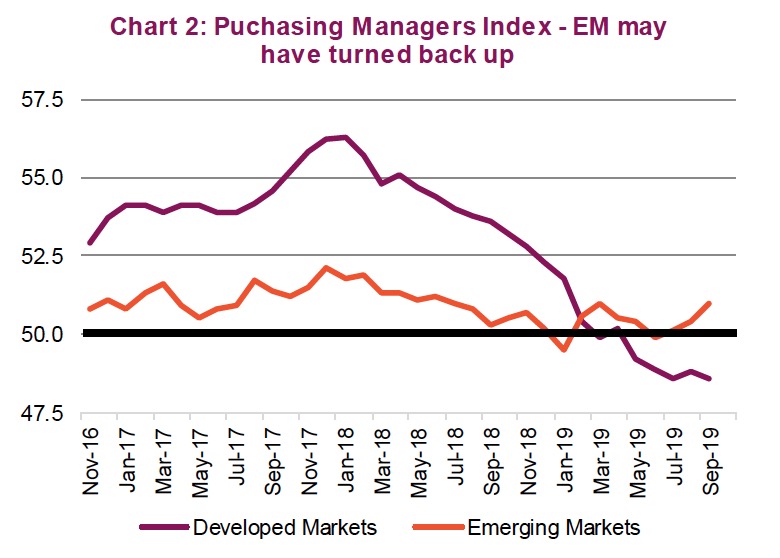
But this isn’t news. On a more newsworthy note, we will take a look at where this slowdown in global economic growth started – the epicenter if you will – which is the emerging market economies (EM). It was almost a couple of years ago when developed economies such as the U.S. and Europe were growing nicely, that cracks started to form in some of the more fragile emerging markets. At the time it was not of much concern but it continued to spread to other less fragile EMs including China. This then spread to the more trade-sensitive developed economies of Asia and Europe. And recently, this slowing was felt in the more consumer-weighted developed economies including the U.S. and the UK (although the UK has Brexit to complicate matters). While the pace of global growth continues to slow, there are some encouraging signs now coming out of EM...where it all began.
Purchasing Managers Indices (PMIs) have turned up in emerging markets (Chart 2). This survey provide insight into manufacturing activity. Given this was ground zero of the slowdown, signs of improving data are certainly encouraging. We have also seen some improvement in some developed PMI data points, to a lesser degree.
Of course, the big wild card is still the temperature of the Sino-U.S. trade war. But we would not even attempt to prognosticate the weekly or even daily machinations of the trade talks, other than to say that the situation can clearly deteriorate with a few tweets or improve just as quickly. Worth noting is the fact that U.S. employment and income levels have dropped disproportionately in many swing states, many of which have been negatively impacted by the trade war. These are the rust belt and agriculturally sensitive states. If Trump wants a second term, he will have to win many of these states again as he did in 2016. But with personal income down, it’s a safe bet that voters are unhappy. While a trade resolution seems a distant goal, reduced tensions could help voters in these states, motivating the White House to dial things back. Meanwhile, amid slowing growth, China would also likely be keen to reduce tensions.
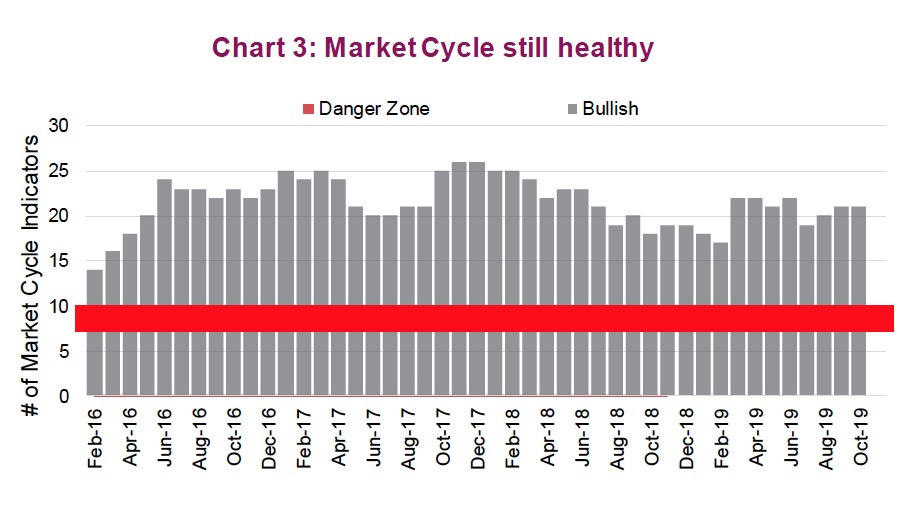
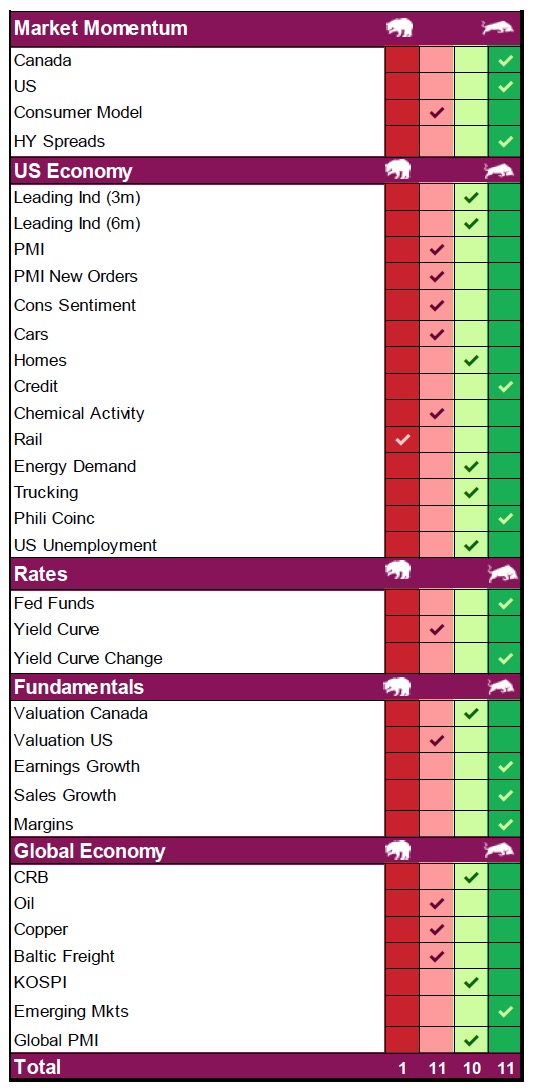
Although we’re not popping the champagne, we are further encouraged by our Market Cycle framework. This multi-discplined model tracks 33 economic, momentum, technical, sentiment and market indicators that have historically shown an efficacy in pointing to key market inflection points. Currently, 21 are positive, roughly inline with October and up from the previous few months. Typically, when the model is this healthy, there is a limited probability that the bullish cycle is going to end imminently.
While 21 bullish signals may not look like an improvement, beneath the surface there has been a notable change. Market Momentum, U.S. Economy, Rates and Fundamental signals remained relatively stable but there was an improvement in the Global Economic data. In October, the Global Economic indicators had two firmly in the bearish camp, three mildly bearish, one mildly bullish and only one strongly bullish. Today, there are no strong bearish signals. Instead, three remain mildly bearish, three are mildly bullish and one is strongly bullish. This is certainly an improvement on the global side of things.
This leaves us feeling mildly more optimistic for global economic growth. Of course central banks around the world are helping. We have seen roughly half cut rates in the past few months providing monetary support for asset prices. If global growth improves, this would likely benefit the more trade-senstive markets, such as Europe, Asia and Canada. Given more attractive valuations in those markets and an S&P 500 that is trading at new highs, the time may be at hand to start fading what has been one of the most popular trades of the past decade.
III. Becoming more sanguine on the U.S. market, moving to a neutral weight
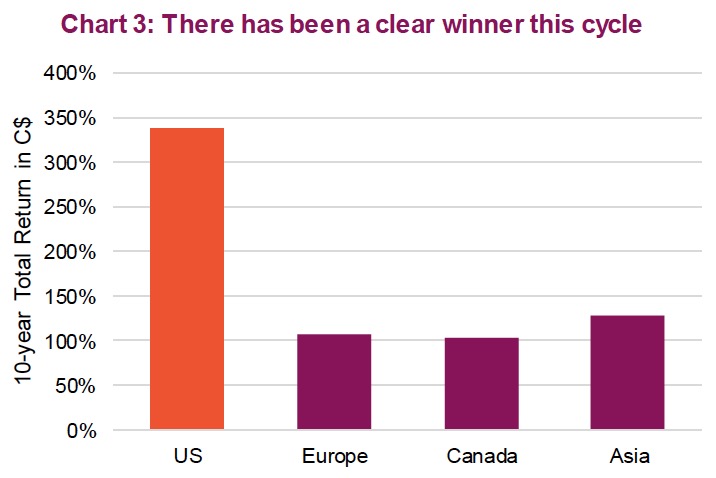
It is hard not to love U.S. equities; they’ve been the best-performing major geography over the past decade, and by a wide margin (see Chart 3). A large component of that outperformance is admittedly attributable to the price appreciation; however, a weakening Canadian dollar compared to the U.S. dollar has certainly provided an added lift. But if you have ever read an investment prospectus or disclaimer, you’re sure to be familiar with the adage that past performance is not indicative of future results. It’s future returns that matter for growing wealth, not historical.
This relative outperformance has persisted so far in 2019 as well. But it is worth noting that the majority of gains this year in the S&P 500 have not come from the dependable dividends or earnings growth; it has come from the expansion of multiples. The market multiple, or price-to-earnings ratio (PE), is the amount investors are willing to pay for a dollar of U.S. corporate earnings. This has expanded from 14.5x at the start of 2019 to 17.4x today, based on consensus 12-month earnings forecasts. The 23.2% advance of the S&P 500 this year can be broken down into +1.0% from dividends, +1.4% from earnings growth and a whopping +20.7% from a higher PE ratio. In other words, about 90% of the market’s gain has come from multiple expansion. This has made the U.S. equity market rather expensive, especially when compared to other international developed markets.
The U.S. market is priced near perfection which can be dangerous if any surprises occur. The incumbent president is fending off an impeachment as he prepares for what should be a fiercely combative electoral battleground. And depending on which Democrat wins the party’s nomination, there could be some big risks to key sectors that carry healthy weights in the index. This would include Technology, Financials and Health Care. U.S. economic data has been comparatively more positive, but if global growth shows some stabilization or improvement, investors would likely pivot from the safety of the U.S. market to those that are more sensitve to global trade.
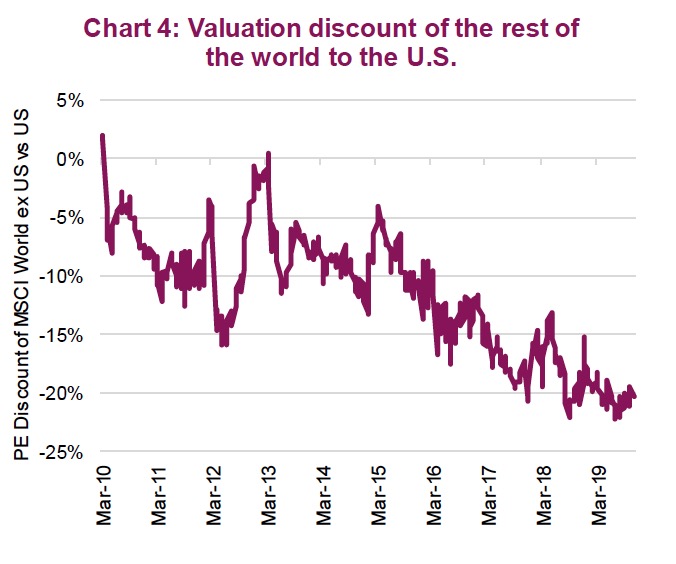
Monetary easing has been the trend for most central banks over the past few months. This should start to lift global growth and again, while that is good for all markets, it is better for those outside the U.S. Add to this relative valuations, which currently have global equities trading at a 20% discount to the U.S., there is a good margin of safety.
Lastly, we turn our attention to U.S. currency movements. We have become increasingly cautious on the U.S. dollar and even hedged part of our position in our North American equity fund. Based on purchasing power parity, the dollar is overvalued relative to most other currencies. Like equity markets themselves, the dollar can remain overvalued for an extended period, but it appears that the easy money has been made. Furthermore, if we see growth return and confidence improve, risk-on behaviour should boon alongside international currencies – loonie included.
IV. Gold
While we are positive on the markets in the near term, given the age of the current market cycle we certainly have an eye on adding defense. For many investors, one issue is that with bond yields so low and many defensive sectors trading at a big premium, becoming defensive has become more challenging. We believe gold exposure continues to offer decent value and a good defensive vehicle in conjunction with traditional bonds and other defensive holdings.
Gold possesses a unique set of defensive characteristics, which shine when uncertainty rises in the market. It has had a fantastic run this year, with bullion up 17% and miners up 34%. The recent pull-back has provided perhaps another opportunity to get in on what may very well be a multi-year run. After a short rest, the gold bull appears poised to take its next step higher. Technically, both physical gold and stocks appear ready to break out of its narrowing range, if history is a guide. From an inflation-adjusted perspective, gold prices still have some way to run before they reach 2011 levels (Chart 5).
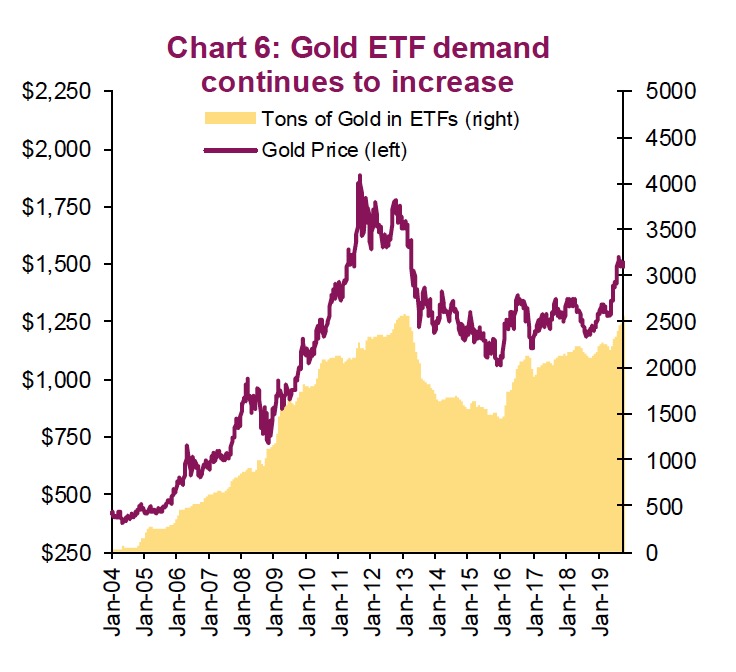
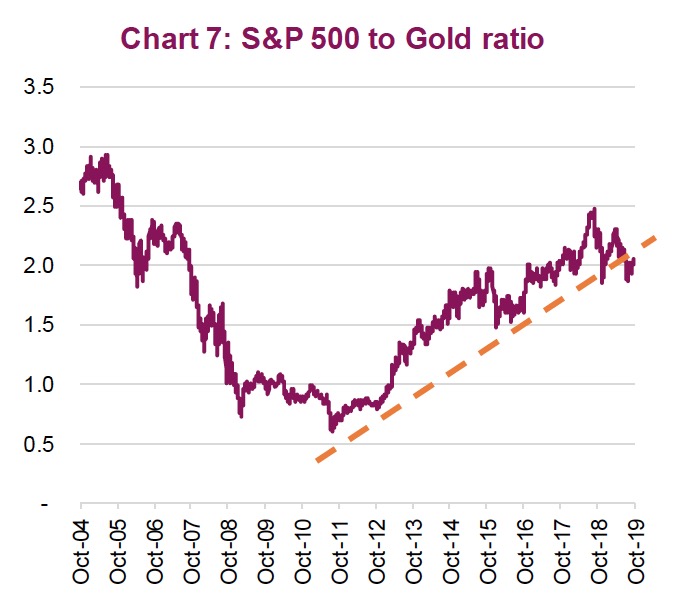
There are a number of reasons why we believe gold’s recent positive performance is not an aberration, including our cooling on the U.S. dollar. Weakness in the U.S. dollar, which is historically expensive versus most major currencies, would be a positive for gold prices. Gold is a real asset quoted in U.S. dollars, so a weaker dollar equals a higher gold price. Secondly, total known exchange-traded holdings of the metal have steadily risen (Chart 6). We believe the rise in popularity of crypto currencies in the past few years siphoned off some of the gold bugs. Now that cryptos have crashed back down, we think many are coming back to the yellow metal. Thirdly, central bank demand – particularly on an international basis – remains robust. Since bottoming in 2011, stocks have outperformed gold. You can see this trend in Chart 7, which is a simple ratio of the S&P 500 versus the price of gold. The rising trendline has broken after topping last year, which would suggest a new lower trend is now in place. (Chart 7).
The supply side of the equation is equally important. The gold industry already had their boom in the 1970s and 1980s. Abundant capital poured into the industry, new mines were discovered, and global production ramped up; but now production growth is slowing as these older mines are gradually depleting. The business of exploring for gold has also become much more difficult compared to the 80s amid stiffer environmental regulations, and safety and labour concerns. Above-ground supply of gold has changed little over time, and new discoveries have been lacking as have miners’ reserves. Presently, it’s a very profitable period for gold miners with gold prices trading above $1500/oz – this is well above the all-in sustaining costs for most miners.
Central banks have also been increasing the amount of gold in their portfolios. The motivations vary but one trend appears to be the desire to better diversify their reserves. We continue to believe gold exposure is a solid defensive diversifier, especially given such a low-yield environment. We’ve maintained a small amount of exposure within our Managed Portfolio asset allocation service and a decent overweight in our flagship North American dividend equity strategy.
V. Portfolio positioning
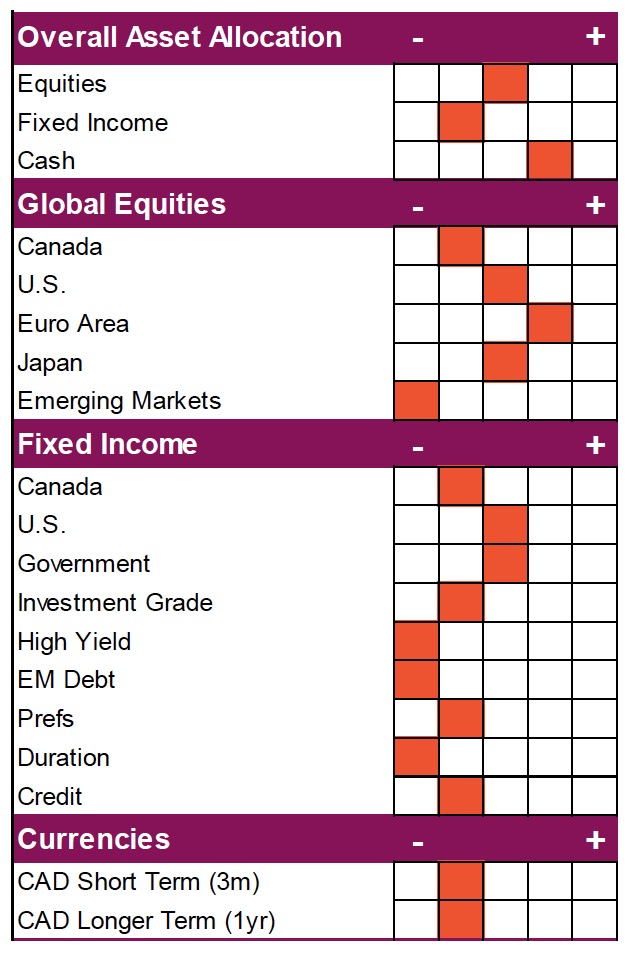
Motivated by some improving signs on the global economic front and relative valuations, we are trimming our overweight in U.S. equities and adding the proceeds to international developed markets. The U.S. has been the juggernaut this cycle and is clearly the leading market. However, if the trend in global growth improves in the coming quarters as we expect, international markets that are cheaper, more beaten up and have a greater sensitivity to global trade should benefit more. This move does not change our current asset allocation, which is roughly market weight equities, but does tilt our portfolio to be more internationally focused.
With Market Cycle indicators appearing healthy, we believe this cycle still has room to continue. Central banks have pivoted to a more accomodative position, which is encouraging, and the U.S. consumer remains healthy. We would temper these bullish statements with the backdrop of a global manufacturing slowdown and less confident corporations. We believe the next move will be some signs of improvement on the manufacturing side….but time will tell. There are always areas of concern, otherwise investing would be easy. Currently we believe the trend is improving, not deteriorating.
Charts are sourced to Bloomberg L.P. unless otherwise noted
This publication is intended to provide general information and is not to be construed as an offer or solicitation for the sale or purchase of any securities. Past performance of securities is no guarantee of future results. While effort has been made to compile this publication from sources believed to be reliable at the time of publishing, no representation or warranty, express or implied, is made as to this publication’s accuracy or completeness. The opinions, estimates and projections in this publication may change at any time based on market and other conditions, and are provided in good faith but without legal responsibility. This publication does not have regard to the circumstances or needs of any specific person who may read it and should not be considered specific financial or tax advice. Before acting on any of the information in this publication, please consult your financial advisor. Richardson GMP Limited is not liable for any errors or omissions contained in this publication, or for any loss or damage arising from any use or reliance on it. Richardson GMP Limited may as agent buy and sell securities mentioned in this publication, including options, futures or other derivative instruments based on them.
Richardson GMP Limited is a member of Canadian Investor Protection Fund. Richardson is a trademark of James Richardson & Sons, Limited. GMP is a registered trademark of GMP Securities L.P. Both used under license by Richardson GMP Limited.
RichardsonGMP © Copyright
November 4, 2019. All rights reserved.


