
by Liz Ann Sonders, Senior Vice President, Chief Investment Strategist, Charles Schwab & Co
U.S. stocks have made limited headway over the past 20 months, with the S&P 500® index up around 4% from its January 2018 high.1 Most of the choppiness has been tied to trade-related news, although concerns about Fed policy and the flattening and at times inverted Treasury yield curve have come into play, as well.
One of the lessons that should come from observing what has been happening is that trying to trade around headlines is a potentially treacherous exercise. With so much daily noise, we continue to recommend a disciplined strategy around diversification and rebalancing.
Tied to that has been our sector strategy, which has been fairly “neutral” over the past year, having only one outperform rating (Health Care) and only one underperform rating (Communication Services). The remaining nine sectors have marketperform ratings.
Frankly, what has “worked” well over the past year or so has been factors over sectors. For those who are unfamiliar with factor investing, it’s an investment approach that focuses on stock characteristics, such as size, price momentum, value, volatility and other potential factors. Over the past year or so, stocks with low volatility and strong price momentum have consistently led the pack, while traditional and relative value factors have lagged the most.
However, as overall market volatility declined at the beginning of September, both value factors and more-cyclical sectors rebounded, along with higher-volatility stocks. This was an interesting reversal of a trend, but for now it was short-lived, lasting only a week or so. Last week saw a return to the factors that had dominated the year-to-date performance up to September. Any additional rotation would bear watching to see whether factors become as volatile as sectors, and/or whether a more-cyclical leadership trend portends a better economic outlook.
Sector performance has been choppy, too
Highlighting the volatility of sectors and the rationale for a relatively neutral overall recommendation, we put together a handy “quilt chart” showing the movement of the S&P 500’s 11 sectors on a month-to-month basis over the past year. Similar to quilt charts that show asset classes on a year-to-year basis, this version highlights the difficulty of trading sectors in the short term: The monthly fluctuations have been all over the place.
Sector leadership has been volatile on a month-to-month basis
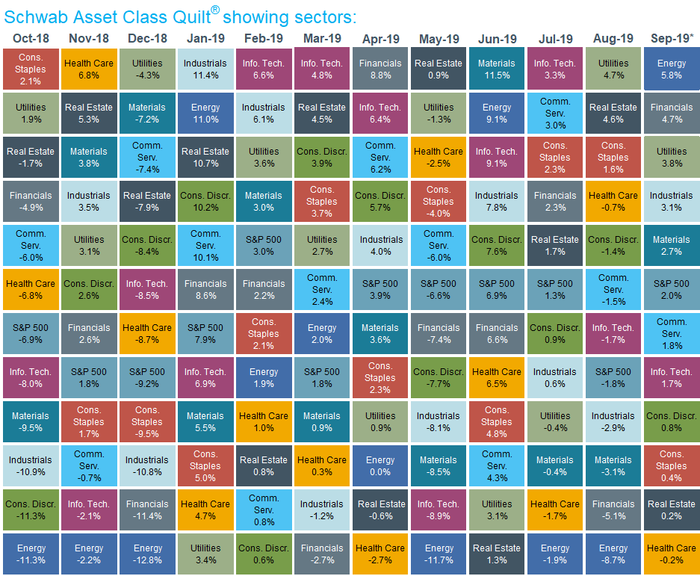
Source: Charles Schwab, Bloomberg, as of 9/25/2019. Sector performance is represented by price returns of the following 11 GICS sector indices: Communication Services, Consumer Discretionary, Consumer Staples, Energy, Financials, Health Care, Industrials, Information Technology, Materials, Real Estate, and Utilities. Returns of the broad market are represented by the S&P 500® index. Past performance is no guarantee of future results. For illustrative purposes only.
What investors can consider now
It continues to be a difficult environment in which to trade around short-term news, even if short-term news is having an outsized impact on day-to-day and month-to-month market behavior. As I often say, investing should always be a process over time; never about a moment in time. There are no free lunches in the business of investing; but sticking to the tried-and-true disciplines around diversification and periodic rebalancing is as close as it gets.
1 Source: S&P Dow Jones Indices. The S&P 500 closed at 2872.87 on 1/26/2018, and at 2,984.87 on 9/25/2019.
| Sector | Schwab Sector View | Date of last change to Schwab Sector View | Share of the S&P 500® Index |
Year-to-date total return as of 09/24/2019 |
|---|---|---|---|---|
| Communication Services | Underperform | 09/28/2018 | 10.5% | 22.1% |
| Consumer Discretionary | Marketperform | 07/17/2014 | 10.2% | 21.4% |
| Consumer Staples | Marketperform | 05/07/2015 | 7.6% | 21.9% |
| Energy | Marketperform | 11/20/2014 | 4.4% | 8.0% |
| Financials | Marketperform | 08/16/2018 | 12.8% | 19.0% |
| Health Care | Outperform | 01/26/2017 | 13.9% | 6.3% |
| Industrials | Marketperform | 01/29/2015 | 9.2% | 21.8% |
| Information Technology | Marketperform | 08/16/2018 | 22.1% | 30.0% |
| Materials | Marketperform | 01/31/2013 | 2.7% | 16.1% |
| Real Estate | Marketperform | 08/16/2018 | 3.3% | 29.2% |
| Utilities | Marketperform | 08/16/2018 | 3.5% | 25.2% |
| S&P 500 index | 20.1% |
Source: Schwab Center for Financial Research, FactSet (for YTD total returns) and S&P Dow Jones Indices (for S&P 500 sector weightings). Sector performance data is based on total return for each S&P 500 sector subindex (see “Important Disclosures” for index definitions). Sector weighting data is as of 08/30/2019; data is rounded to the nearest tenth of a percent, so the aggregate weights for the index may not equal 100%.