by Scott Brown, Ph. D., Chief Economist, Raymond James
Chief Economist Scott Brown discusses current economic conditions.
The Federal Open Market Committee will meet this week to set monetary policy. It’s widely expected that the FOMC will lower the federal funds target range by another 25 basis points, although that’s not a done deal. We know from the FOMC minutes that officials were divided in late July: “several participants favored maintaining the same target range,” while “a couple of participants indicated that they would have preferred a 50 basis point cut.” Given the mixed nature of recent economic data reports, those divisions may now be even more pronounced. The recent softening in trade tensions and efforts to spur growth abroad have reduced the amount of fear in the financial markets – it was these kind of developments that had calmed the Fed’s concerns in the spring. However, part of the market’s reduced anxiety has been due to expectations of further Fed easing.
First, let’s review what goes on at the FOMC meeting. All senior Fed officials are “participants.” That includes the five members of the Fed’s Board of Governors (there are two vacancies) and the presidents of the 12 Fed district banks. However, only FOMC members vote on monetary policy. The FOMC is made up of the governors, the New York Fed president, and four of the other district bank presidents (who rotate on and off each year). By construction, the governors and the New York Fed president will dominate. However, while views can differ and there will be some debate, the committee tries to build a consensus on its policy decision. Formal dissention is not unusual. One official voted against keeping rates steady in June and two voted against cutting rates in July.
It’s rare that we go into an FOMC without a clear expectation of the outcome. The FOMC does not like to surprise the financial markets. Late Friday, the federal funds futures market was pricing in an 80% chance of a 25-basis-point cut on September 18 (a 20% chance of no move) – not the sure thing it appeared to be a couple of weeks ago. Prior to the FOMC meeting, the New York Fed surveys primary dealers and other financial institutions. In the questionnaire, these firms are asked about their expectations for what the Fed will do, the wording of policy statement, and what Chair Powell will say in his press conference. These survey results may have some influence on what the Fed will do. The results will be made public concurrent with the release of the FOMC minutes.
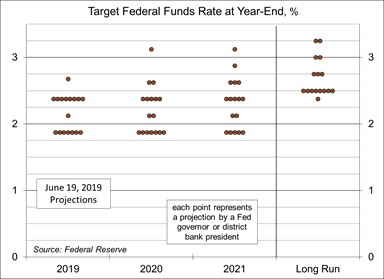
As with every other FOMC meeting, officials will revise their projection of growth, unemployment, and inflation. Each September, the forecast horizon is extended a year, this time to 2020. The Fed’s Summary of Economic Projection will include a revised dot plot (which shows Fed officials’ expectations of the appropriate year-end federal funds target rate). Fed officials have been divided on whether to get rid of the dot plot. Some see it as falsely signaling a commitment to a specific path (the markets have reacted to relatively minor changes in the median of the dots). Others, including Chair Powell, see the dot plot as a useful communications tool (one that just needs to be explained more clearly). Investors would be wise to focus on the dispersion of the dots, which reflects divisions among Fed officials. The June dot plot illustrated the split among Fed officials (bear in mind that not all of the dots vote on policy and there is considerable uncertainty surrounding each dot).
In his July 31 press conference, Chair Powell said that the rate cut was “intended to insure against downside risks from weak global growth and trade policy uncertainty; to help offset the effects these factors are currently having on the economy; and to promote a faster return of inflation to our symmetric 2% objective.” Trade policy remains uncertain, but tensions were taken down slightly last week. The ECB eased policy, not by a lot, but we should see further efforts to support growth outside the U.S. A tight job market appears to be boosting wage pressures. Core inflation, as measured by the CPI, is moving up, and we should see that echoed in the PCE Price Index, the Fed’s chief inflation gauge.
Possible arguments for standing pat: a (mild) decrease in trade tensions; an economy at (or beyond) full employment; tighter job conditions; wage pressures; core inflation moving up; a healthy trend in consumer spending; efforts to spur growth abroad; and reduced fear in the financial markets.
Possible arguments for a rate cut: trade policy likely to dampen growth, slower trend in job growth, manufacturing weakness; a limited ability of firms to pass higher costs along; risks to the growth outlook still weighted to the downside; and the market expects the Fed to cut.
Last week, President Trump tweeted that “the Federal Reserve should get our interest rates down to ZERO, or less, and we should then start to refinance our debt.” No economist believes that the Fed should be moving to an emergency level of interest rates, and that’s not how government debt works. Trump referred to Fed officials as “boneheads.” As usual, the Fed will tune out political noise in making its policy decision. The FOMC will not acquiesce to outside calls for easier policy, nor would it keep rates steady just to spite the president.
Data Recap – Retail sales moderated in August and core consumer price inflation was a bit higher than expected, but trade tensions lessened somewhat, reducing fear and lifting bond yields.
President Trump delayed by two weeks Tariff Increases that were set to be imposed on October 1 (a 5% increase, from 25% to 30%, on $250 billion of Chinese imports) as “a gesture of goodwill.” This led to speculation that the administration was seeking a mini-deal (not a full resolution of trade tensions) to reduce the impact of the trade war on the U.S. economy. China said it would reduce tariffs on U.S. pork and soybeans.
The European Central Bank lowered the rate on the deposit facility by 10 basis points, to -0.50% and restarted its asset purchase program. It also refined its forward guidance on low rates, moving from a time frame (through the first half of 2020) to an economic condition (until inflation closes in on the 2% goal).
Treasury reported a $200.3 billion Budget Deficit for August, bringing the total for the first 11 months of FY19 to $1.067 trillion. September is a surplus month (+$119.1 billion in September 2018), so there’s a good chance that the full FY total will be under $1 trillion (but still very large). Through the first 11 months of FY19, tax receipts were up 3.4% y/y, while outlays were up 7.0%.
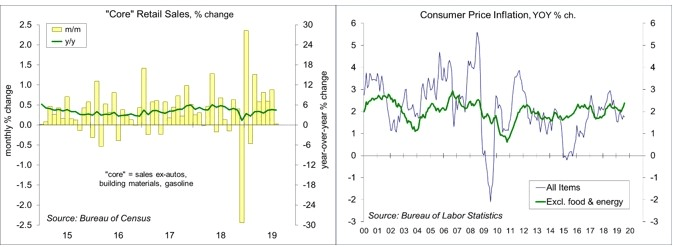
Retail Sales rose 0.4% in the initial estimate for August (+4.1% y/y), led by a 1.8% rise in motor vehicle sales (+6.8% y/y) and a 1.4% gain in sales of building materials and garden supplies (+1.0% y/y). Gasoline sales fell 0.9% (-2.3% y/y), reflecting lower prices. Ex-autos, building materials, and gasoline, sales were flat (+4.5%), following a 2.3% rise over the three previous months.
The Consumer Price Index rose 0.1% in August (+1.7% y/y), held down by a 3.5% drop in gasoline prices (-7.1% y/y). Food prices were flat (+1.7% y/y), still split between food at home (-0.2% m/m, +0.5% y/y) and food away from home (+0.2% m/m, +3.2% y/y). Ex-food & energy, the CPI rose 0.3% (+0.256% before rounding, +2.4% y/y).
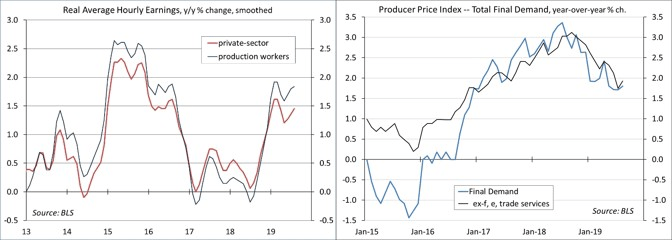
Real Hourly Earnings rose 0.4% in August (+1.5% y/y), also up 0.4% for production workers (+1.8% y/y).
The Producer Price Index rose 0.1% in August (+1.8% y/y), held down by a 6.6% drop in wholesale gasoline prices (-12.9% y/y). Food fell 0.6% (+2.4% y/y). Ex-food, energy and trade services, the PPI rose 0.4% (+1.9% y/y). Pipeline inflation pressures were mixed, but generally mild. Ex-food & energy, unprocessed intermediate goods fell 3.7% y/y, with processed intermediate goods down 1.6% y/y.
Import Prices fell 0.5% in August (-2.0% y/y), led by a 4.8% drop in petroleum prices (-9.6% y/y). Ex-food & fuels, import prices were unchanged (-1.1% y/y). Prices of imported capital goods were unchanged (-1.1% y/y). Prices of imported autos and parts edged up 0.1% (-0.5% y/y). Prices of imported consumer goods ex-autos rose 0.1% (-0.4% y/y). These figures do not include tariffs.
The University of Michigan’s Consumer Sentiment Index rose to 92.0 in mid-September, vs. 89.8 in August and 98.4 in July. The bounce partly reflected expectations of a Fed interest rate cut, and was concentrated among consumers under age 45 and among households with income in the top third (these two categories account for half of all spending).
Jobless Claims fell to 204,000 in the most recent week, but figures are subject to distortions due to the Labor Day holiday. At 212,250, the four- week average remains very low, consistent with tighter labor market conditions.
The Index of Small Business Optimism slipped to 103.1 in August, vs. 104.7 in July and 103.3 in June.
*****
The opinions offered by Dr. Brown should be considered a part of your overall decision-making process. For more information about this report – to discuss how this outlook may affect your personal situation and/or to learn how this insight may be incorporated into your investment strategy – please contact your financial advisor or use the convenient Office Locator to find our office(s) nearest you today.
All expressions of opinion reflect the judgment of the Research Department of Raymond James & Associates (RJA) at this date and are subject to change. Information has been obtained from sources considered reliable, but we do not guarantee that the foregoing report is accurate or complete. Other departments of RJA may have information which is not available to the Research Department about companies mentioned in this report. RJA or its affiliates may execute transactions in the securities mentioned in this report which may not be consistent with the report's conclusions. RJA may perform investment banking or other services for, or solicit investment banking business from, any company mentioned in this report. For institutional clients of the European Economic Area (EEA): This document (and any attachments or exhibits hereto) is intended only for EEA Institutional Clients or others to whom it may lawfully be submitted. There is no assurance that any of the trends mentioned will continue in the future. Past performance is not indicative of future results.
Copyright © Raymond James


