by Craig Basinger, Chris Kerlow, Derek Benedet, Alexander Tjiang, Gerald Cheng, RichardsonGMP
Looks like the rally is back on – last week markets surged to within a few percent of all-time highs. A turbulent August has led to what seems like a back-to-school rally. We don’t know if markets will make new highs, how high they could go, or even if the planned trade meeting between China and the U.S. in October will solve all of the world’s woes (it won’t). What we do know is that the fall period tends to be one with elevated volatility and, if you believe in the seasonality of equity markets, this is the time of year to be a tad more cautious.
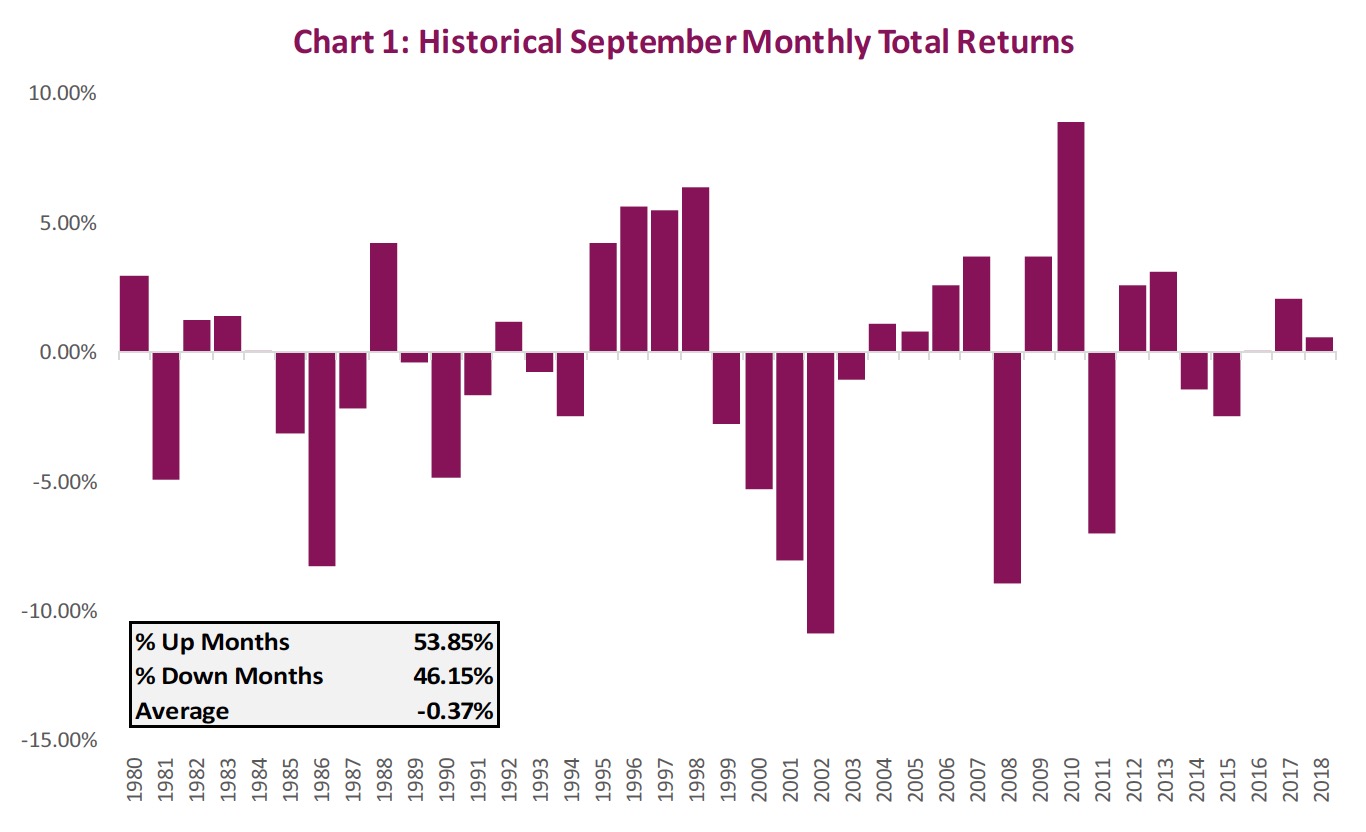
September has a reputation as a volatile month. Looking back to 1980, September produced an average loss of 0.37%, and was positive 54% of the time. Yes, history has not been kind to September but, as the chart below illustrates, there’s more to these numbers. The chart, which plots the return for each September from 1980 to 2018, shows the average is negative; but averages can be misleading, hiding many important details. Between some of the big drawdowns coinciding with bear markets, September has had some decent displays; however, the swings are bigger than other months, elevating volatility. Clearly, something else must be up.
 Seasonal investing and cycle analysis have been around for a long time. Humans generally have a natural inclination to find patterns (even if they are not there) and the stock market is a prime example. Time is an important consideration; it’s represented on the horizontal axis on almost every stock chart. In fact, time, price and volume are the key dimensions, alongside psychology, that determine trends in the stock market. Prices tend to move in periodic fluctuations known as cycles. These cycles can last days to decades, and at any one time there is always more than one cycle operating simultaneously.
Stocks don’t care what month it is, but the investment industry follows a calendar that is influenced by habitual human and cultural behavior. Events such as tax deadlines, holidays, options and futures contract expirations, the opening and closing bell, index changes, earnings, elections, earnings seasons and tax-loss selling all have an influence on traders and investors.
Markets, sectors and individual stocks have all shown a tendency to post annual highs and lows around the same time every year. This cycle is known generally as market seasonality. By far the most popular and perhaps oversimplified seasonal trade is the one behind one of the most overused market adages, “sell in May and go away”. On average, stocks rise in the spring and are weak in the summer and early fall, only to witness a year-end rally that usually extends into January. In most years the November-to-January period tends to be the best three-month holding period for the market. It’s a simple premise, but not so easy to follow. The goal is to find anomalies to try to outperform either by taking part in or avoiding a repeat event. The problem is that sometimes it works, and sometimes it doesn’t. Let’s examine how this approach would have performed this year.
Sell in May and go away?
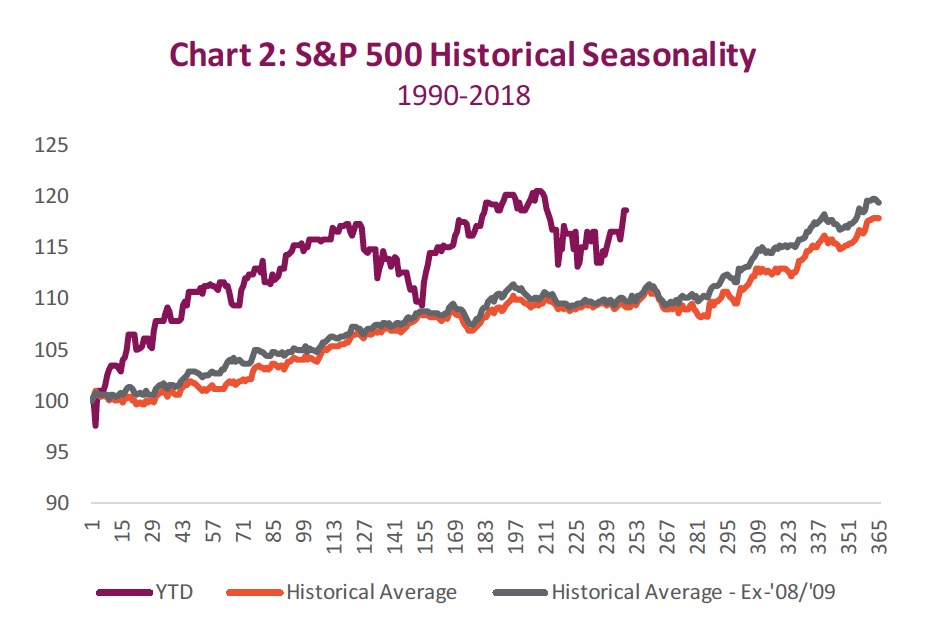
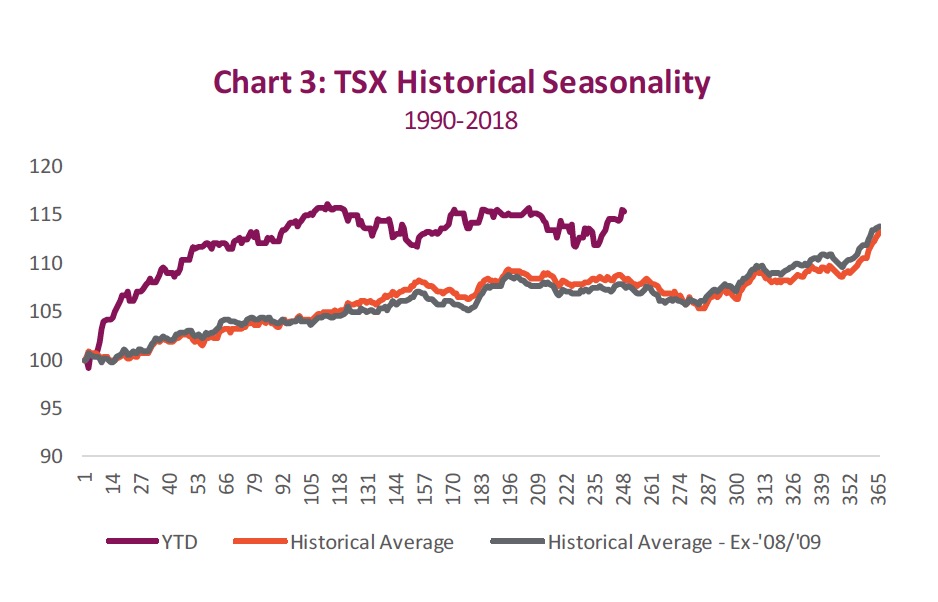
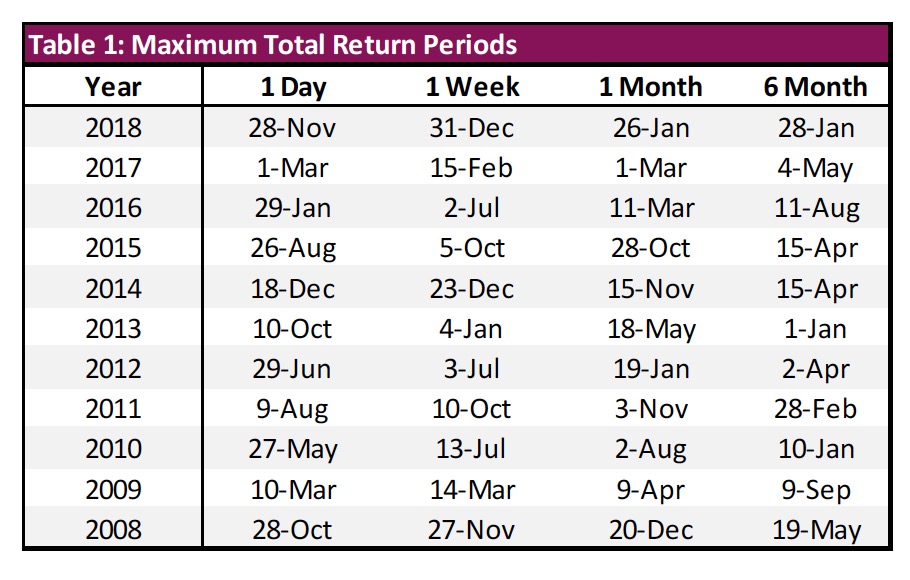
Charts 2 and 3 show both the S&P 500 and S&P/TSX Composite performance year to date compared to the average yearly performance going back to 1990. Not surprisingly, 2019 has been above average in terms of returns, but it should be taken in context considering the sell-off last December. Since the end of April, the S&P 500 is up 1.93% and the S&P/TSX Composite is up 0.89% – not great but at least not negative. However, if you had sold and bought all bonds, you would be better off. The FTSE TMX Universe Bond Index is up over 4% over that same time period. Maybe the classic rhyme has a point. The month isn’t over and one good week doesn’t guarantee a great month. Based on our historical analysis, the market isn’t quite out of the seasonal weakness. But the good news is that the best seasonal buying opportunity is not far off the horizon. Or is it? Individual time horizons also play an important part in determining when it’s a good time to buy. Table 1 shows the best day in each calendar year to invest in the S&P 500 based on your time horizon. (1 day to 6 months) Can you spot any seasonal trends? We didn’t’ think so.
Portfolio implications
While there are cyclical influences on stocks, it’s important to remember that the market is never the same as it was in the past; it differs because of fundamental and psychological considerations. Sometimes recognizing when markets are ignoring seasonal trends can be just as important as trading them. Right now, markets are simply behaving the way they are supposed to be. Just because September is off to a great start, there is little reason to overthink it. We expect bouts of volatility to be a recurring event in the months to come, given the importance of central bank policy adjustments, a Canadian election, Brexit and the all-important trade war. It would seem at times that seasonality has nothing on the power of a single tweet.
Although economic cycles, political climates and public markets are constantly changing, the behaviour patterns of humans remain the same. We spend a considerable amount of time studying both the markets as well as human behaviour and humans can be foolish. Overreacting to news events and earnings, as well as behaving one way based on certain circumstances during some parts of the year and completely differently in other parts of the year. Investors it would seem are most predictable in their unpredictability.
Source: All charts are sourced to Bloomberg L.P. and Richardson GMP unless otherwise stated.
This publication is intended to provide general information and is not to be construed as an offer or solicitation for the sale or purchase of any securities. Past performance of securities is no guarantee of future results. While effort has been made to compile this publication from sources believed to be reliable at the time of publishing, no representation or warranty, express or implied, is made as to this publication’s accuracy or completeness. The opinions, estimates and projections in this publication may change at any time based on market and other conditions, and are provided in good faith but without legal responsibility. This publication does not have regard to the circumstances or needs of any specific person who may read it and should not be considered specific financial or tax advice. Before acting on any of the information in this publication, please consult your financial advisor. Richardson GMP Limited is not liable for any errors or omissions contained in this publication, or for any loss or damage arising from any use or reliance on it. Richardson GMP Limited may as agent buy and sell securities mentioned in this publication, including options, futures or other derivative instruments based on them. Richardson GMP Limited is a member of Canadian Investor Protection Fund. Richardson is a trademark of James Richardson & Sons, Limited. GMP is a registered trademark of GMP Securities L.P. Both used under license by Richardson GMP Limited. ©Copyright September 9, 2019. All rights reserved.
Copyright © RichardsonGMP


