


by Ben Inker, Head of Asset Allocation, GMO LLC
QUARTERLY LETTER 2Q 2019
EXECUTIVE SUMMARY
The largest companies in the U.S. have seen marked improvement in their profitability on a number of measures over the last 30 or so years, while smaller companies have seen very little change. The improvement for the largest companies is probably due to increasing
market power for these firms and a playing field that has tilted in their favor. It is my guess that the field may well be starting to tilt back away from them in a way that will hurt their profitability in the future. But the safer bet is that that process will be slow and uncertain. Given that our valuation models assume margins revert relatively quickly, we may well be a little too tough on these companies, but even giving them the full benefit of the doubt on their future profitability would still leave them looking expensive versus the rest of the world.
BIGGER’S BEEN BETTER
It’s never been better to be a giant company in the U.S., but will it stay that way?
If you will accept a little oversimplification, the last decade or so of global equity market performance can be summarized as follows. U.S. stocks have profoundly outperformed stocks in the rest of the world, whether other developed markets or emerging markets. This outperformance has been partially driven by U.S. P/E ratios expanding more than in other markets. But the largest driver of the outperformance has been the massive superiority of earnings growth in the U.S. relative to anywhere else. This superior earnings growth has been driven not so much by strong top-line growth, but by expanding profitability by U.S. companies relative to sales, gross profits, or other measures that can plausibly be used as proxies for economic capital. Unlike in past cycles, this rising profitability seems to have been neither a result of, nor a driver of, increased corporate investment. Digging a little deeper, we can see that the improvement in profitability has occurred only in the largest companies. These companies have been out-earning their smaller brethren by increasing margins over the past 25 years or so. The long period of their improvement suggests this effect is not something we should expect to correct over a single business cycle, but my guess is that the world in the future will be less favorable to these large, dominant companies than is true of the current environment. If we were to adjust the assumptions of margin reversion in our forecasts to account for a slower pace of this reversion, our forecast for
U.S. large cap stocks (as well as high quality stocks) would improve noticeably, but the adjustment would still leave them looking meaningfully worse than the other groups of equities we forecast.
For a very long time, U.S. corporate profits seemed to be an exceptionally well-behaved mean-reverting series. Exhibit 1 shows corporate profits relative to GDP in the U.S. since 1929, with dotted lines marking the average level across the 20th century and the period 2004 to 2019.
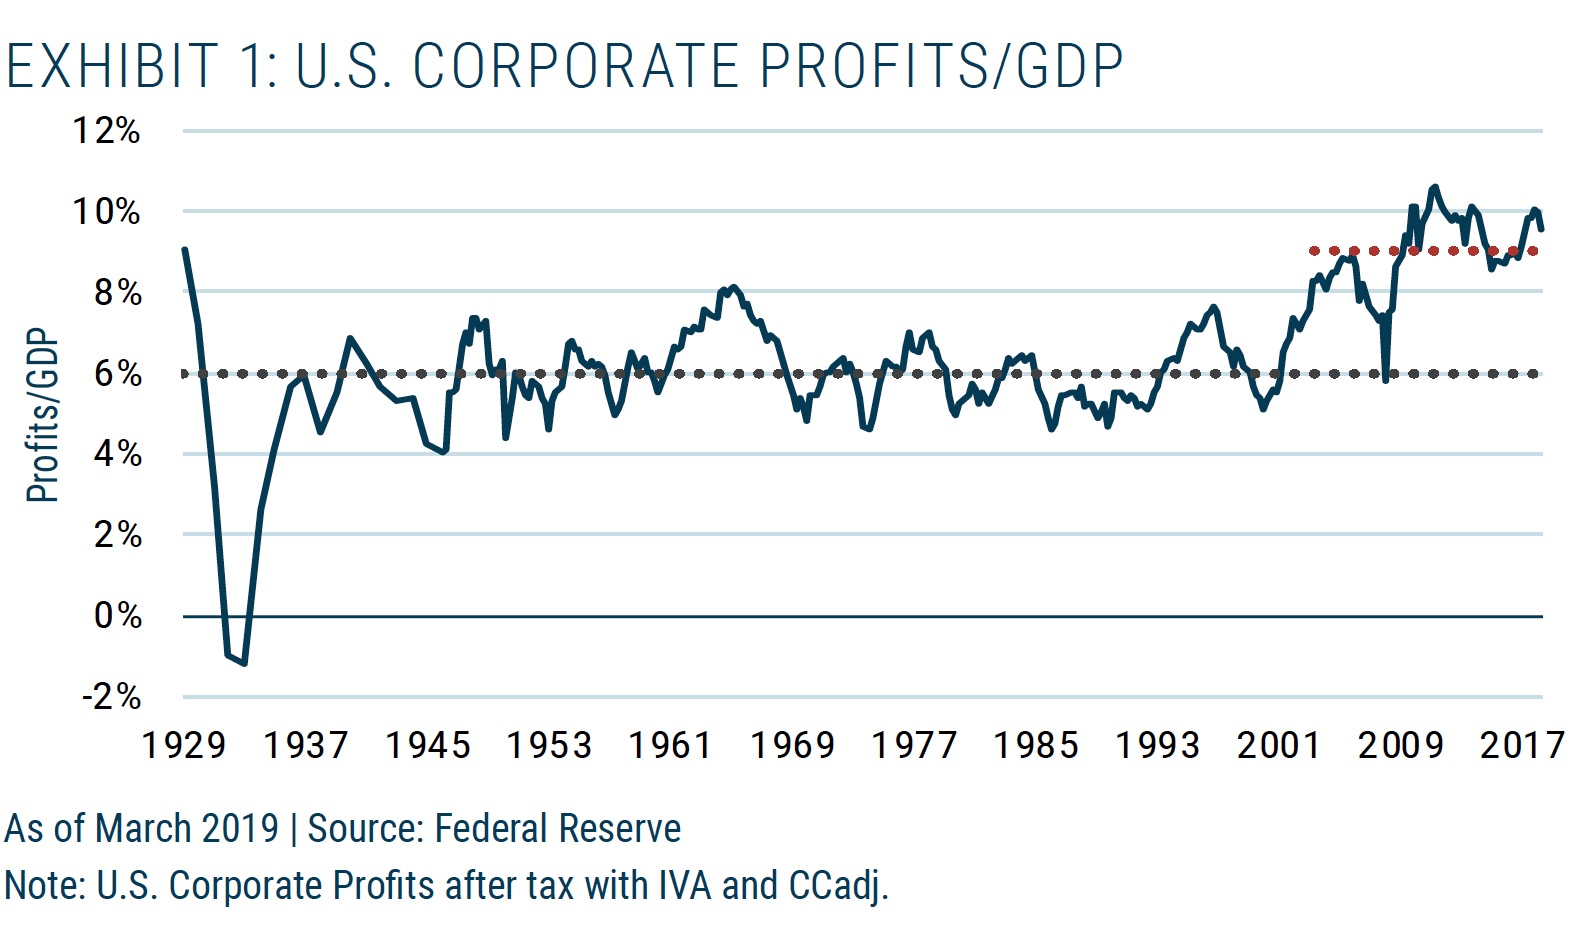
Up through the 2001 recession, this series was remarkably mean-reverting, with the expected fluctuations across the business cycle and the only outlier occurring in the depths of the Great Depression. Sometime around 2004, however, this series experienced a decided upward shift and since then has averaged 9% of GDP versus
the 6% average for the 20th century. Though it has maintained its cyclical variations, the series seems very clearly to have been varying around a different mean. This shift, as profound as it seems to have been, has not actually been that widespread among companies. Exhibit 2 shows a conceptually similar series, profits as percent of value- added for corporations.1 It isn’t exactly the same as profits/GDP, but it is available on an individual company basis.
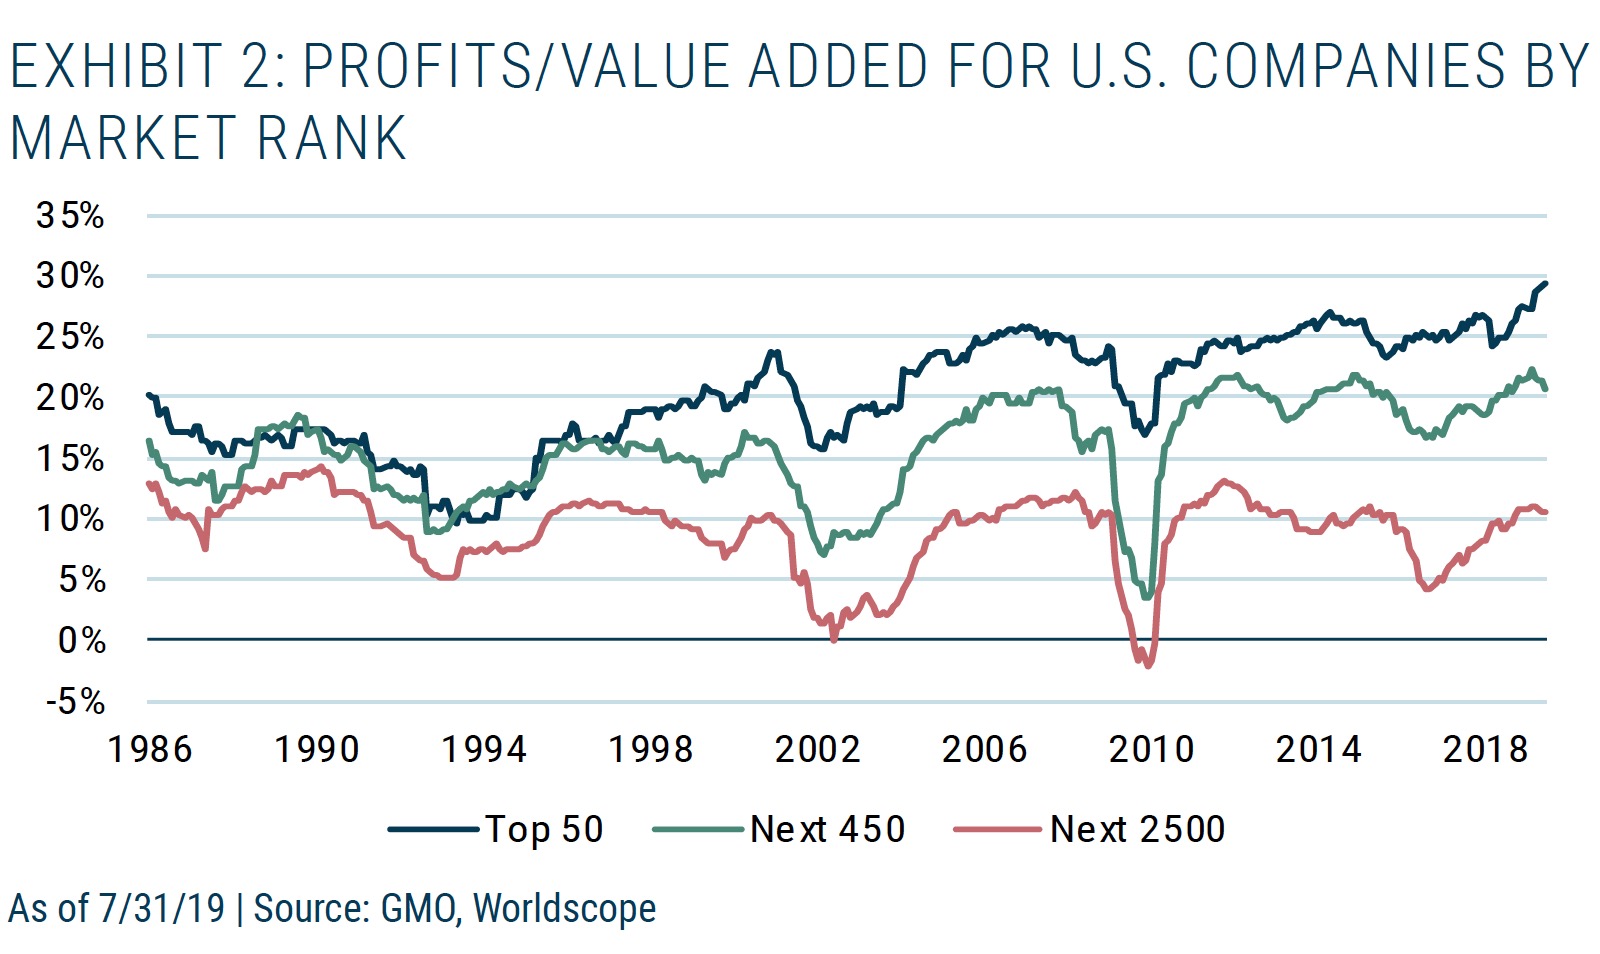
What we immediately see from Exhibit 2 is that the increase in profitability has not been at all evenly distributed. With the number of lines on the chart, however, it’s probably easier to understand the magnitudes in table form.

1 Value added for corporations is another term for gross profit – revenue less the cost of goods sold.
2 There is obviously no magic to picking the periods. These three periods have the advantage of each containing one recession, which helps keep the averages “fair.”
The shift in fortunes for different companies clearly predates the shift in overall profits. Breaking down the period into the first decade, second decade, and last 13 years shows2 that the top 50 companies really started to distance themselves from the pack by the late 1990s and today have opened a huge gap on the rest of the listed universe. Smaller companies, by contrast, have seen little or no change over the period, which leaves the large majority of public corporations in the U.S. enjoying no benefit from the greatest advance in overall corporate profitability in U.S. history!
There was another interesting change in the profit picture as this shift was taking place. The relationship between profits and investment appears to have completely broken down, as we can see in Exhibit 3.
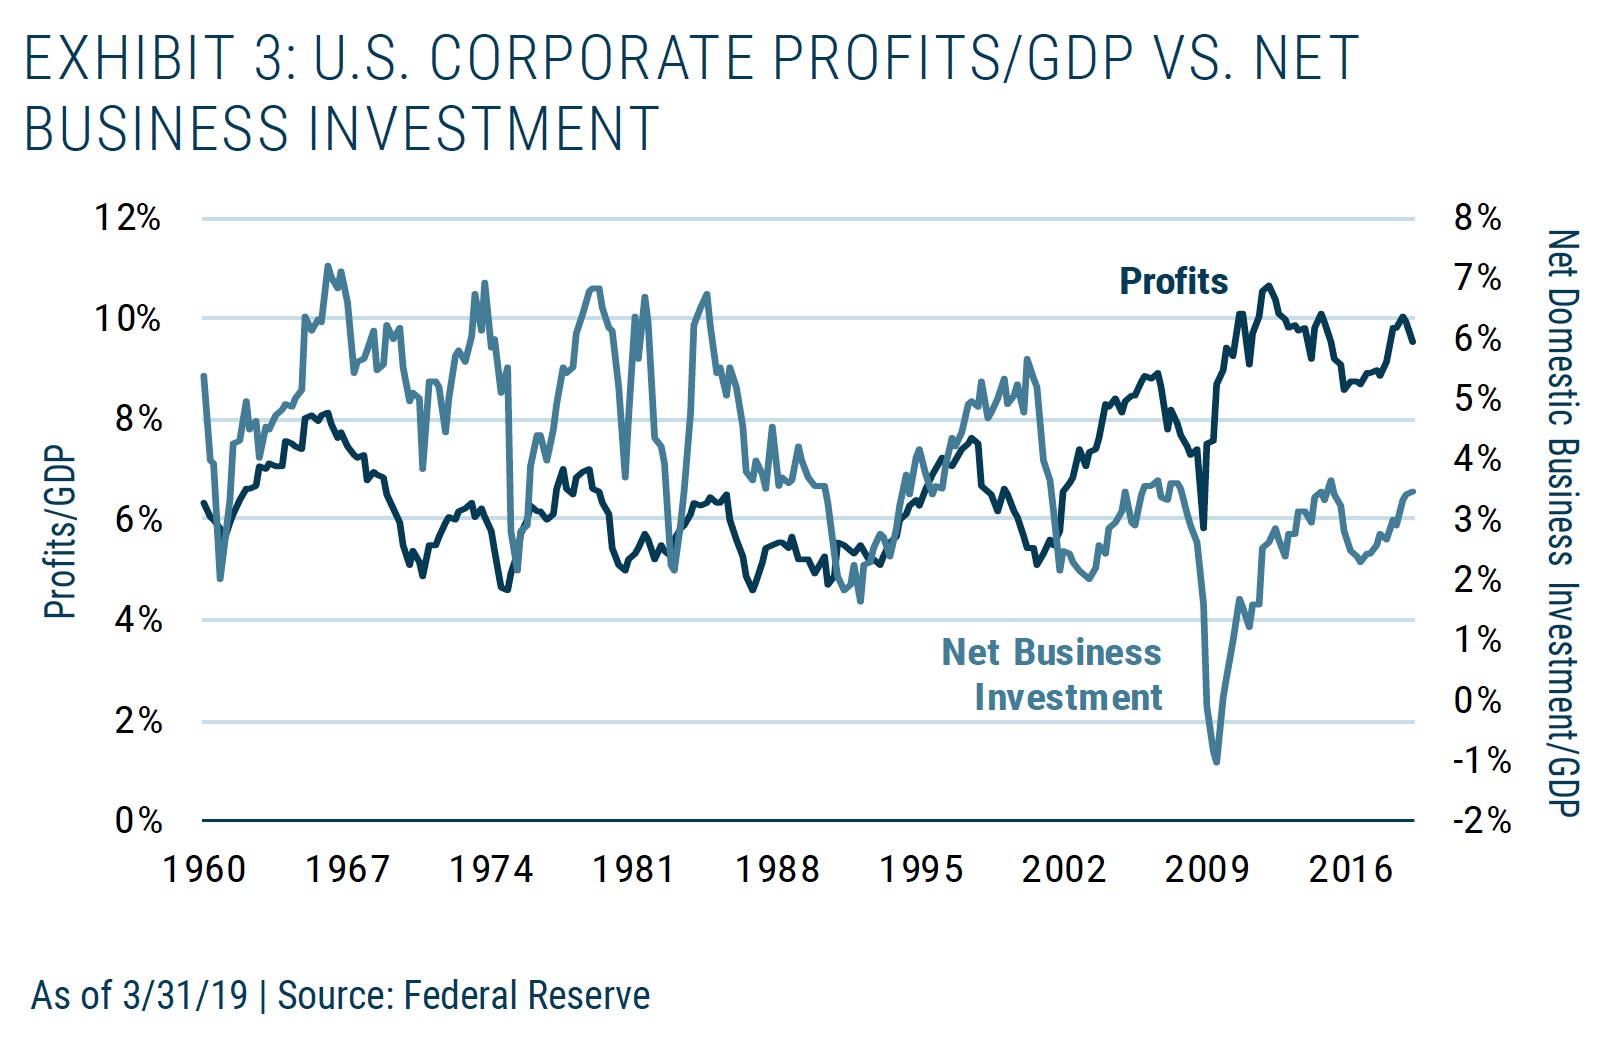
While net business investment has always been a volatile series, up until the early 2000s there used to be a meaningful relationship between profits and investment – high profits were associated with high rates of investment and low profits the opposite. The correlation between them was about 35%. But just at the time that the profit series made its lurch upward, net business investment made a lurch downward, from which it has not recovered.
On the face of it, this is extremely odd. If profitability is high, corporations should naturally respond by increasing investment. While in principle this tendency could be stopped by there being a particularly high cost of capital, it is pretty obvious this has not been the case over this period. Exhibit 4 shows the Shiller earnings yield of the S&P 500 (the inverse of the Shiller P/E). This may not be a perfect measure of the cost of equity capital for corporations, but it’s a pretty good one, and you certainly couldn’t describe the period since the early 2000s as being a high-cost environment for raising equity.

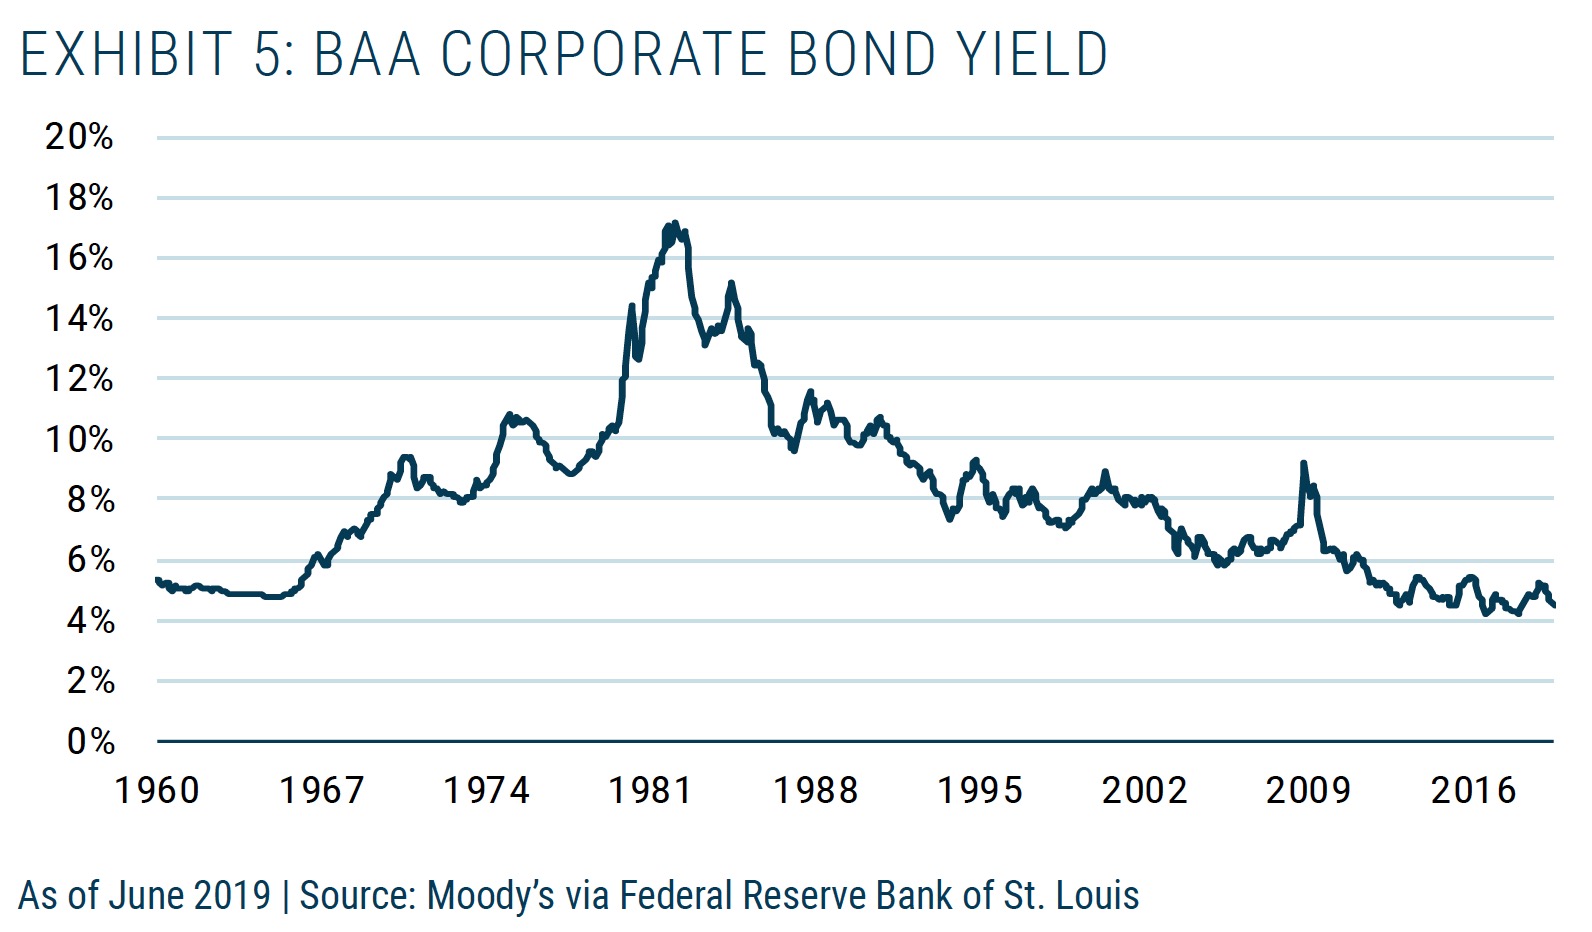
It has also not been an expensive time to raise capital through borrowing. Exhibit 5 shows the yield of Baa corporate debt, which again has been conspicuously low in this period.
...the change in corporate business models has not been matched by a change in financial accounting standards, so perhaps stated profits aren’t a good proxy for what is truly going on.
One complaint that one could reasonably make about the data I have shown is that the change in corporate business models has not been matched by a change in financial accounting standards, so perhaps stated profits aren’t a good proxy for what is truly going on. Moving from accounting income to economic profit is a tricky and inexact business, but our Global Equity team has spent several years going meticulously through corporate accounts to try to properly account for the expenses that are really investments and adjust for inconsistent inventory accounting, among other corrections. While there is always more to be done, the team can now generate adjusted earnings figures that are almost unquestionably closer to economic reality. Exhibit 6 shows a version of the earlier chart on profitability by market rank.

You would be forgiven for not noticing the difference between this and Exhibit 2, but the data is at least subtly different. Interestingly enough, when comparing the three periods this version of the data shows a slightly smaller advance for the largest companies and a small decrease in profitability in smaller cap firms, although the basic pattern is very similar.
The gap between the improving fortunes for the largest firms and stagnant fortunes for the bulk of companies does help explain the odd lack of relationship between profits and investment.
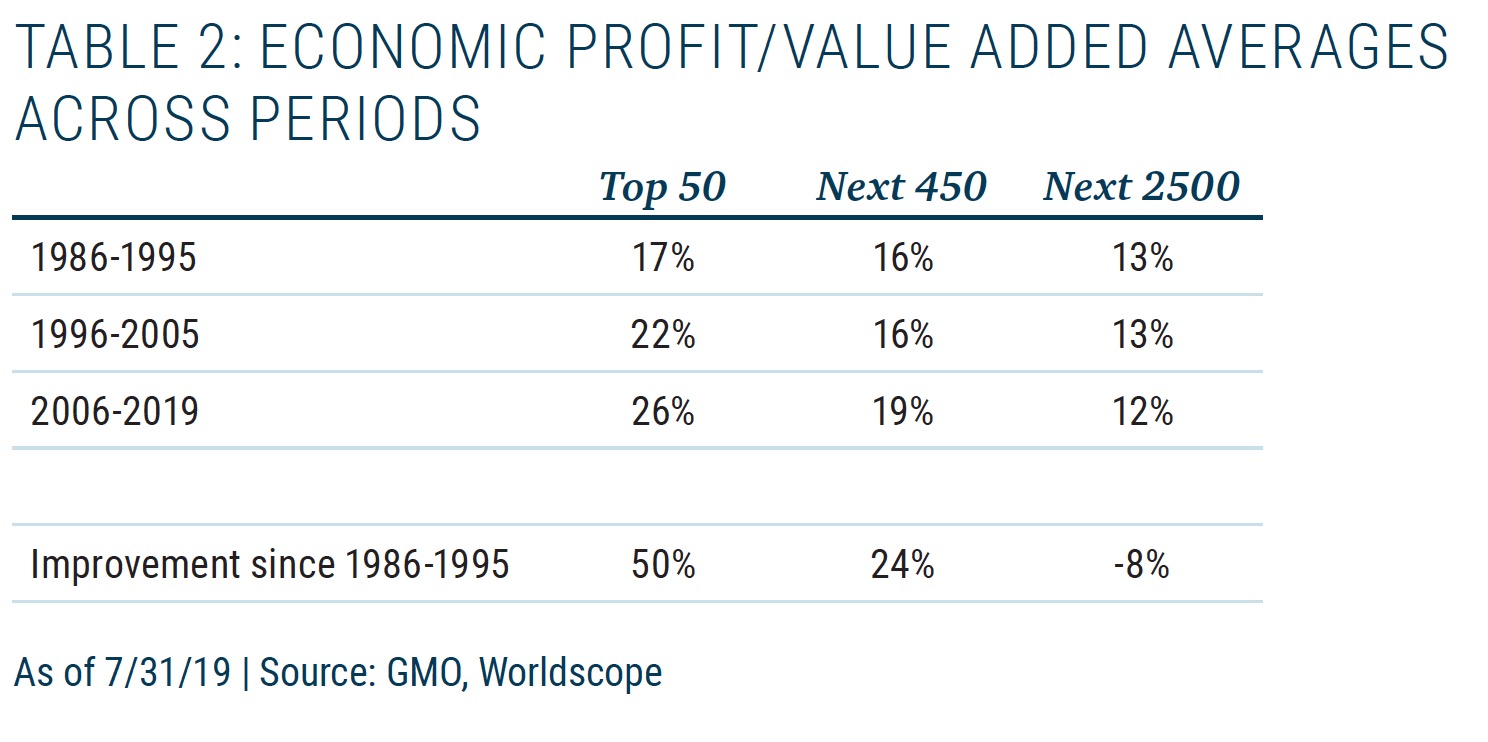
The largest 50 companies have seen a 50% improvement in their adjusted profitability since the earliest decade, while the next 450 have seen a much smaller 24% increase and the rest an 8% decrease. Clearly, the upward shift in profitability is not driven by archaic accounting standards, although it is interesting to see that properly accounting for R&D, advertising, and other expenditures that analysts argue GAAP gets wrong doesn’t particularly flatter recent years relative to the more distant past.3
But the gap between the improving fortunes for the largest firms and stagnant fortunes for the bulk of companies does help explain the odd lack of relationship between profits and investment. The largest firms fund their investments more or less entirely out of internal cash flow. The only notable exception to this is when they buy other companies, and that, while certainly an investment from the firm’s standpoint, is not an investment from an overall economic perspective because assets are only shifted around, not created.4 The companies that do use outside money to make investments are generally small companies. Because the profitability of smaller companies is not particularly high, it cannot be much of a surprise that they feel no burning need to raise capital to ramp up their investments.
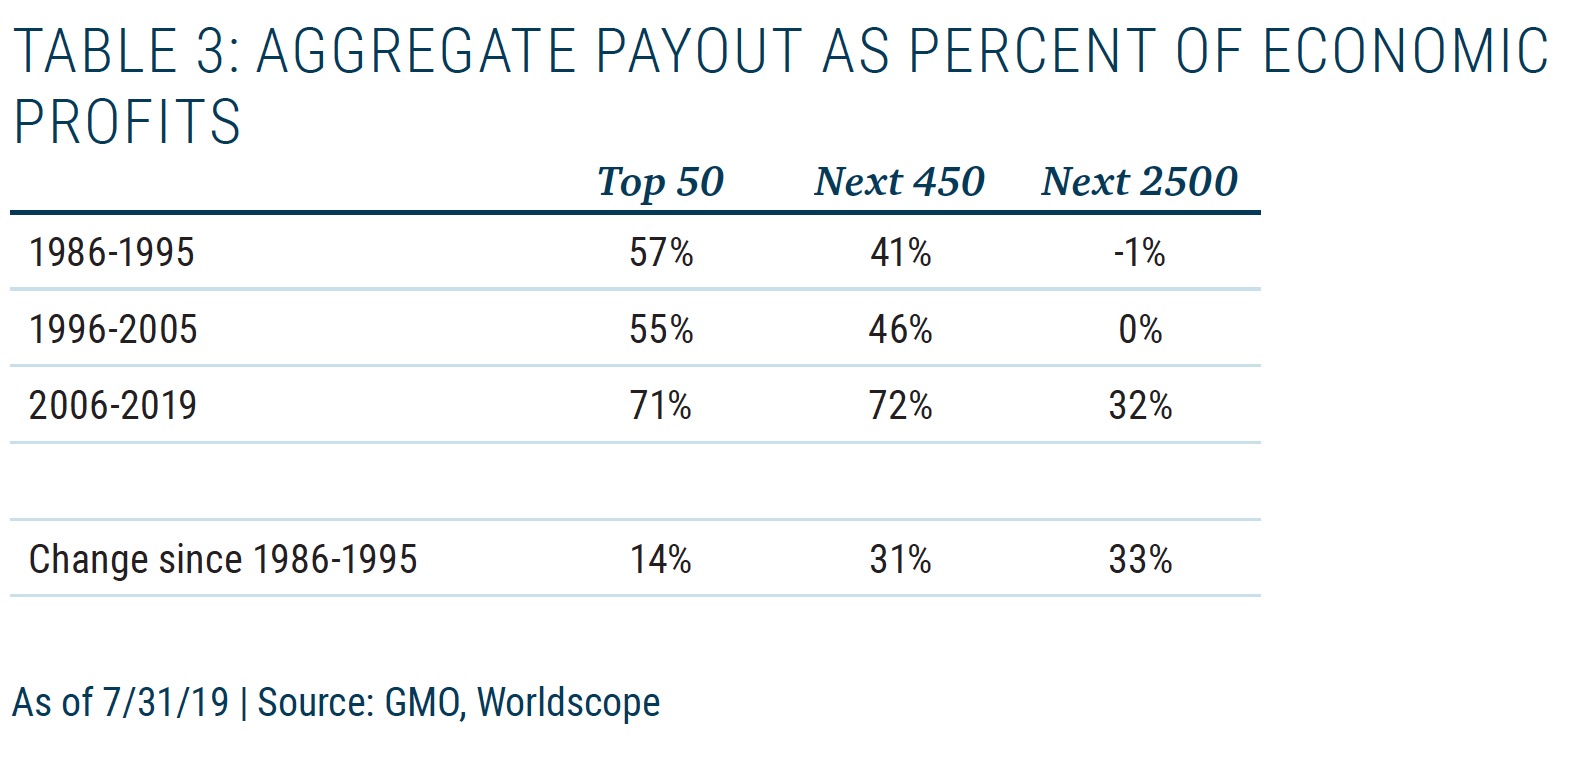
This still does leave the question as to why the largest firms are not using their enhanced cash flow to increase their own investment rates. After all, if these companies have increased their profits significantly, they could increase their investments out of internally generated cash flow. But the payout ratios of these companies, inclusive of the money they spend on stock buybacks, has instead grown substantially over the past 33 years, as we can see in Exhibit 7.

3 Adjusting the accounting improves profitability for all the groups in all periods, with no particular tendency for the recent years to be more affected than earlier ones.
Actually, given the gyrations of stock issuance by smaller companies and their occasional swoons in profitability, it’s a little hard to see the shifts displayed in the exhibit.5 Table 3 shows averages for the groups in the same periods as the profitability figures.
4 Buying the equity of another company does not create any new physical or intellectual capital as it is a purely financial transaction. There may be goodwill created, but that is an accounting concept, not really an economic one.
5 I took out the data from April 2009 to February 2010 for the “Next 2500” group as the combination of sometimes negative earnings and some significant dilution left the numbers not looking meaningful.
All groups have shown a significant increase in payout. In the case of larger companies, they are now paying out over 70% of their earnings to shareholders. Smaller cap companies pay out much less than their larger counterparts at just over 30% of earnings, but until fairly recently they paid out nothing net of equity issuance, making their shift over the period the largest of any group.
So why would we have a combination of enhanced profitability and decreasing investment? The most plausible answer seems to me to be that increased industry concentration and market power by the largest companies means the bulk of their profits takes the form of economic rents in the businesses in which they are dominant.6 Because the firms are already dominant in their spaces, there may not be a lot of expanding they can do short of branching out into new business lines, where their position will likely not be as dominant and their profit margins far less enticing.
The investment opportunities of these extraordinary companies do not seem to have grown on pace with the economic rents they are capturing in their current business. And the rest of corporate America is not profitable enough to justify ramping up its investment. What does that tell us about the future of growth and profits in America? The plus side of low rates of investment is that it means less chance of overcapacity, which pushes down profit margins, being created. The minus side is, of course, slow growth. While it is probably unfair to entirely blame the slowdown in U.S. productivity growth on the fall-off in corporate investment,7 the period since 2005 has been a uniquely dismal one for productivity growth in the U.S. We can see this in Exhibit 8.

6 While this seems an extremely logical reason, I have to admit that our attempts to “prove” that the shift in profitability has been driven by an increase in industry concentration, either cross-sectionally (more concentrated industries being more profitable) or longitudinally (industries where concentration increased the most improved their profitability) have not panned out. This could easily be because of the relative crudeness of the concentration data we have, or the simplicity of the Herfindahl-Hirschman Indexes we use to define concentration.
7 The most striking shift in productivity growth in recent years has been the huge fall-off in growth in the IT sector. From 1998 to 2005, productivity growth in computer and electronic products was 12.9% per year according to the Bureau of Economic Analysis (BEA). Since then it has been 3.9% per year. The demise of Moore’s Law, Denard Scaling, Kryder’s Law, and other measures of advances in computing power surely played an important role in the slowdown apart from any impact from falling investment. But across the 63 industries that the BEA tracks the median productivity slowdown has been 2.2%, so it certainly isn’t the case that everything is caused by technological roadblocks.
While productivity has risen from the truly dismal rates in the immediate aftermath of the Global Financial Crisis, productivity growth is half that of the first 55 years as shown in Exhibit 8 and a third of what we saw in the glory days of the late 1990s and early 2000s. It’s hard to see what would prompt a strong recovery in productivity in the absence of a strong recovery in corporate investment, and there aren’t a lot of reasons to expect a strong recovery in corporate investment. The largest companies presumably quite like the world as it is, given their place in it. While that should not stop them from making investments where they foresee a high return on capital, they have a lot to lose from change and are likely to actively work against disruptive progress. Even apart from a desire to maintain the status quo, dominant companies may well not be in a position to want to aggressively grow for fear of attracting the attention of regulators in the U.S. and abroad. That attention is certainly more clearly focused on the largest technology firms today, although to date the fines and business restrictions placed on them have not put much of a dent in their business models.
...no company’s competitive position is safe forever. Today’s champions have certainly done well historically. But the history of dominant companies shows that their extraordinary profitability tends to decay over time.
8 See Naidu, Posner, and Weyl “Antitrust Remedies for Labor Market Power,” https://papers.ssrn.com/sol3/papers.cfm?abstract_id=3129221 ;
Mainescu and Hovenkamp “Anticompetitive Mergers in Labor Markets,” https://papers.ssrn.com/sol3/papers.cfm?abstract_id=3124483 ;
and Ashenfelter, Hosken, and Weinberg “Did Robert Bork Understate the Competitive Impact of Mergers? Evidence from Consummated Mergers,” https://www.journals.uchicago.edu/doi/abs/10.1086/675862?journalCode=jle#
among others looking at moving antitrust theory beyond the Bork Doctrine and in a somewhat more assertive direction.
As to the question of what this suggests for the future of the U.S. stock market, it’s hard to know for sure, but a few points seem worth making. First, if the shift upward in the profitability of the largest companies has been going on over multiple business cycles, we shouldn’t expect it to unravel the same way that prior cyclical peaks in profitability did. That is not to say that there is not a cyclical element to profitability today, but rather that the cyclical factor looks to be superimposed on another longer-term shift. Our equity forecasts split the difference between assuming profitability is stable over time and that enduring shifts can happen, but they are biased toward an assumption of stability, with two-thirds of the weight on models that assume profitability is stable in the long run.
Because the profitability shift for the largest companies in the U.S. is unprecedented, it’s hard to look back at history to determine how we expect the future should evolve for them. The trend has certainly been in their favor and absent any change in the environment it is tempting to assume things will continue to get better for them. There are a couple of potential flaws in that reasoning. The first is the fact that no company’s competitive position is safe forever. Today’s champions have certainly done well historically – they wouldn’t be the largest companies in the U.S. if they hadn’t done well, after all. But the history of dominant companies shows that their extraordinary profitability tends to decay over time. That decay may be slow or rapid depending on the company. For the most stably dominant companies, such as the ones favored by our Focused Equity team in the GMO Quality Strategy, history suggests that their profitability decays to normal over something like a 30-year period. Now, 30 years is a long time to benefit from above-average profitability, justifying a significant valuation premium over average companies. But from the standpoint of forecasting the future profitability for such companies, it argues for a slow reversion rate for profitability, not no reversion.
But while that might be the right way to think about the largest companies individually, a group of companies needn’t act like an individual company. The largest stocks in the S&P 500 are a different group of companies than they were in 1996, or 2006, and yet their aggregate profitability has risen even as some former stars have seen their fortunes fade. On this front, the question is really whether the environment that has favored these dominant firms is likely to remain so biased in their favor. My guess is that it is not. The recent announcement of anti-trust investigations against the largest technology and related communications firms seems unlikely to be a one-off.
Apart from the simple issue of their growing dominance and staggering profits, the negative societal and privacy impacts of their basic business models make it harder to paint them as plucky upstarts improving the world and easier for critics to characterize them as disturbing big brother entities feeding off the worst instincts of humanity. Health care companies face a similarly daunting level of unpopularity, driven by their pricing practices combined with the striking disconnect between the amount the U.S. spends on health care versus the rest of the world and the health outcomes that spending seems to deliver. The growing interest in academia and beyond in studying the deleterious effects of large firms beyond looking at the direct impact on consumer prices also suggests a broader push against dominant firms on principle is increasingly likely.8
How long these forces will take to play out and how negative they will be for the largest firms is hard to know with any certainty. But it does seem to me that the wiser bet is to assume the world will not remain entirely safe for dominant companies. If we took the stance that the next seven years would see a one-third reversion of the trend of large company margins back to their long-term average, our forecast for the S&P 500 would improve by 1.4%.9 Given that our current forecast for that group is -3.8% and -0.9% on our two base scenarios, that assumption would raise the forecast to -2.4% and +0.5%. That is enough to shrink the U.S. “margin of inferiority” relative to other equities, but still leaves it at the bottom of the equity barrel. Even an assumption that the average profitability did not revert at all would not make a profound difference to the forecast, as it would increase the forecast by about 2%, again not enough to lift it out of the cellar in the equity rankings or to meaningfully change the desired holdings for the portfolios we run.10 To see why, Exhibit 9 shows the forecast for the S&P 500 with and without the potential changes relative to some of our favorite equity assets.

The groups we are excited about within global equities – U.S. small value, international developed value, and, above all, emerging markets value – are all at least at a 4.5% higher forecast return in the friendliest version of the forecast for the S&P 500, with EM value a stunning 10% to 10.6% higher.11
For the moment, we are not making any changes to our “official” asset class forecasts despite a guess that we are being a little tough on the U.S. mega caps. Our preference is to not make one-off adjustments to our forecasts but look for the broader principle behind an issue and find a way to systematically build it into our models. This allows us to test whether a change improves the models across time and region or asset class, as well as making sure that as circumstances change we don’t find ourselves asking every month whether a one-off adjustment is still warranted or should change in magnitude. But a challenge to our models is an opportunity to improve them, and we are researching the general question of how to tease our cyclical aspects of profitability from potential secular changes. Should we find a method that genuinely seems to improve our understanding of asset class valuations, we will adjust our models accordingly.
 Ben Inker
Mr. Inker is head of GMO’s Asset Allocation team and a member of the GMO Board of Directors. He joined GMO in 1992 following the completion of his B.A. in Economics from Yale University. In his years at GMO, Mr. Inker has served as an analyst for the Quantitative Equity and Asset Allocation teams, as a portfolio manager of several equity and asset allocation portfolios, as co-head of International Quantitative Equities, and as CIO of Quantitative Developed Equities. He is a CFA charterholder.
Disclaimer
The views expressed are the views of Ben Inker through the period ending September 2019, and are subject to change at any time based on market and other conditions. This is not an offer or solicitation for the purchase or sale of any security and should not be construed as such. References to specific securities and issuers are for illustrative purposes only and are not intended to be, and should not be interpreted as, recommendations to purchase or sell such securities.
Copyright © 2019 by GMO LLC. All rights reserved.