by Harry G. Katica, CFA, Saut Strategy

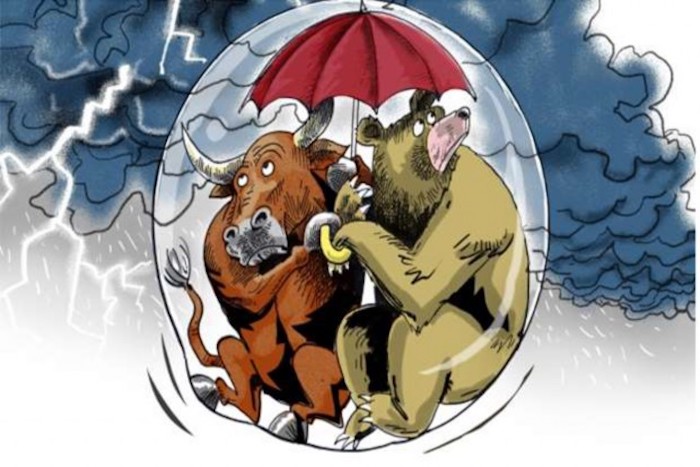
When Do A Bull and a Bear Both Fear the Market? When the Market is Locked in a Volatility Box, A Wide Trading Range Characterized by Sharp Reversals.
Source: The Internet
The Volatility Box
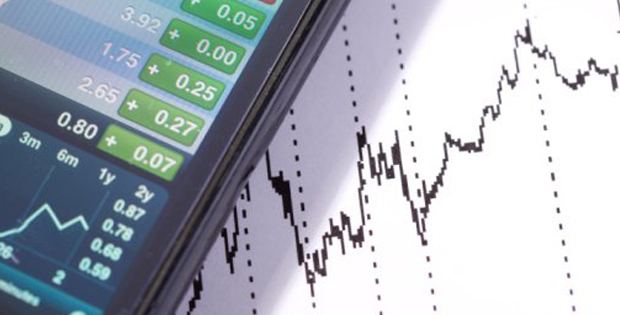
Sometimes you just get lucky. Last Friday, Powell had successfully navigated the rocky shoals of Jackson Hole, giving a stimulus hungry market just enough hope to inspire a small rally to 2,835. Out of nowhere came another trade tweet around 11 am and the S&P 500 was off the cliff again just like Wiley E. Coyote. So much for the week. So much for my report. It’s been like this since the end of July, May, December – going back to January 2018. They call it the Volatility Box.
With the dominance of mathematical algorithms and interconnectedness of the futures, cash, and options, the major averages these days have an uncanny ability to hit key inflection points. These levels look like a box. Even more interesting, these gravity spots often fall on obvious round numbers.
For the past few weeks, the SPX has pinged between 2,840 and 2,930 (a 4% range). It’s been worth a trade to test support, though it could get more volatile once the range is broken. That’s my fear. A big slice through either direction. At the close Thursday, the SPX was back up to 2,925, right at the 90-day Point of Control*.
With that range in mind, I bought some QQQ’s last Friday afternoon with the Nasdaq futures down 200 points. My plan was to catch a late bounce off 7,550 and sell before the close. You know what happened? It went down. Then the rally started just a few minutes before the close. Can’t sell now, I thought. It’s Friday and I would have to hold the position until Monday. Screwed up my whole weekend worrying about it.
Shortly after the 6pm open in China Sunday night, my son says hey Dad, the futures are down 40 to 2,810. I started to feel the pain in my chest. The Chinese must have done something to really upset markets. It’s on for real, I thought. They are going to cause another depression, and I’ll be broke. Why am I the one who buys in the day before the crash?
It reminded me about a few trades I made on Friday, October 16, 1987. After working for a year out of college, I had saved $2,000 and was ready to open my own account. My first two picks were Bruno’s, a supermarket retailer, and Anchor Glass Container, a leverage buyout by the original owner of the Tampa Bay Rays. Two thousand each. Yup. On margin. On the following Monday, my account vaporized. A 100% loss. For the rest of my life I will remember that pain.
To make matters worse, I was on the range Monday morning and would not be able to monitor the position. What a tense couple of hours. At 9:25 I took a coffee break to check my losses. By then, the futures had rallied 80 points, a 2.8% swing. Relieved, I sold my position for a decent profit and went back to the range. I got lucky.
While it’s terrifying to be in these trades, it’s the only way to feel the emotions of the market. Stocks often bottom on bad news, when the outlook is the bleakest. There are few positive catalysts and plenty of bad ones. When the biggest bull you know waves the white flag, there is nobody left to sell. The shorts begin to cover. The value buyers step in. The cycle starts again.
By writing about these experiences, I hope to share my highs and lows with readers. How I craft a thesis and occasionally get it right. Converting an idea into a profitable trading opportunity. Explore the emotions that make and cost money. At its core, investing stocks is about balancing fear and greed. Both must be managed properly to achieve favorable results. Fear is the toughest and costs the most money.
Sector Spotlight

Source: Stock Rover
The above chart shows how the major indexes have been caught in a ping-pong match since the beginning of August. Notice how tight the correlations were for most of period. At the end of each downswing, the Small Caps (IWM) almost broke down, before snapping back. They could be key to the health of the market for the next few months. If recession fears build rather than recede, growth forecasts will get cut, and small caps will lead the way down.

The chart above shows the yield on the US 10-year government bond going back three years. Interest rates have fallen over 50% since October, and another 33% in the last month alone. Clearly, the bond market is worried about more than a garden variety recession. Maybe its capital is fleeing China and the Eurozone and ending up in the US, pushing up bonds. It’s also possible that fears of a hard Brexit are wreaking havoc with the currency markets. If so, it could be October before volatility returns to normal.

Source: Fidelity
The table above may show the most misleading performance I have seen in a while. It picks up last Friday, when just about everything was down. The risk off sectors did best. Since Sunday, the risk on sectors have done better, suggesting increasing confidence in a rebound. Everything seemed to change after the G-7 summit. Can it last?

Above is the chart for IYT, the Transportation ETF that mimics the Dow Jones Transportation Average. If the economy sees any green shoots resulting from low interest rates, it will show up in the shares of Railroads, Truckers, and Airlines. On Thursday, the DJT closed roughly at the mid-point of the 9,750-11,000 range since October 2018, slightly below its 12-month Point of Control* at 10,350. These gravity points suggest the market views the odds of a further slowdown are still 50/50. It will likely take a significant push to get through resistance starting at 10,200.

Above is the Utility sector (DJU). It is the most sensitive to interest rates. The chart looks very similar to bonds (the inverse of interest rates) and going forward will reflect market expectations for Central Bank easing. While the group still has excellent momentum, I am concerned about the capital that has flooded into the US to avoid falling currencies elsewhere. Things could change after Brexit in late October.

Financials are on the flip side. On the one hand, lower rates are supposed to crush them. On the other, the multi-nationals could pick up market share if there is a problem in Deutsche land. Investor sentiment about the group is about as bad as it gets right now, yet the Financial ETF (XLF) has remained in a range between $26 and $29. If US interest rates have been pushed down by safe, haven seeking Europeans and Hong Kong elite, they could bounce back quickly. While the reward seems worth the risk, I like to pair my Bank stocks with Real Estate (or Utilities) to reduce the risk of a mistake on interest rates. Why take one if you don’t have to?

Industrials (XLI-$75.45) had one of the more consistent bounces during the week, perhaps helped by short covering. According to the news, China has been sending a more positive tone about negotiations. Maybe they decided it was easier to give something than remain at loggerheads with the US. In any event, the strong move is indicative of a change in policy, perhaps following the G-7. Interestingly, this week’s rally has put the sector right in the middle of its trading range, and but below its Point of Control at $77. This suggests that resistance is heavy from $76 &79.

The Tech sector has been the backbone of the S&P 500, despite an 8%+ drop in early August. Before that, it was the best performer YTD. It seems unlikely for the sector to be close to its 52-week highs headed into a so-called global slowdown. At the same time, the Software and IT Services industries have some of the more stable growth stories in the S&P 500, including MSFT, V, and MA. Semiconductors will be another important industry to watch, due to its plethora of large cap constituents (INTC, AVGO, TXN). Wednesday and Thursday were a good start for the group.

If ever there was a Sector focused on the US consumer, it would be Communication Services. Ironically, the variable holding them back is looming regulatory and legal threats in the US and Europe. FB and GOOG may be shedding the concern amid solid growth outlooks. Cable Operators (CMCSA, CHTR) have significantly outperformed since early August.

The Consumer Discretionary sector has moved in lockstep with the S&P 500 over the last month, despite a double-digit loss by AMZN. Homebuilders, Household Durables, and Retailers are all sensitive to changes in interest rates. While investors focus attention on whether there is a recession, the Discretionary sector has been pricing in a pickup or sustained improvement on the part of the US consumer. On the flip side, Hotels (MAR, HLT, H) and Cruise Lines (CCL & RCL) sold off Thursday. It will be interesting to see how these inconsistencies get resolved in the coming weeks.

Energy may be the most vexing Sector so far this year. While there have been flurries of interest, investors have been concerned about US production and global demand for some time, keeping oil prices at the lower end of their range. I do try to trade the group, and it seems like the Wednesday inventory numbers could reflect declining production. My preference is to own the stocks when crude prices are leading them up, like today. CVX and HES are my picks this week.

Materials also qualify as a hard to understand group for me. Chemical (DD, DOW) stocks drive the group, yet they are one of the deepest cyclicals in the S&P 500. A global slowdown should be bad news. Yet every time the market gets a hope rally on Fed stimulus, the group jumps on what looks like short covering. I’m just not yet ready to bet on a uniform recovery in the next up cycle.

The risk off sectors (including Utilities discussed earlier) have come to the rescue of sector rotation investors many times this year. When rates are falling and the economy uncertain, investors typically flock to Consumer Staples and Real Estate. Both appear vulnerable in the short-term if investors continue to move into cyclical sectors.

Healthcare is usually one of my favorite groups. It benefits from technological advances in Equipment, Biotech, & Pharma. At the same time, the stocks tend to trade at premiums during times of slow economic growth. While there is always a risk that the Feds will interfere with regulation and price controls, the group has been dealing with politics pretty much since the beginning of the Presidential campaign in the Spring.
*The Point of Control is the price at which the most volume has occurred in a stock during the time period of the chart.
Copyright © Saut Strategy