
It has been a week since the Fed cut interest rates by 0.25% and in that time, investor confidence has worsened, not improved. The Fed hints toward a one and done rate cut were quickly overshadowed by escalating trade tensions. President Trump’s announcement of new tariffs against China has rattled investors and increased concerns not only that China could retaliate, but that the growing trade war could reduce global trade. A weakening of the Chinese Yuan to its lowest level in a decade and the US naming China a “currency manipulator” not only poured gasoline on the fire, but also indicate that the trade turmoil is having a negative impact on China and other economies.
On August 7th, three Asia Pacific central banks cut interest rates with the Reserve Bank of New Zealand announcing a deeper rate cut than had been expected (0.50% instead of the widely anticipated 0.25%), shifting the tone from central banks trying to prolong the expansion to central banks trying to fight off a global recession.
In this environment, capital flows have taken a more defensive turn. While US markets have slumped into a mild correction, overseas markets have taken a move decisive downturn, particularly more volatile/ vulnerable areas like emerging markets and China-sensitive commodities like copper and crude oil. On the other hand, economic turmoil has sparked a flow of capital into defensive havens such as precious metals.
In this week’s issue of Equity Leaders Weekly, we look at how a deepening currency war has ignited further gains for Gold and at capital flowing out of emerging markets.
Gold Continuous Contract (GC.F)
Gold spent much of 2017 and 2018 in consolidation mode swinging back and forth between $1,180/oz and $1,380/oz. This year, Gold has broken out to the upside and has continued to climb, recently regaining the $1,500/oz level last seen in 2013.
Previously, gold’s moves had been influenced by market volatility and the ebbs and flows of capital in and out of defensive havens based on short-term factors. What is different now, however, is that this Gold rally is being driven by the metal reasserting its role as a store of value and counterweight to paper currencies.
Whether on purpose or not, the recent stimulus moves made by central banks around the world, including one or more rate cuts in the US, Australia, New Zealand, India and elsewhere, has started to depress the value of paper money and boosted the value of financial assets outside the central banking system including precious metals and cryptocurrencies.
Gold had previously broken out of a downtrend, but the breakout over $1,380/oz completed a bullish Spread Triple Top pattern, completed a bullish Ascending Triangle pattern, and signalled the start of a new uptrend. Upside resistance tests may appear near $1,554/oz or $1.820/oz based on previous column highs and lows with resistance also possible near $1,715/oz based on a horizontal count. Initial support appears near $1,352/oz based on a 3-box reversal.

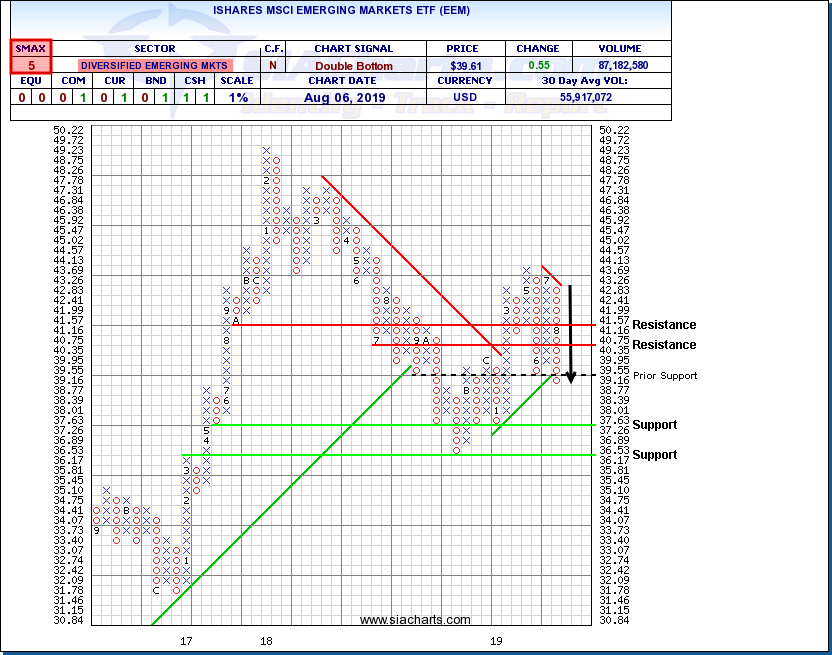
iShares MSCI Emerging Markets ETF (EEM)
At the margins, Emerging Markets can act as an important barometer of investment sentiment, particularly attitudes toward risk. In times when investors are confident and willing to take on risk to seek higher potential rewards, emerging markets attract capital, but when investors rein in and start going defensive, they tend to pull out of emerging markets first. The broader emerging markets world is also quite sensitive to China either through direct trade or indirectly through commodity prices.
Escalating trade tensions between the US and China have stoked concerns that global trade could slow, impacting China’s economy and the demand for resources, putting energy and base metal prices under pressure. This week’s three Asia Pacific interest rate cuts indicate that central banks have become concerned about the fallout which can be seen as a warning to investors that economic risks have increased.
The iShares MSCI Emerging Markets ETF (EEM) spent much of 2018 under distribution but had been recovering through the first half of 2019. Recently, however, EEM has gone into retreat once again with a break below $39.15 not only snapping uptrend support but also completing a bearish Double Bottom pattern to signal the start of a new downtrend. Based on previous column lows, downside support could potentially appear near $37.25 or $36.15 with initial resistance possible near $40.75 based on a 3-box reversal.
SIACharts.com specifically represents that it does not give investment advice or advocate the purchase or sale of any security or investment. None of the information contained in this website or document constitutes an offer to sell or the solicitation of an offer to buy any security or other investment or an offer to provide investment services of any kind. Neither SIACharts.com (FundCharts Inc.) nor its third party content providers shall be liable for any errors, inaccuracies or delays in content, or for any actions taken in reliance thereon.