by Andrew Adams, Saut Strategy
So not the greatest timing on my part yesterday. I write a piece dismissing the action in the Transports and then CSX reports disappointing earnings and falls 10% to lead the Transports lower. Still not a signal to head for the hills, but it is worth watching if the other railroads and Transports that have been holding up well start failing during earnings season (UNP looks to have beaten Earnings Whispers’ estimates just now though).
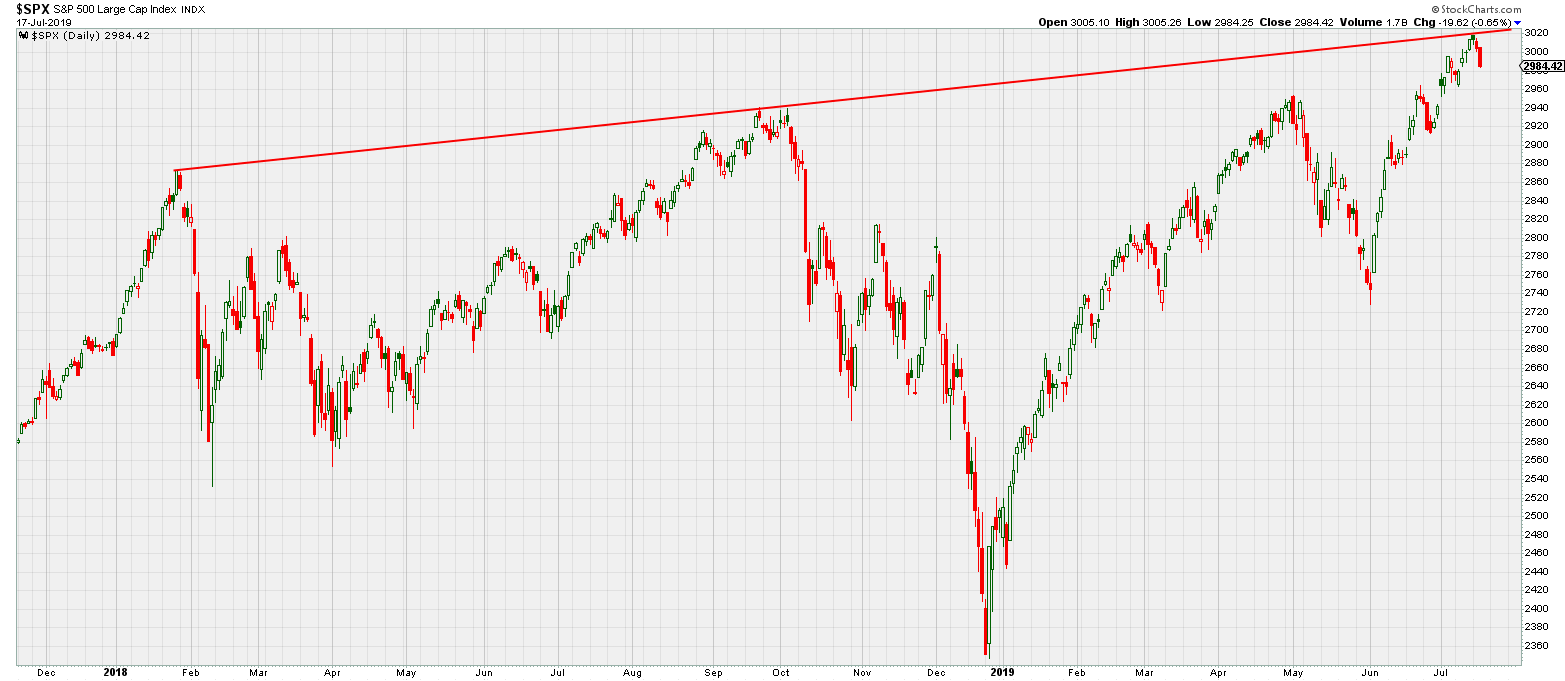
Also, I somehow forgot to include the chart below yesterday despite having saved it to use this week (that’s what happens when you work on these things at 5 am). This resistance line created by connecting the January 2018 and September 2018 highs is a big deal in the short term and probably will continue to provide a ceiling to the S&P 500 and broader market.
Here, too, that doesn’t mean go out and sell all your stocks, but it might mean at least another period of sideways consolidation to allow that resistance line time to rise higher. I’m still not seeing enough additional red flags yet to be too concerned but I’ll have to get more defensive in my thinking if the S&P falls beneath the 2940-2950 breakout zone since that would be yet another false breakout after hitting this major resistance line.
My hope is that the S&P and broad market can sort of “ride” this resistance line higher over the next few weeks to months. That means we may not have explosive upside, but that would also mean limited downside. The index can, of course, break through that line (it’s not an ACTUAL barrier) but it’s going to likely take some incredible strength to do so, which may be difficult unless we get an upside surprise like a trade deal with China.
For now, just keep an eye out for what’s going on and manage risk on a position by position basis. There’s not enough in the broad market to provide a “red light” sell signal, but I think that resistance line is at least a cautionary “yellow light” for the near term.
-Andrew
Copyright © Saut Strategy


