by Frank Holmes, CIO, CEO, U.S. Global Investors
Share this page with your friends:
Please note: The Frank Talk articles listed below contain historical material. The data provided was current at the time of publication. For current information regarding any of the funds mentioned in these presentations, please visit the appropriate fund performance page.
July 15, 2019

We’re just past the midpoint of 2019, and ordinarily that would mean it’s time for the Commodities Halftime Report. That will need to wait, though, as there are more urgent things for me to share with you, starting with a mea culpa.
As you know, the market collapsed in the fourth quarter of 2018, sinking some 20 percent between the end of September and December. Expressed another way, it fell four standard deviations below the mean over 60 trading days—a huge move.
When the market has fallen by that much, it’s historically been a good time to get contrarian because a reversion to the mean hasn’t been too far behind. Mean reversion, as I explain in “Managing Expectations,” is the idea that prices tend to move back to their historic averages eventually.
The reason I’m telling you this now is that I didn’t take my own advice. I believed, as others did, that more pain was ahead. Prices bottomed, but instead of buying, I took money off the table. And watched the market bounce strongly. By the time it became clear that this aging bull market wasn’t slowing down, it was too late. The opportunity had come and gone.
We all have a choice on how we deal with setbacks. When asked once about the single most important lesson he’s learned over the course of his long career, the billionaire hedge fund manager Ray Dalio pointed to his bad bet in the 1980s. He believed the U.S. was headed for a depression, and when one never came, he fell so deeply into debt that he had to borrow $4,000 from his father to make ends meet. The experience “was one of the best things that ever happened to me because it gave me the humility I needed,” he wrote in his bestseller Principles: Life and Work.
I never stop learning, even after four decades spent in global markets. That’s as true now as it was when I first started as a young analyst in Toronto. And I’m pleased to say that, after thoroughly reviewing our models, our investment team and I have great confidence going forward.
Cutting Rates in an Expansionary Environment
The market is now at record highs, and unemployment is way down. Even so, a U.S. rate cut is expected as early as this week. During his congressional testimony last week, Federal Reserve Chairman Jerome Powell raised concerns over slower global growth and trade tensions, which in turn have contributed to weaker demand and manufacturing activity. The most recent Global Manufacturing Purchasing Manager’s Index (PMI) showed that, at 49.4, factories contracted for the second straight month in June. We haven’t seen back-to-back sub-50.0 PMI readings since the second half of 2012.
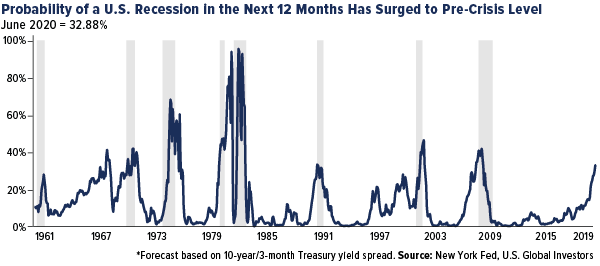
There’s also a one-in-three chance we could see a full-blown recession sometime next year. That’s according to the New York Fed’s recession probability index, which flashed a 12-year high of 32.9 percent last month. Since 1960, every time the index has surpassed 30 percent, the economy has tanked within the next 12 months.
Despite the risks, the U.S. economy is still expanding—an unusual, though not unheard-of, time for the Fed to consider cutting rates.
So let’s assume for a moment that the Fed does take action this year. What effect would that have on the stock market as well as manufacturing activity?
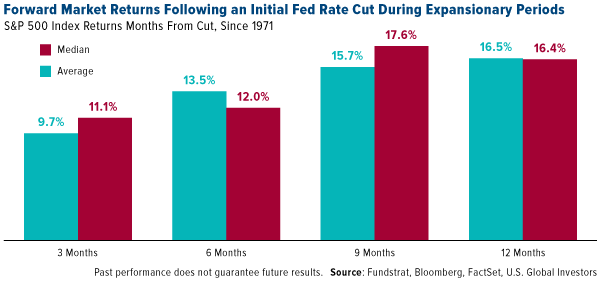
That’s precisely what analysts at market research firm Fundstrat looked into recently, and what they found is that 100 percent of the time, the market increased in the next three, six, nine and 12 months. The median gain over nine months, in fact, was nearly 18 percent.
Hypothetically, if the same thing were to happen today, that would put the S&P 500 Index at around 3,500 by next April.
Once again, for those in the back: In every case going back to 1971, when the Fed began a new easing cycle while the economy was expanding, stocks went up three months, six months, nine months and 12 months later. No exceptions.
Manufacturers Looking for Tariff Relief
That wasn’t the case with manufacturing activity. According to our own research, the ISM Manufacturing Index, which measures the U.S. sector, rose only a third of the time three months following a rate cut in good times. Six and nine months out, the index was up half the time. Twelve months out, it was higher about 66 percent of the time.
Those are decent odds, but a rate cut now would be much more favorable for stocks, statistically speaking.
To get manufacturing up to full capacity, I think there needs to be a resolution to the U.S.-China trade war. That was also the assessment of Renaissance Marco. In a note dated July 2, Neil Dutta, head of economics, observed that the word “tariff” featured prominently in purchasing managers’ June commentaries, suggesting trade issues were partly to blame for ISM weakness. If tariffs are indeed a driver of slower manufacturing growth, “it would imply the ISM has room to pick up from here. After all, we’ve seen some relief over the weekend (China) and earlier in June (Mexico),” Dutta wrote.
Bullish on Gold
If rate cuts are favorable for stocks, they can act as rocket fuel for the price of gold. As I’ve explained many times before, the yellow metal has thrived in low-rate, weak-U.S. dollar environments.
Last week UBS reiterated the relationship between gold and interest rates, writing: “Low to negative rates suggest falling cost of holding gold at a time when elevated trade and geopolitical uncertainty strengthen the case for diversification.” Strategists Joni Teves, Roque Montero and Bhanu Baweja see gold hitting $1,450 an ounce by the end of this year and rising “modestly” to $1,500 in 2020.
TD Securities expects gold to average $1,400 for the rest of the year, followed by a lift toward $1,500 “in the final months of 2020,” driven by low to negative rates. One of President Donald Trump’s picks for the Federal Reserve Board of Governors, Judy Shelton, is also constructive for gold, as she is in favor of lowering rates and supports a return to the gold standard.
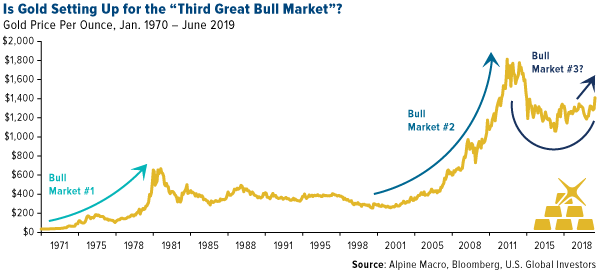
Finally, analysts at Alpine Macro see the beginnings of gold’s “third great bull market of the post-war period.” A rate cut by the Fed could set in motion a multi-year bear market in the dollar, analysts write, which is very supportive of gold. With the recent technical break above $1,400, “new all-time highs for gold should be seen in the coming years,” the research firm writes.
Curious to know which countries produce the most gold? Our ever-popular post has been updated with the latest data! Click here to see which country tops the list!
All opinions expressed and data provided are subject to change without notice. Some of these opinions may not be appropriate to every investor. By clicking the link(s) above, you will be directed to a third-party website(s). U.S. Global Investors does not endorse all information supplied by this/these website(s) and is not responsible for its/their content.
Standard deviation is a measure of the dispersion of a set of data from its mean. The more spread apart the data, the higher the deviation. Standard deviation is also known as historical volatility. J.P. Morgan Global Manufacturing PMI gives an overview of the global manufacturing sector. It is based on monthly surveys of over 10,000 purchasing executives from 32 of the world's leading economies, including the U.S., Japan, Germany, France and China which together account for an estimated 89 percent of global manufacturing output. It reflects changes in global output, employment, new orders and prices. The ISM manufacturing composite index is a diffusion index calculated from five of the eight sub-components of a monthly survey of purchasing managers at roughly 300 manufacturing firms from 21 industries in all 50 states. The S&P 500 Stock Index is a widely recognized capitalization-weighted index of 500 common stock prices in U.S. companies.
This post was originally published at Frank Talk.
Copyright © U.S. Global Investors


