by Rob Arnott, Bradford Cornell, Shane Shepherd, Research Affiliates
Key Points
- The authors define a bubble and an anti-bubble so that investors can avoid or select, respectively—in real time—the impacted assets or asset classes.
- Today, Tesla, bitcoin, and certain US technology stocks are valued far above their fundamentals and are well into bubble territory. These assets are well avoided by investors, as are US market cap–weighted indices, which have an historically large concentration of pricey and overvalued large-cap tech stocks.
- Investors who take advantage of today’s anti-bubbles have the opportunity to add value by investing in the emerging markets, particularly state-owned enterprises (SOEs), and by averaging into the UK stock market where stocks are feeling the pressure of Brexit-related uncertainty.
- Value-oriented smart beta strategies in both the developed and emerging markets offer investors promising investing opportunities outside the many bubbles in today’s global markets.
In April 2018, we published our most-downloaded article ever, “Yes. It’s a Bubble. So What?” Our key purpose was not to make the observation that “Yes, it’s a bubble,” but to offer a formal definition of bubble, which is perhaps the first formal definition that can be used to identify a bubble in real time instead of years after the fact. A second point we made was that bubble prices (asset prices far higher than those a valuation model can justify with plausible assumptions) can continue to soar higher and longer than many of us might imagine. As the saying goes, “the market can remain irrational far longer than you can remain solvent.”1 Indeed, in true bubbles, we should expect them to soar—until they don’t. Our third point was to illustrate how investors can use the definition to identify and avoid the trap of current bubbles and instead seek out anti-bubbles and assets that are likely undervalued.
With the blessings of an admittedly short year of hindsight, how useful were our observations? Most turned out to be spot-on. So where do we see bubbles today, and what should investors do? As Harry Markowitz has observed, “the only free lunches in finance are diversification and long-horizon mean reversion.”2 We can bet on mean reversion in bubble assets, but must never do so on a scale large enough that runaway speculation could ruin us.3
Bubbles and Anti-Bubbles
Our 2018 article offered a reasonable definition of the term bubble, which we can use in real time to identify bubbles as they form. We define a bubble as having two characteristics. First, the asset or asset class offers little chance of a positive risk premium relative to bonds or cash, using a generally accepted valuation model with a plausible projection of expected cash flows. Second, the marginal buyer of the asset or asset class disregards valuation models, presumably buying based on a popular narrative and expecting to resell the asset to someone else at a higher future price—and as if the market will tell them when to sell!4
Our definition of an anti-bubble—which attracted little attention in our 2018 article, but is equally important—is the opposite. An anti-bubble is an asset or asset class that requires implausibly pessimistic assumptions in order to fail to deliver a solid risk premium. In an anti-bubble, the marginal seller disregards valuation models, which are indicating the asset is undervalued. In this article, we also identify anti-bubble opportunities.
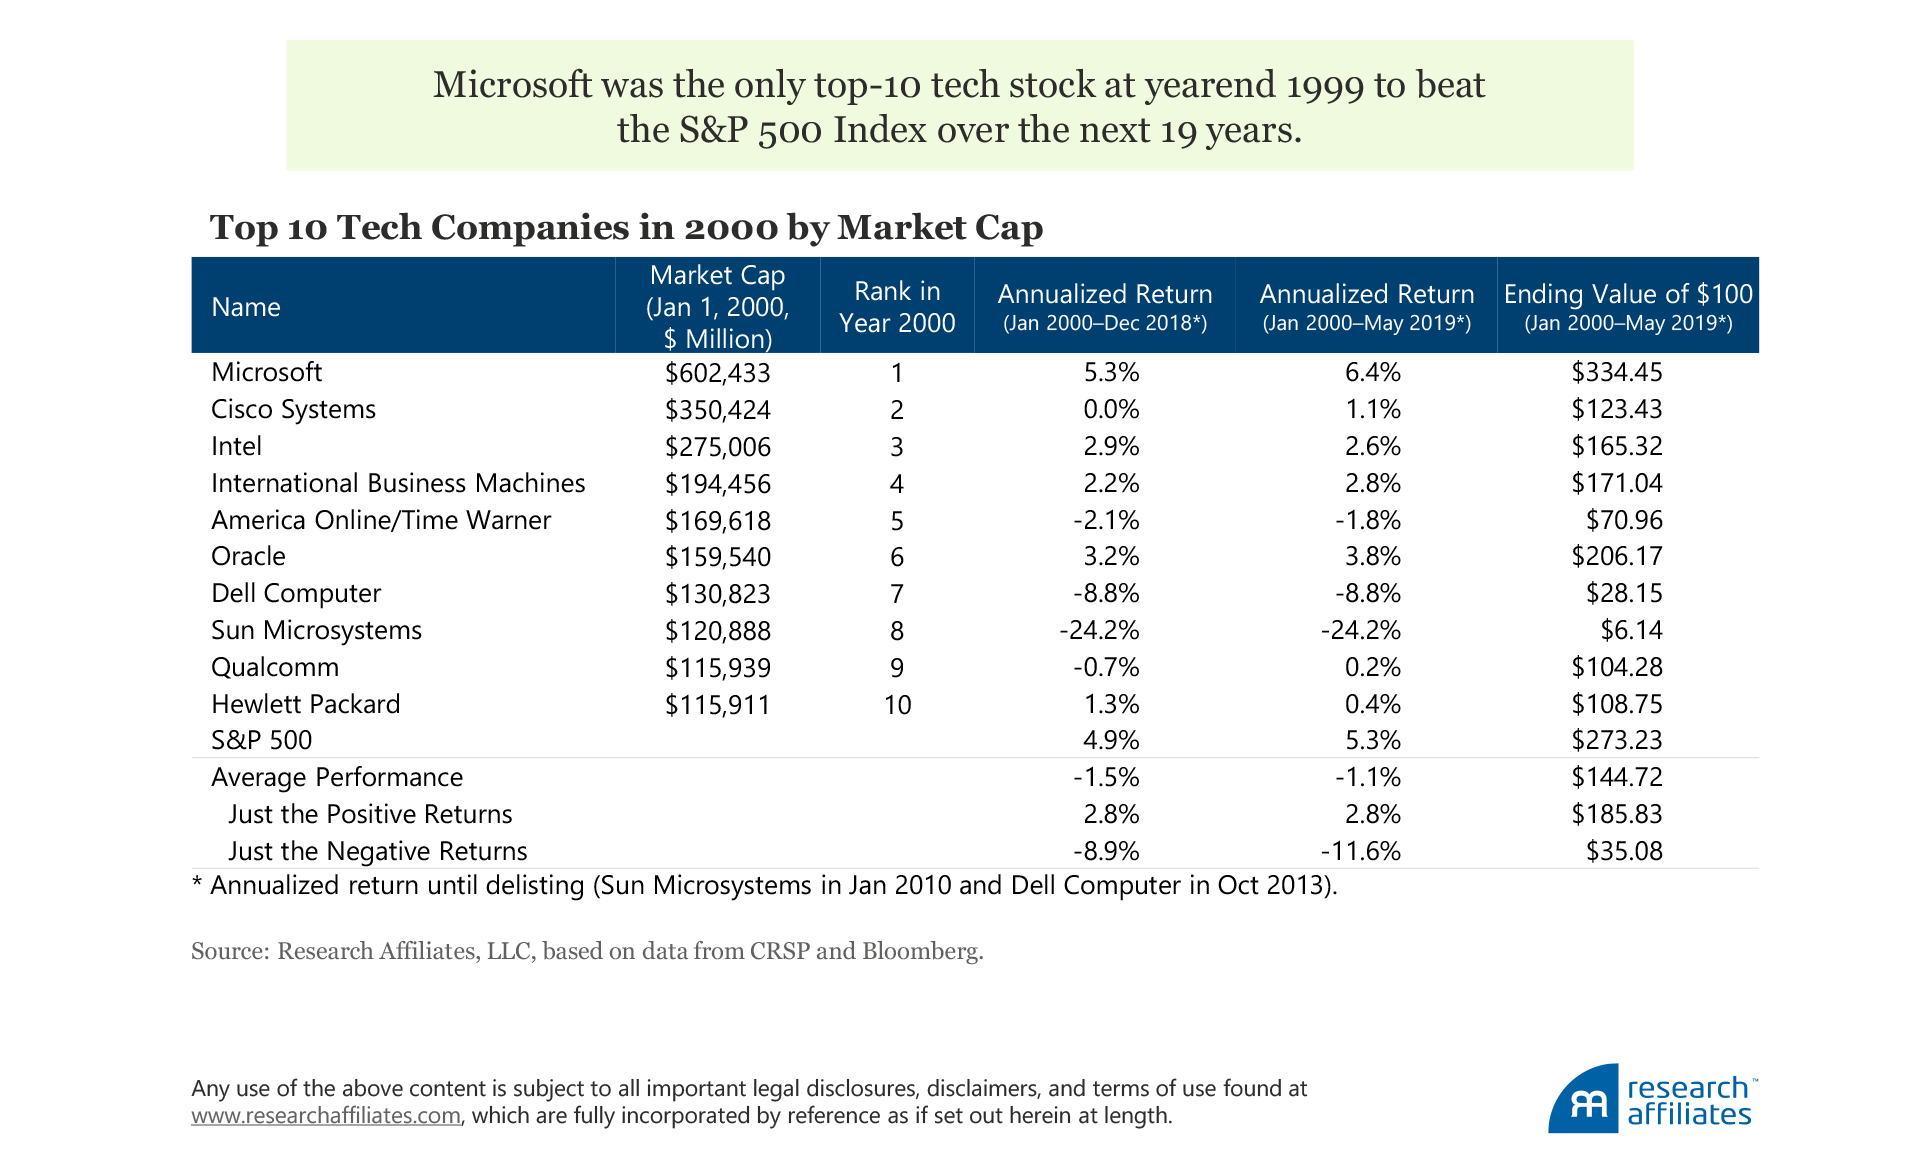
Note our use of the words plausible and implausible. The growth required to justify a stock’s current price needs only be implausible, not impossible. (Certainly categorizing an event or achievement as implausible requires reasoned judgment and a perspective with which some—likely many!—market participants may disagree.) A handful of the many highfliers during the tech bubble of 1999–2000 achieved their implausible growth expectations. Amazon comes to mind.5 This doesn’t change the fact that only one of the 10 largest-cap tech stocks of yearend 1999 has beaten the S&P 500 Index in the intervening 19 years.6 Amazon and Apple, both of which handily beat the S&P 500, were not in the top 10 list in 1999. Clearly, identifying bubbles in real time can add considerable value for the patient investor. Identifying a bubble, however, does not guarantee the bubble will burst (although that outcome is highly likely) nor does it provide any insight into when it may burst.
Defining a bubble requires applying reasoned judgment around unobservable variables. What constitutes a “plausible projection of expected cash flows” likely differs from one observer to the next and identifying the motivations and beliefs behind the mass of investors’ purchasing decisions generally requires careful assessment. Even so, the importance of a definition applicable in real time cannot be overstated. Too often, pundits identify bubbles much like the National Bureau of Economic Research identifies recessions: only in hindsight, typically years after the fact, which offers no actionable opportunity for investors in real time.
Our Scorecard Since April 2018
In our 2018 article, we argued that bubbles were occurring in parts of the global technology sector, in Tesla, and in bitcoin and other cryptocurrencies. Let’s review what has happened with these assets over the intervening months.
Technology stocks. Timing the collapse of a bubble is of course notoriously difficult, but in the fourth quarter of 2018 we believe we saw the first warning of a possible burst, with more drama likely to follow. We noted the rarity of seeing such a concentration of companies from one industry dominating the global market-cap roster of companies. At that time, seven of the eight largest stocks were tech companies: Alphabet, Apple, Microsoft, Facebook, Amazon, Tencent, and Alibaba.7 Since then, Apple, Amazon, and Microsoft have all briefly crossed the $1 trillion market-capitalization mark. It bears mention that none of these three stocks clearly meets our definition of a bubble. Each of the companies is a business with ample cash and cash flow and each is priced at a level that would require aggressive, but not implausible, expectations for future growth in order to deliver a solid equity risk premium in a discounted cash-flow model.
Not much has changed in the last 15 months,8 but we could hardly be faulted for anticipating continued turnover in the top 10 list; typically, only two or three of the top 10 retain that perch after a decade (Arnott, 2010). The historical record shows that the global top dog (the stock with the greatest market capitalization) has outpaced the global capitalization-weighted index over the next decade only once—and only barely—in the last 30 years. And the average shortfall of 10.5% a year for 10 years is not tiny! What client would have faith in a mutual fund manager who asserts that “history suggests my largest holding has a 95% chance of underperforming by double digits annually, but I’m happy to invest more in this company than any other”? Market-cap index fund investors do exhibit this type of faith!
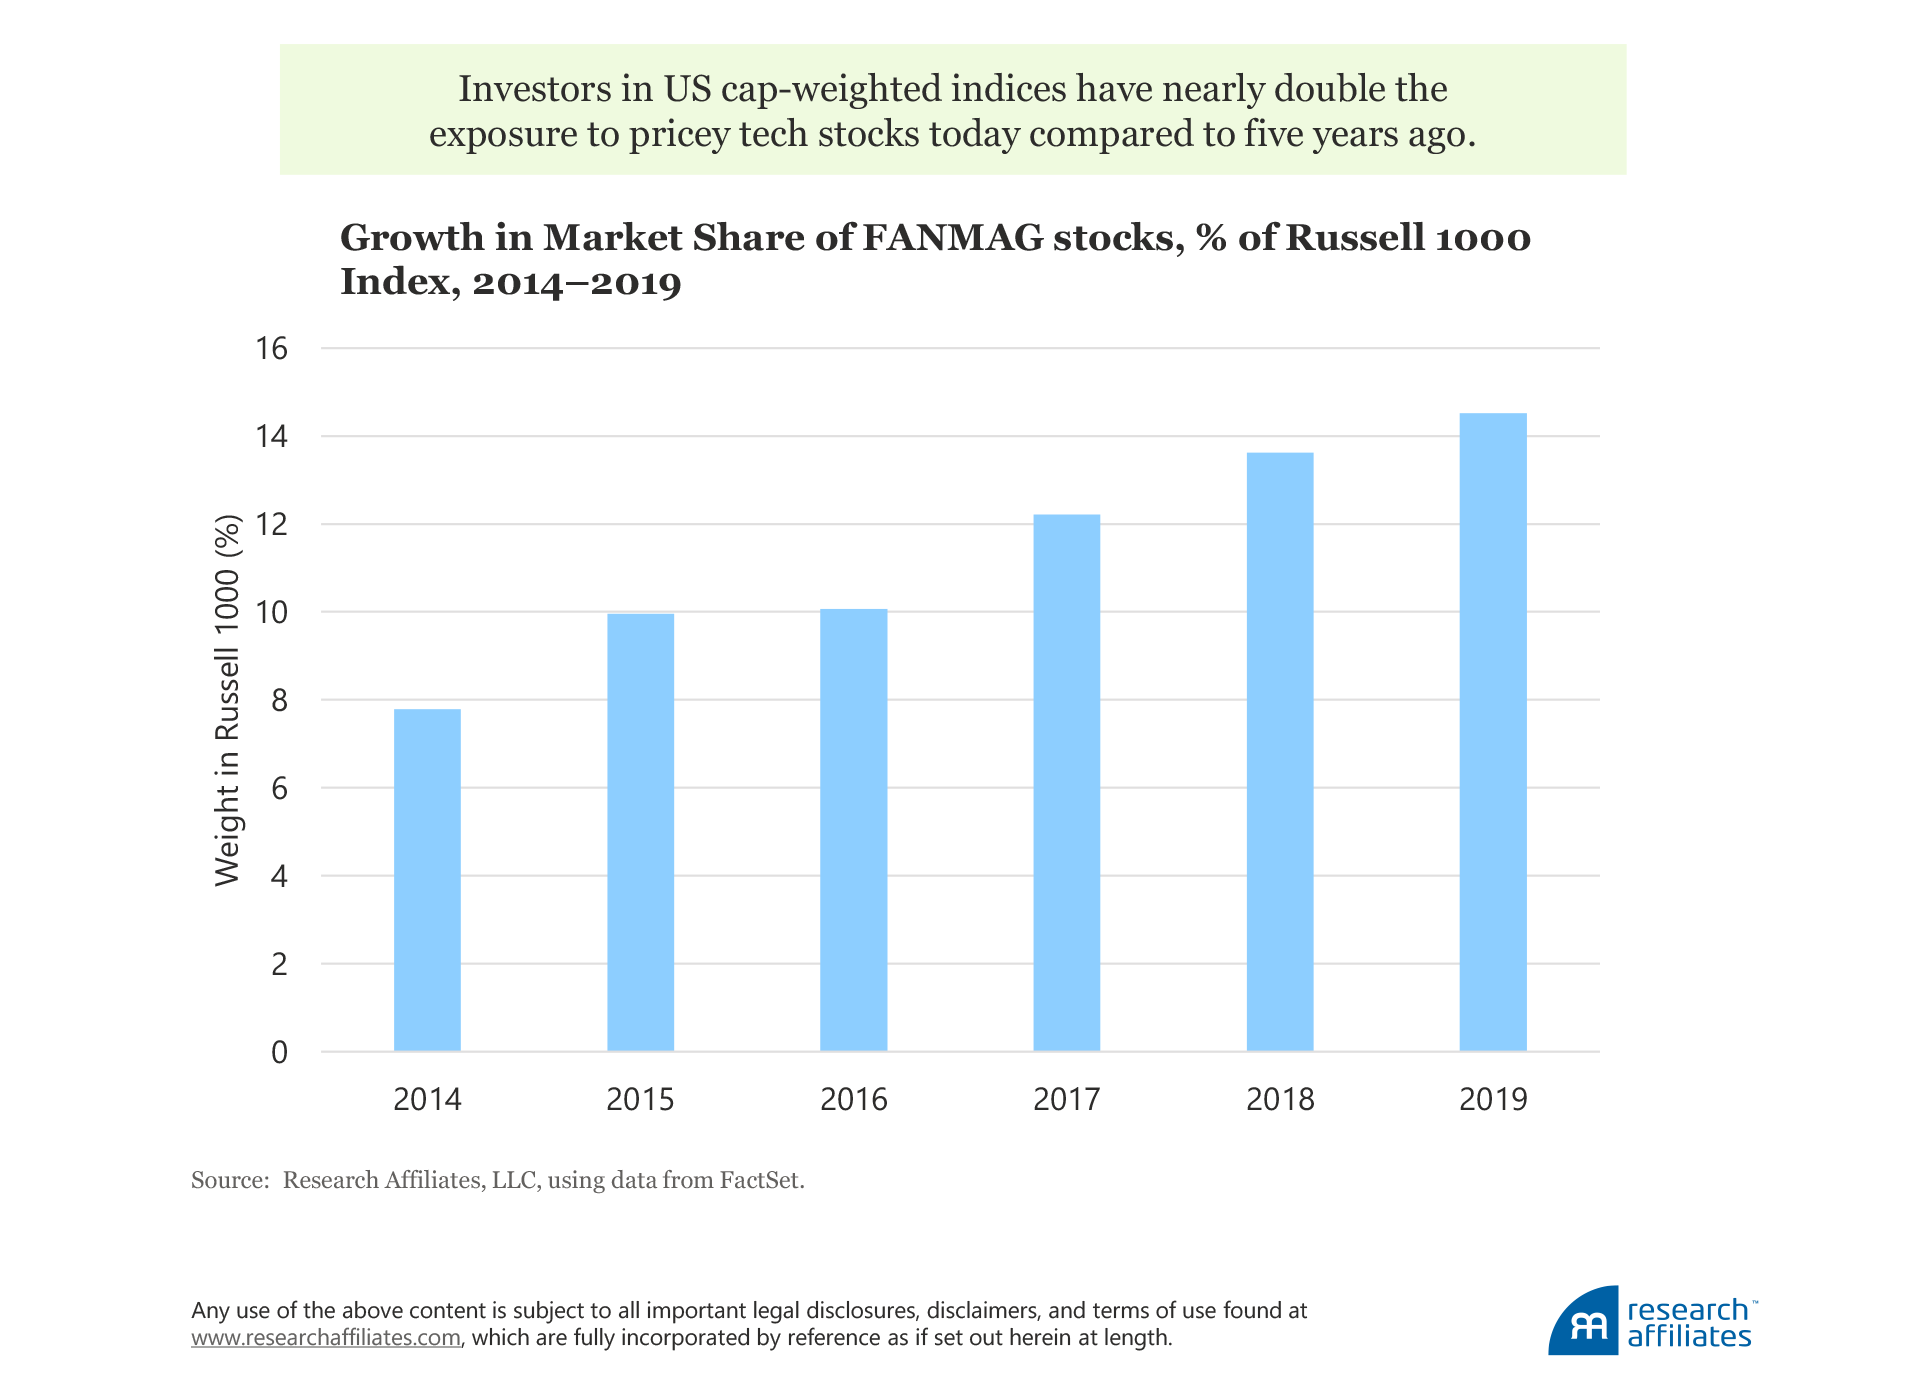
Whereas the bubble is most evident in the large-cap technology stocks, market cap-weighted indices correspondingly rely on these pricey names to drive returns. The more concentrated these top names are within an index, the larger the bet being made on these holdings. The concentration of market weight in these top technology names is at a level not seen since the buildup of the dot-com bubble. The Russell 1000 now commits over 14% of its portfolio to the well-documented FANMAG (Facebook, Amazon, Netflix, Microsoft, Apple, and Google) stocks, a proportion that has nearly doubled since yearend 2014.
The Russell 1000’s 10.5% return over the first nine months of 2018 was led by increasing enthusiasm for the continued record profit growth of the FANMAG group. (Facebook, with its well-documented stumbles, was a noteworthy exception.) These six stocks were responsible for nearly 40% of the Russell 1000’s return over this period, posting an average return of just over 40%. Notably, the list is not cherry picked to be just the top contributors; it includes the impact of Facebook’s negative performance. Even so, the return from these stocks is well above normal levels, although not as dramatic as the return earned by technology stocks during the dot-com bubble in 1999.9
But in the fourth quarter of 2018 the FANMAG stocks lost an average of −21.3%, recovering these losses for the most part in early 2019. Was the market downturn the beginning of a return to sanity or did the recovery signify more good times ahead? It remains to be seen. Such rebounds are not an uncommon occurrence as a bubble unwinds. For example, the NASDAQ plunged −36% from March 2000 to May 2000, only to gain back 35% by July 2000. Of course, this was a mere pause and final exit opportunity before the −58% drop between July 2000 and the October 2002 lows.
The drop in the S&P 500 of over 6% in May 2019 was magnified in the behavior of the FANMAG stocks, which were down nearly 15% for the month.10 The FANMAG stocks’ much larger decline illustrates the sensitivity of share prices to bad news when a stock is priced to near perfection. In some cases, such as Apple, the May 2019 dip moved prices away from bubble levels, but this is far from true across the board. A correction is not a crash, and prices can easily recover. As J.P. Morgan (or was it John D. Rockefeller?) said, “the market will fluctuate” and can make any short-term prognostication look foolish (Ritholtz, 2017).
Bitcoin. Another bubble we explored a year ago was bitcoin. After April 2018 bitcoin also experienced a sell-off and aggressive rebound, although more volatile and rapid than that of the tech stocks. According to Coinmarketcap.com, the universe of cryptocurrencies fell from a peak market capitalization of $828 billion in early January 2018 to $125 billion at the end of the year, an 84% drop and a loss in aggregate paper value of over $700 billion. This loss of wealth is roughly equal to the aggregate GDP of Switzerland, the world’s twentieth-largest economy (and one that ironically boasts a notoriously safe-haven currency). Bitcoin has now staged an amazing 187% recovery through the first half of 2019.11 Is this just volatility or a true bubble? Based on our definition, plenty of bubble indications remain. If bitcoin truly becomes an accepted currency, no valuation “model” for it exists other than what the public chooses to believe it’s worth, much the same as for the dollar or any other fiat currency.12
Similar to Dutch tulip bulbs in 1638, little evidence of fundamental value supports cryptos’ prices beyond the speculation that they will become a well-accepted medium of exchange. Consistent with our definition of a bubble, cryptocurrencies hold little chance of offering a positive risk premium relative to bonds or cash based on a reasonable expectation of future cash flows, which are by definition zero. Predicting near-term price direction is a fool’s errand, but any expectation of a higher price going forward rests solely on the hope of selling to a future buyer at a higher price.
Tesla. In April 2018, we also offered Tesla as an example of a single-asset micro-bubble because Tesla has little chance of delivering the heroic future cash flows needed to service its debt, let alone justify the valuation of its stock. Interestingly, although the company’s valuation is based on explosive growth and profitability that is “just around the corner,” that has been the case for seven years reflecting an ongoing battle between expectations and reality.
Expectations were fueled by a series of dramatic announcements of new products, none of which bore the anticipated fruit: the introduction of solar tiles and the Powerwall on October 28, 2016; the Model 3 delivery event on July 28, 2017; the promise that Tesla would be producing 10,000 cars a week by the end of 2017 on August 2, 2017; and the semi-truck and Roadster 2 reveal on November 16, 2017. These announcements by Elon Musk kept enthusiasm high despite the company’s failure to produce consistent profits. Despite these setbacks, Tesla’s share price was $332 at the start of the new year, but a terrible first quarter of 2019 was a cold shower of reality. Over the first six months of 2019, Tesla’s price fell 32% to $223. The share price first reached this level in January of 2016, so most investors since that time are likely underwater.
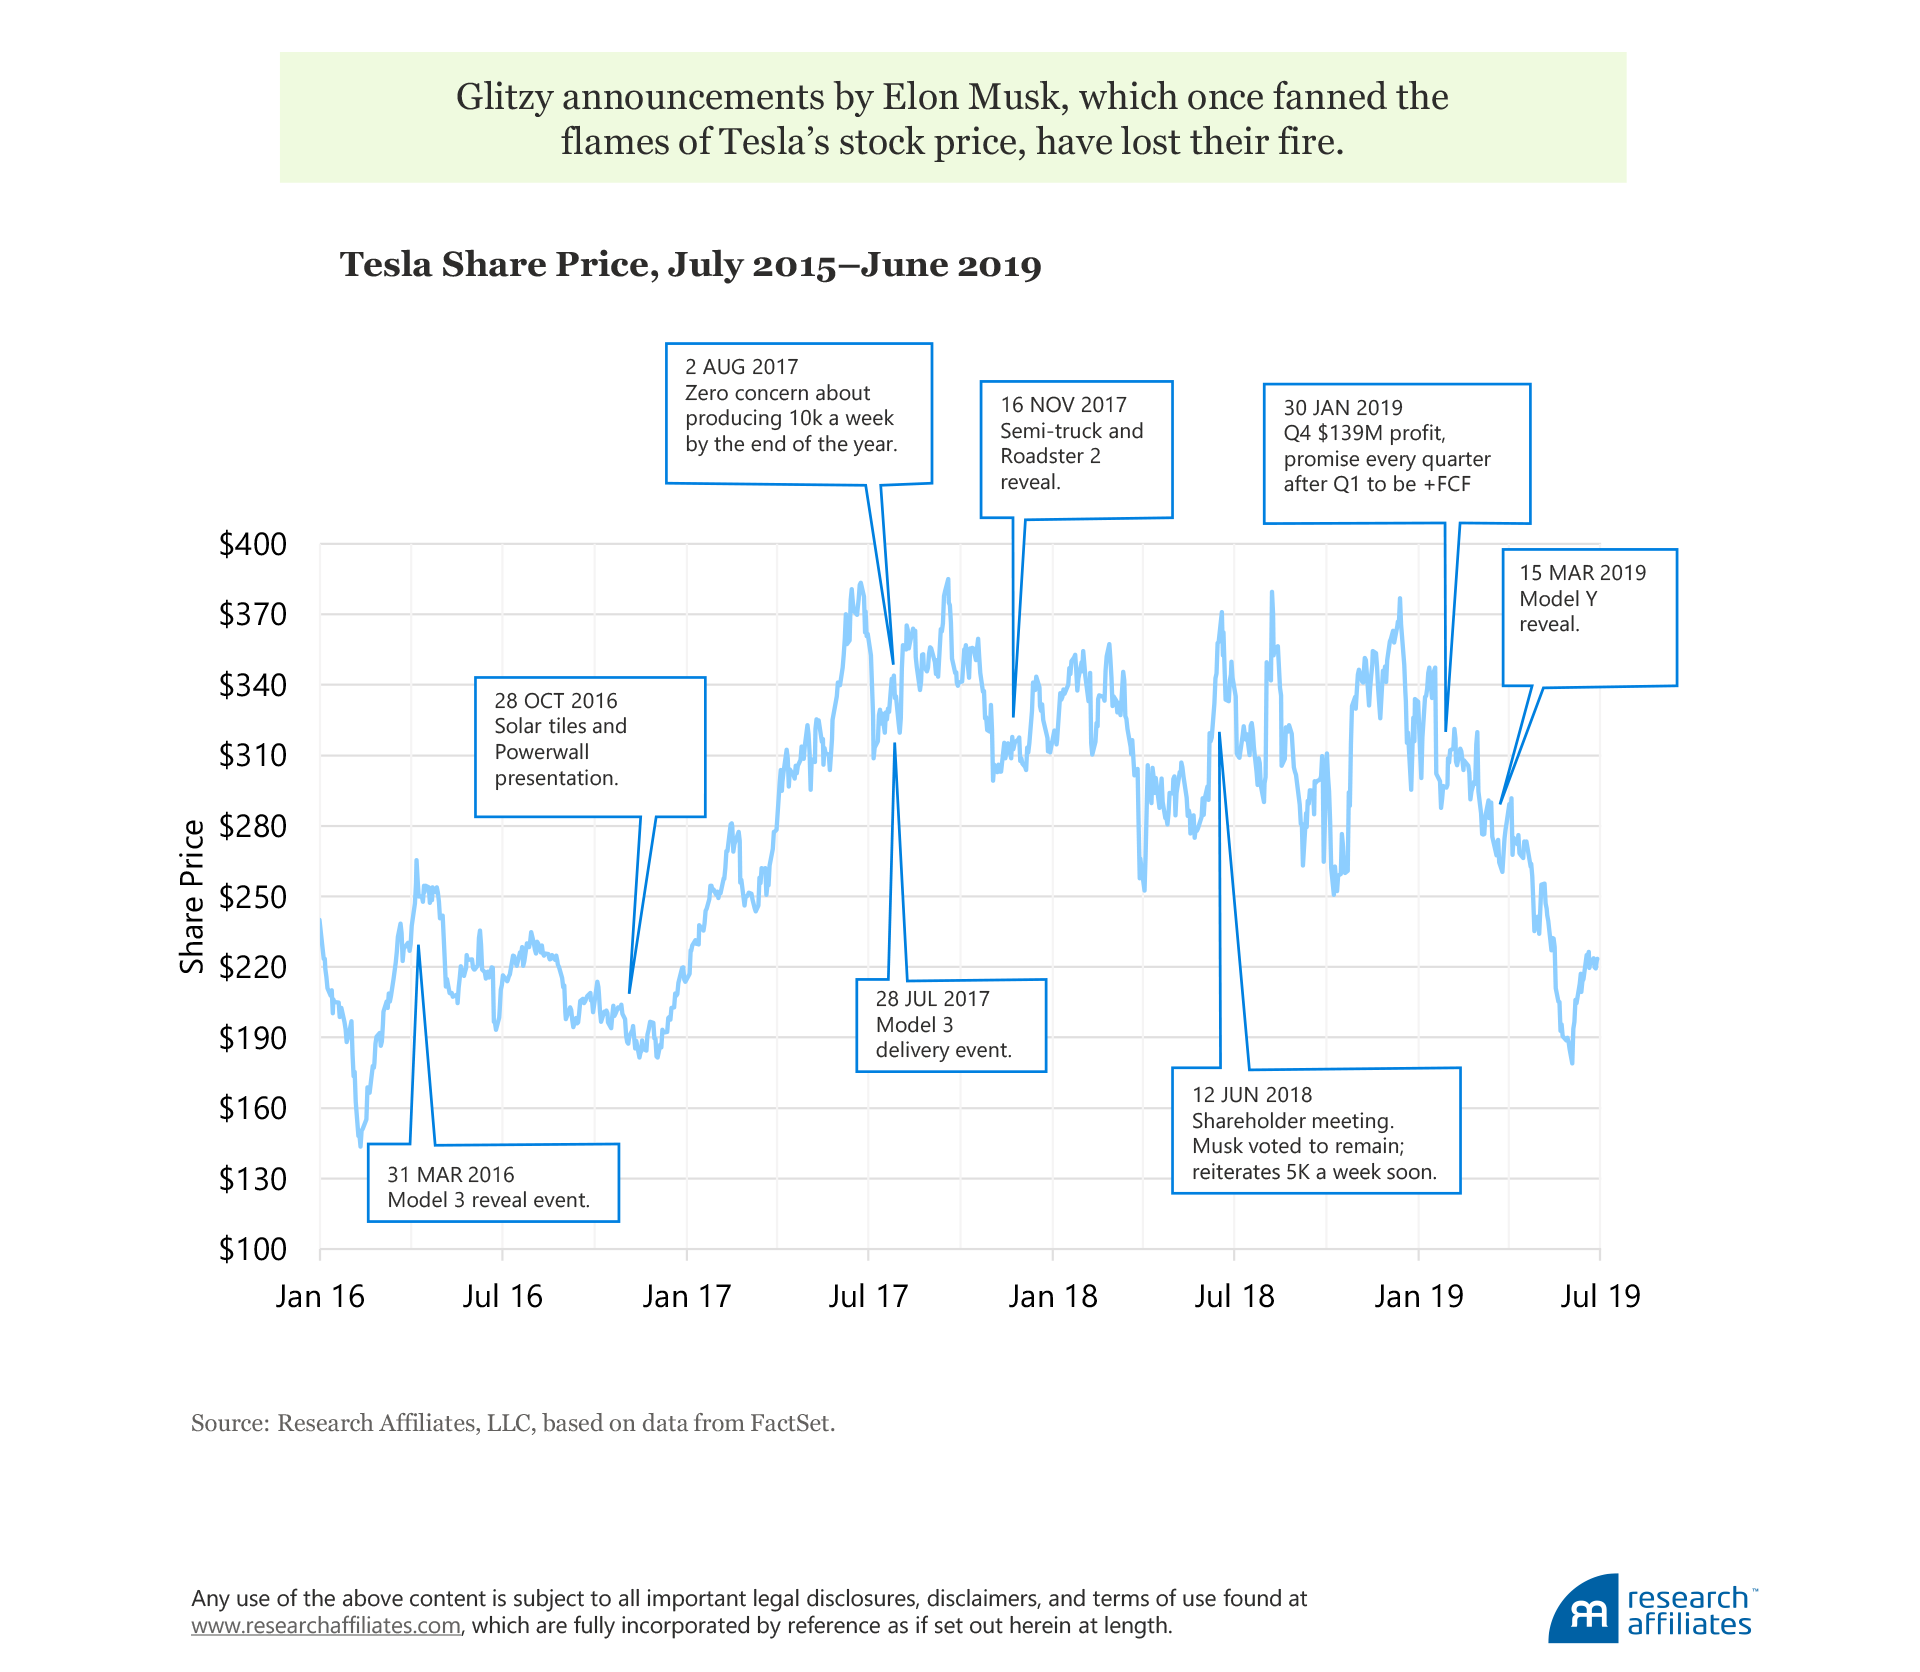
The ability of dramatic presentations to support Tesla’s share price is fading. Neither the Model Y reveal in March 2019 nor the autonomous driving and robotaxi presentation in April 2019 were able to prevent further slides in the share price.13 The Tesla experience illustrates the large challenges in predicting the evolution of bubbles. Expectations can keep prices at bubble levels for years until suddenly the bubble asset loses its magic and the market outlook switches dramatically. For instance, Morgan Stanley, which placed a $379 target price on Tesla shares in October 2017, recently slashed its worst case scenario for Tesla to $10 a share. On May 22, 2019, the Wall Street Journal described how Wall Street was losing faith in Tesla, stating “there is a lot more sizzle than steak to the Tesla story.” It turns out we were not wrong about Tesla, just a few months early. Timing the top of a bubble is an exercise in futility.
Of course, exceptional examples exist of individual companies that beat the odds. Amazon met our definition of a single-asset micro-bubble in 2000, but has proved itself to be the rare company that exceeded the lofty expectations of the 1999–2000 tech bubble. According to our definition, a bubble is present when growth sufficient to justify an asset’s current valuation level is implausible. Implausible is not impossible! There will always be counterexamples. Were there no examples investors could hang their hopes on, bubbles would be unlikely to get started in the first place.
Actionable Steps in Today’s Market
Apart from providing useful definitions of a bubble and an anti-bubble, perhaps the most important part of our 2018 article was our discussion of “So What?” Far from an apathetic disregard of the situation, we gave actionable advice on steps to prepare investor portfolios for the potential bursting of the bubble. These still apply. Our recommendation 15 months ago was to reduce exposure to bubble assets; avoid cap-weighted index funds, which inherently overweight bubble assets; seek exposure to anti-bubble assets or markets that are implausibly cheap; and invest in value-based smart beta strategies, especially in Europe and the emerging markets.
Avoid bubble assets and markets. We have already addressed the current environment for cryptocurrencies, and despite today’s much lower prices, we see little to justify a floor of fundamental value. Our recommendation remains to avoid. We can say the same for Tesla: while the stock has come off its highs, its valuation remains at a point well above that justified by even optimistic expectations of future cash flows. Thus, avoid.14
US technology stocks remain a more nuanced case. As we noted a year ago, Apple and Microsoft flunk our definition of a bubble. In order to justify current valuations, using a discounted cash-flow model (or other valuation model), an investor needs only make aggressive, not implausible, assumptions. Additionally, the marginal buyer includes plenty of investors who rely on a valuation model as part of their decision process. The same cannot as easily be said for Tesla, Netflix, Tencent, or Twitter. The stocks of these companies all arguably qualify as being in bubble territory per our definition. Some even qualify as a “zombie” company, a company with EBIT less than its interest payments. A zombie company needs new capital just to pay the interest on its debt, let alone the contracted principal payments. Others, like Amazon, might or might not currently qualify as bubble stocks; we could make the case either way.
Even in a turbulent market, most of these tech stocks are trading at valuations nearly as rich as they have ever traded. The volatility in the fourth quarter of 2018—and in recent weeks—should serve as a strong reminder of the risk inherent in any investment strategy: the assumptions a strategy is based on must be right in order to derive long-term profit. Bubble-level expectations require near-perfect execution. Another consideration is that many of the new tech companies, notably Alphabet and Facebook, derive their revenues from advertising. The narrative—that these advertising budgets will not be cut in a downturn—is an untested, and perhaps very dangerous, assumption. Advertising is almost always one of the deepest spending cuts in a slowdown or recession.
Is the rebound so far in 2019 a chance for investors to exit prior to a larger drawdown, similar to the opportunity offered investors in dot-com stocks in May 2000? Of course, we don’t have a crystal ball, but we would recommend not betting on the momentum continuing nor on trying to score a big win with a short position. Rather, we prefer to take the simple step of just avoiding the bubble assets we have identified. We interpret the market’s decline in May 2019 not as the end of the story, but as another warning as to what can and likely will happen.
With this in mind, investors also need to be wary of market cap-weighted indices. Because these indices tie their constituent weights to market prices, they take on ever-increasing bets in overvalued securities. As bubble technology stocks have come to dominate the world’s list of largest companies, cap-weighted indices are making de facto bets that these growth-oriented companies can increase their valuations in the face of a slowing economy. Investors can reduce their exposure in this space by turning to smart beta strategies, especially those with a value orientation that breaks the link between prices and portfolio weights.
Find anti-bubble assets and markets. Although an anti-bubble in an individual stock is exceedingly rare, an anti-bubble in a sector or market is more common than most observers might think. Consider the depths of the global financial crisis in 2007–2008. Could the value of any single bank have gone to zero, making any stock price too high? Yes. But could the economy survive without a financial sector? Not really. Going to zero for a sector is highly implausible. Did each bank that failed create an easier environment for the survivors to prosper, a clear runway for them to take off? Yes. Did margins improve for the survivors? Yes. Financial services and consumer discretionary stocks in early 2009 were an anti-bubble. And we said so at the time.
We see a similar situation for value-based smart beta strategies outside the US market, particularly in emerging markets. While emerging markets as a whole trade at much more attractive valuations than the US markets, value strategies within the emerging markets space are poised to deliver an additional 2% to 4% performance advantage over their cap-weighted counterparts.15 A frothy top in the US market doesn’t mean investors need to avoid equity beta altogether, but rather seek out more attractive alternatives to source that equity risk, especially in markets where valuations stack the odds in investors’ favor.
One particular area of emerging markets falls squarely into the anti-bubble camp: unloved and shunned emerging market state-owned enterprises (SOEs). Many investors choose not to own them at any price. Yet many of these entities are earning substantial profits and are trading at levels that require implausible projections to not meet the future cash flows priced into their shares. Yes, there is a real risk of the state expropriating some of those cash flows, but if these SOEs wish to maintain continued access to the global capital markets, they need to continue to return some of the profits to external shareholders. The SOEs and governments that most support growing shareholder rights and the rule of law will be best able to expand their access to global markets.
A representative index of SOEs is not available. Therefore, we made a list of the top 50 SOEs in the emerging markets and examined the valuations of the group. The top 50 are a concentrated portfolio, with over two-thirds of the portfolio’s weight by market cap in Chinese companies, over half in the financial sector, and nearly a quarter in energy. Even so, the value is compelling. These 50 SOEs pay a weighted-average dividend yield of 4.19%, offering a bit of a safety net along with a likely large risk premium. Compare those characteristics to the broad-based MSCI Emerging Markets Index (which includes all of the 50 SOEs as a subset) which has a dividend yield of 2.75%, a modest premium to the MSCI ACWI’s 2.49% yield. This group of SOEs trades at a weighted-average price-to-book (PB) ratio of 1.03, a 36% discount to the MSCI Emerging Markets Index’s PB of 1.61, and at a price-to-earnings (PE) ratio of 8.9, 34% lower than the 13.5 PE of the broader group.
What would it take for one or more of these 50 SOEs to not deliver a substantial risk premium over the next 10 years? The enterprise would have to slash its dividends and stagnate or become materially cheaper. These are large, productive enterprises sitting at the center of strongly growing economies and they currently represent real value. The risk is that the value stops flowing to overseas shareholders—certainly not out of the question, but in our view an implausible outcome.
Within developed markets, we see the turmoil over Brexit potentially creating an anti-bubble opportunity in UK shares, especially if a hard Brexit becomes the odds-on scenario. The MSCI UK Index offers a dividend of 4.52%—even higher than the dividend yield of our basket of emerging market SOE stocks. The market is pricing UK stocks at 13.8x earnings, a full 25% discount to the MSCI World level. UK share prices have been essentially flat since the United Kingdom’s 2016 referendum in which voters opted to leave the EU. Brexit would need to destroy quite a bit of value in order to nullify this compelling risk premium. An overhang of uncertainty is keeping the discount in place. The capital markets hate uncertainty. A resolution in either direction will reduce the uncertainty and should encourage some capital flow back into the UK markets. Investors waiting for that clarity will miss the opportunity.
Conclusion
Consider how the juxtaposition of bubbles and anti-bubbles relates to so-called market myopia. Periodically, the financial press carries articles in which leading executives complain that the market focuses too acutely on short-term performance. Warren Buffett and Jamie Dimon have gone so far as to suggest that companies should stop providing quarterly guidance. But what we are observing today—for both bubble and anti-bubble assets—is just the reverse. Entities, such as SOEs, with large quarter-to-quarter earnings and juicy cash flow are trading at depressed valuations, while market participants are looking past the negative cash flows and massive current losses coming from the Ubers of the world and are rewarding them with sky-high valuations. Could this be a case of market hyperopia?
During the tech peak in 1965 when a concentrated list of a few dozen stocks soared to several times the market multiple, a wit quipped that these share prices appeared to discount not only the future, but the hereafter.16 Isn’t this exactly the case with bubble stocks? And with anti-bubble stocks aren’t the markets tacitly assuming permanent impairment? It takes remarkable hubris to think we can forecast a company’s prospects beyond two or three years. If a company’s share price only makes sense if its business soars, or flounders, for many years to come, we are discounting the hereafter.17 That is a bubble, and the converse an anti-bubble. Neither is as hard to identify in real time as most investors think.
At present, there are many interesting investment opportunities and sensibly priced asset classes. Notwithstanding the experience at the end of 2018, it is exceedingly rare for all risk assets to fall at the same time. As is so often the case, the promising investment opportunities are not the popular and beloved assets of today, but are the ugly ducklings, the unloved, feared, and even loathed assets.
Copyright © Research Affiliates


