
by Craig Basinger, Chris Kerlow, Derek Benedet, Alexander Tjiang, Gerald Cheng, RichardsonGMP
Summary
I. Market recap – One helluva first half
II. Market cycle
a. Interesting times
b. Bonds vs equities – Both cannot be right
c. Market cycle update
III. Fundamentals at risk
IV. Corporate borrowing – Are behaviours changing?
V. Buybacks – A crumbling pillar of strength
VI. Portfolio positioning
I. Market recap – One helluva first half
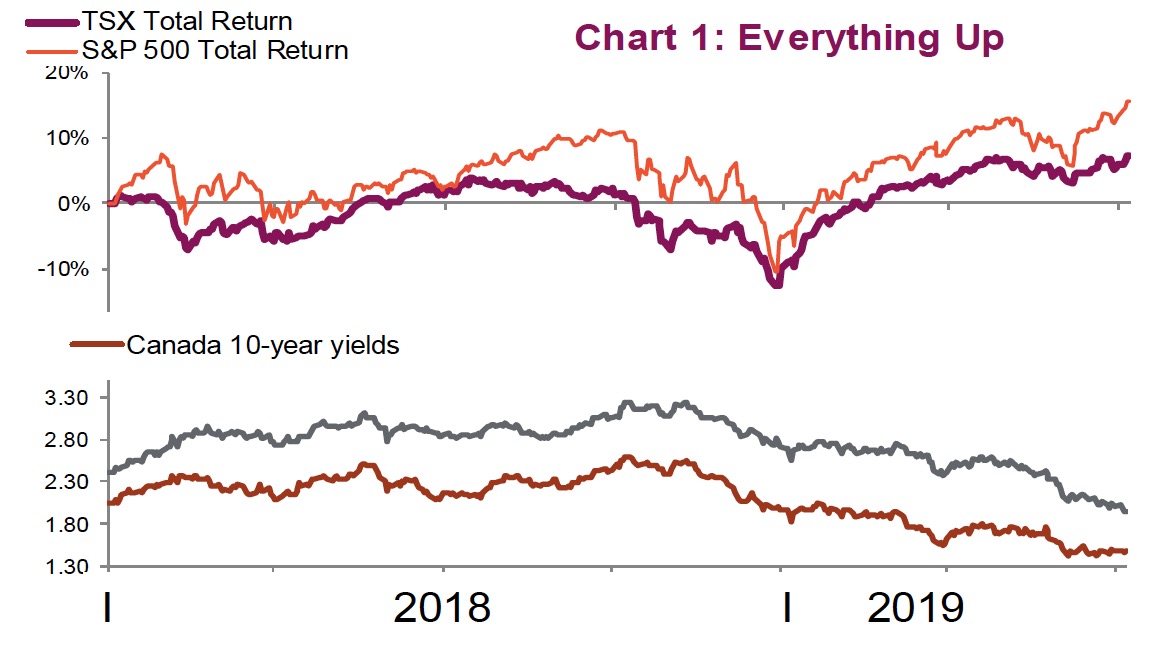
Despite continuous geopolitical noise reverberating through the markets, the first half of the year was exceptional. We’ve witnessed one of the strongest and broadest cross-asset rallies in a decade. The market’s collective consciousness took a slowing global economy in stride and instead adopted an optimistic, glass- half-full mindset rekindled by dovish central bank rhetoric. Markets endured a mild pullback in May only to see the S&P 500 have its best June since 1955 and reached new all-time highs.
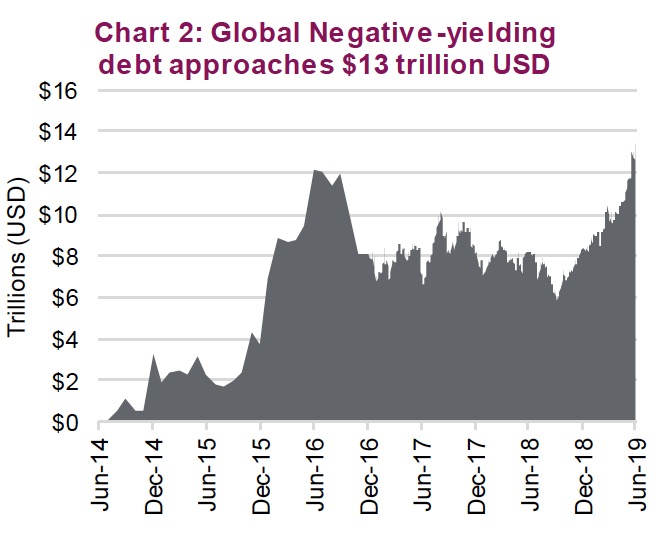
With both bond markets and stocks rallying, it certainly has been the best of times, particularly for investors. The S&P 500 is up 18.5% year-to-date while the S&P/TSX Composite has advanced 16.2%. Bond yields have fallen precipitously during the first half of the year, reaching levels last seen the day after the U.S. 2016 presidential election. While U.S. 10-year yields tiptoe around 2%, European yields are pushing the lower boundary in negative territory. Astonishingly, the aggregate value of negative-yielding global debt is now close to $13 trillion in U.S. dollars. (Chart 2)
The yearn for yield underscores a risk that has emerged for fixed income-oriented investors. The uncomfortable truth for all investors is that yields are near record lows, duration has reached new highs, corporate leverage is elevated, and government deficits are high. All this has led investors to seek yield in non-traditional markets. Whether it’s harnessing the illiquidity premium or non-traditional lending, fixed-income allocations are hardly the defensive portion of a portfolio they once were. Globally, bonds are the most vulnerable they’ve ever been to losses, with rising yields and/or widening credit spreads being the key risks to the downside.
Not all assets went up: the commodity complex has borne the brunt of global growth fears, with energy taking center stage. Despite continued production cuts by OPEC and the supply side being dominated by sanctions on Venezuela and Iran, oil entered a bear market on demand fears after peaking in late April. Metals markets were similarly negatively affected by demand fears, with most markets still struggling. Gold, meanwhile, has benefited from the fall in global bond yields and a softening U.S. dollar, breaching $1,400/oz and reaching levels last seen in 2013.
Still, a visible path forward in the second half remains difficult to see thanks to some rather large question marks that we will explore further in the report. Our world view remains optimistic, though we worry that the market may have already priced in a best-case scenario. One potential risk is that the U.S. Federal Reserve (Fed) eases far less than is currently being priced into the market. The peculiar aspect is that this risk could come about due to the economic data beginning to surprise to the upside. We’ll likely see a more constrained second half, notwithstanding the dovish leanings of central banks. As such, a more defensive approach should continue to serve investors well amid any escalation in volatility.
II. Market cycle
Interesting times
Imagine you have been locked away in the biosphere for a year, cut off from the world with no knowledge of what had been going on in the economy or capital markets. As you emerge, you learn the 10-year Treasury yield has dropped to 2.0%, the yield curve has inverted, and the Fed is expected to start cutting rates aggressively for the remainder of 2019. This information would likely have you thinking we are in a recessionary period, not the 2%+ consensus economic growth or near-record lows in unemployment. You would also probably believe that equity markets are in free fall or, at the very least, have taken a hit. Instead, the S&P 500 now sits near all-time highs. Before you retreat into the biosphere as the world appears to have turned mad, allow us to do our best to explain (if we can).
Despite markets at all-time highs, things are not that rosy. Economic activity has continued to slow down this year as slower growth in emerging markets has trickled into developed markets. Even the U.S. economy, which is less sensitive to global trade, is now feeling the pinch. Adding to this, we have the continued uncertainty from escallating trade tensions. The tariffs themselves are not overly disruptive; it is the increasing uncertainty that they have created. Even recently, some progress between the U.S. and China was replaced with more concerns between the U.S. and Europe. Certainly, uncertainty is not good for global growth or asset prices.
With global growth and inflation expectations falling, other central banks have become more dovish, and the U.S. is following. If they don’t, this could lead to a much stronger U.S. dollar that would slow global growth even more. Plus, with inflation expectations so low, the Fed appears more inclined to err on the side of dovishness over hawkishness. For this we say thanks, as it is helping lift asset prices. It may prove to be the wrong decision longer term, but given how sensitive the economy and markets are to rates, it’s best to tread lightly.
Bonds vs equities – both cannot be right
During the first half of 2019, both equities and bonds have rallied pretty hard. There have been historical periods when both move in tandem; however, they always diverge and an observation of current levels leads us to believe that one will be proven right and the other proven wrong at some point in the near future. Bond prices have risen on the back of slowing economic growth, lower inflation expectations, and very dovish central bankers. Equity prices have risen from oversold levels, evidence the global economy is not slowing too quickly, and have been helped by lower bond yields. The problem now is that for bonds to remain at current prices or move higher, we will need to see continued deceleration of economic growth. If that occurs, the equity markets will not react kindly. Conversely, if economic activity improves or trade tensions ease, bond prices will fall while equity prices will edge higher.
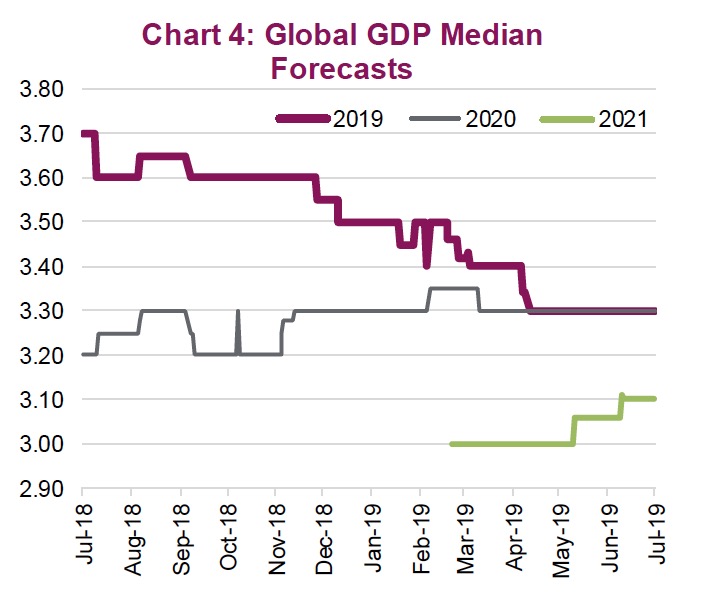
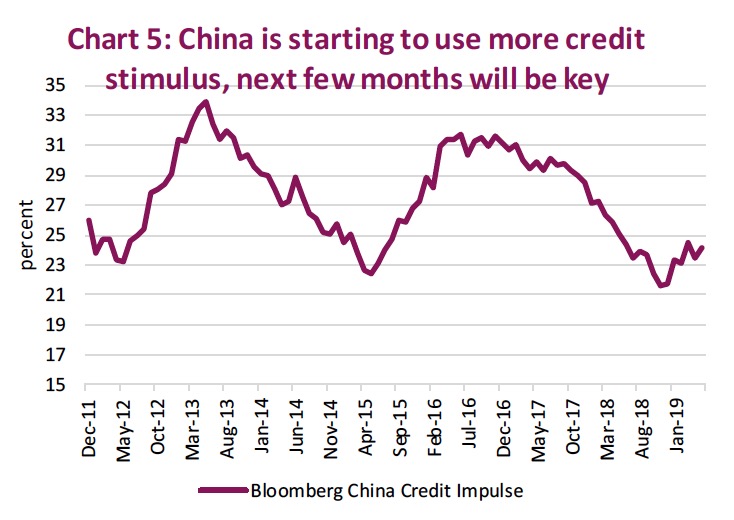
We remain in the second camp of thinking. While economic growth has been slowing, the pace of the slowdown may be abating. The consensus forecast for 2019 and 2020 global GDP has remained stable since late April (Chart 4). This is some evidence that should encourage investors to, at the very least, adopt a cautiously optimistic view that things are stabilizing. Moreover, we have some encouraging signs on stimulus from China that could start to gain traction in the coming months (Chart 5). China’s slowing economic growth was one of the early movers in this economic slowdown. If growth reaccelerates, it could create a similar cascading impact on the global economy, only in the opposite direction – that is, up.
By no means does this imply smooth sailing or growth on the cusp of returning just yet. Global manufacturing is in the dumps according to Purchasing Manager Indices (PMI) in just about every major manufacturing economy. This remains a big soft patch and could easily spill more and more into other parts of the economy. Of the 29 PMIs monitored, none are above 52.5 anymore and only 8 are above 50.
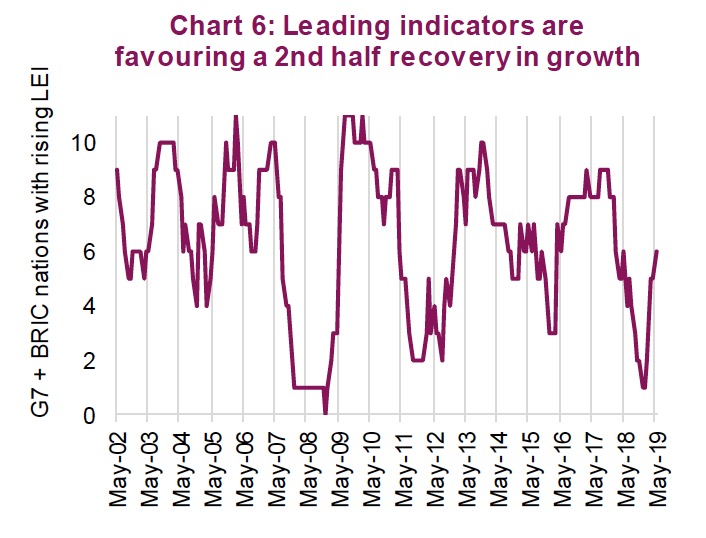
On the positive, the recent decline in bond yields has injected some new life into indicators for the U.S. residential market. Labour remains healthy with low unemployment, wages are rising and with lower yields, and homes are become much more affordable. In addition, the U.S. consumer touts a pretty healthy balance sheet. After a period of weakness, we are finally seeing improving signs for the U.S. housing market. Then, there are leading indicators. We currently see 6 of 11 (G7 + BRIC) economies’ leading economic indicators on the rise over the past month or three-month period (Chart 6). One interesting aspect – not sure if it is good or bad – is that emerging economies (EM) now account for 4 of the 6 positive. The optimistic view is that reaccelerating growth in EMs is good news for the global economy, since global growth started within EMs.
Overall, we are in the camp that while this period of slow growth may persist, lower bond yields, dovish central banks, stimulus from China and the fact that just about every economy continues to expand should provide a better economic environment later this year. That would be good for equities, not so great for bonds. But we must acknowledge that if the data continues to deteriorate, we should all be ready to change our minds. That would make Keynes proud.
Market cycle update
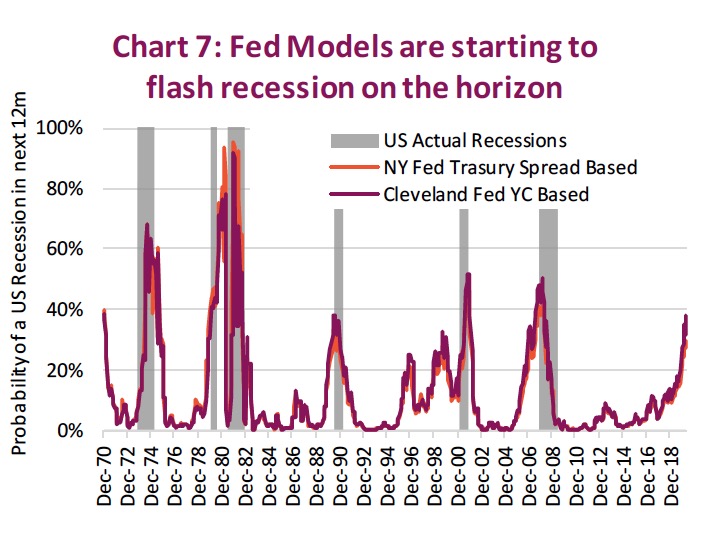
With 10-year bond yields falling from 2.83% a year ago to 2.0%, the ‘bondies’ are clearly signalling a much more tempered economic environment beyond the horizon. Add to this short yields – of the three-month variety – are yielding 2.20%, which makes for an inverted yield curve, another harbinger of trouble. This yield environmnet pushed the New York and Cleveland Federal Reserve Banks’ recession indicators from 11% and 16%, respectively, a year ago to a more troubling 30% and 38% today (Chart 7). This isn’t good news, but remember these are all based on Treasury yields and nothing else.
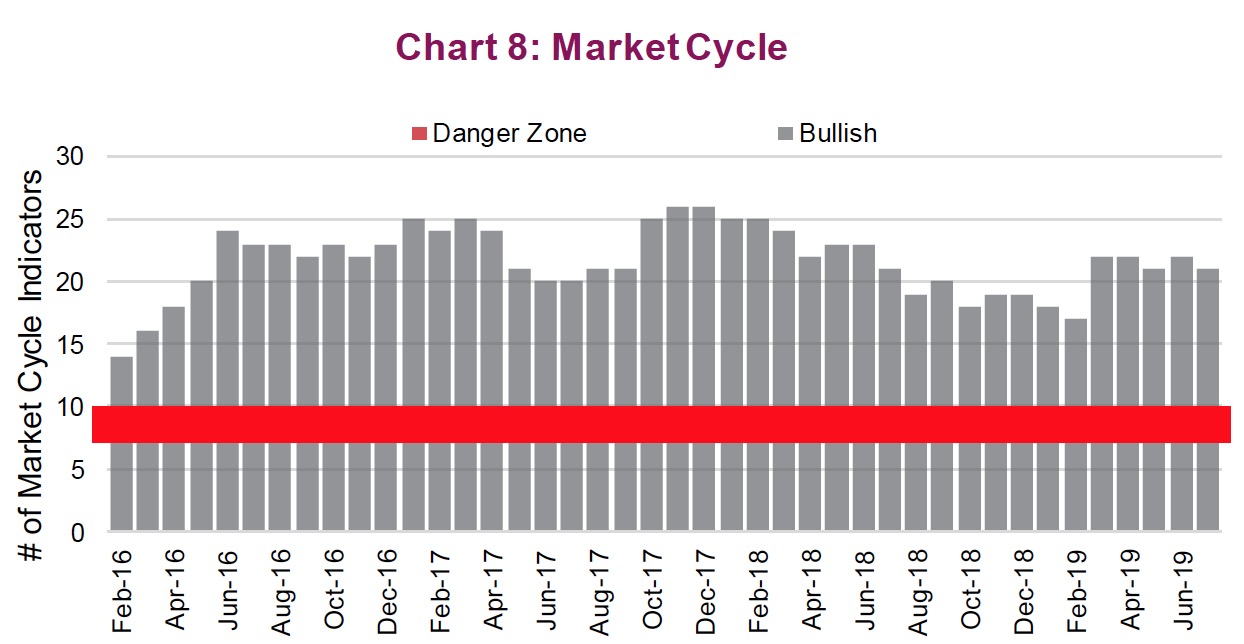
We are not implying our Market Cycle framework is better than these Fed banks; afterall, they have many more PhDs than we do. However, we prefer the use of multiple inputs. The Market Cycle uses 30 indicators that include the likes of yields and the yield curve, plus economic, commodity, momentum, and fundamental indicators. At the moment, we have 21 of the 30 indicators remaining bullish, which is well above the danger zone of 10 or less (chart 8).
Digging into the indicators, Market Momentum and Fundamentals remain tilted towards the bullish side. Rates are clearly bearish. Meanwhile, economic data is more mixed, with the U.S. economy tilted with more bullish signals and the global economy on the softer side.

Despite the softening data, however, our Market Cycle framework continues to favour a continuation of the current bull market cycle. This is additional evidence that bonds may be wrong.
III. Fundamentals at risk
The S&P 500 has had a great 2019, making all-time highs and advancing 18.5% as of the end of June. Of that gain, 1.2% came from dividends, 0.8% came from earnings growth (aka very little), and +16.5% came from multiple expansion as P/E levels rose from 14.4x to 16.8x. It is possible we could see more multiple expansion in the back half of the year (but that will be a big ask). Nonetheless, we are now at valuation levels observed before the Q4 correction started. Throughout this cycle valuations have repeatedly topped out at the 17x-18x range. That means it may be up to dividends, which we can probably count on another 1.2% of gains, and earnings growth to carry us into higher territory. This is where things get tricky.
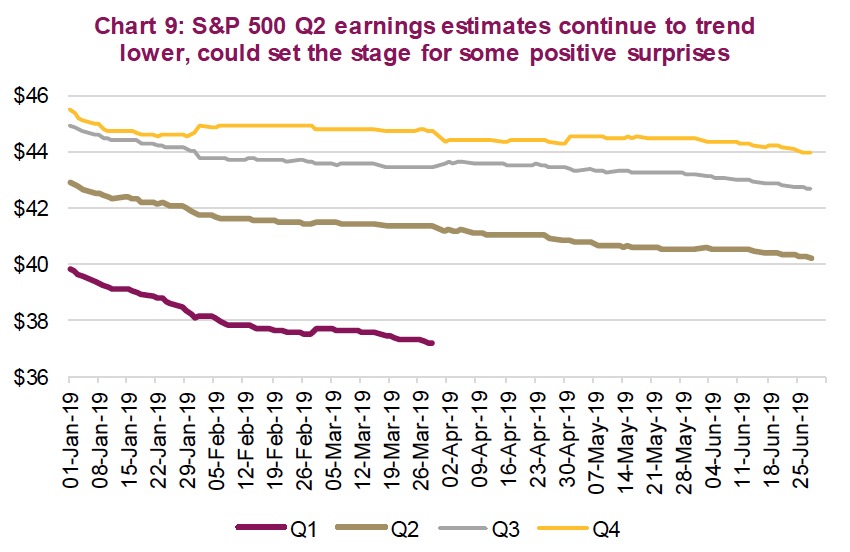
Current S&P 500 consensus bottom-up earnings estimates for Q2 and Q3 represent only 3.3% and 2.6% growth, respectively, over the same quarters last year. While Q4 forecasts a healthy 25% earnings growth, let’s not get hasty and bank on that just yet. The estimates for the coming quarters continue to be revised lower, and we have observed a rising trend in negative pre- announcements. This might make positive earnings surprises more plentiful, although from more cautious forecasts, negative revisions are not encouraging (Chart 9).
It may become even more troubling. S&P 500 margins have remained relatively stable and near cycle highs. However, margins among small cap-focused indices have been falling. This could be due to smaller companies having less bargaining power when it comes to wages, which would result in crimping margins. Furthermore, aggregate sales growth is slowing. It is much easier to maintain healthy margins when sales are rising faster, but it becomes more difficult when things slow down.

From a fundamental perspective, it isn’t looking all that great. Rising margin pressures, falling sales growth, more negative pre- announcements, expensive valuations (Chart 10), and markets at all-time highs – these amount to a risky combo.
IV. Corporate borrowing – Are behaviours changing
Like the game of Jenga, it is easy to make a move at the start without worrying the tower will topple. Over time, however, each additional move becomes increasingly precarious and worrisome, such that any move might be the one that costs you the game. Whether it is Jerome Powell and the Fed, U.S. President Donald Trump’s Twitter account, or an accumulation of easy moves early in the game by corporate America, what brings an end to this economic expansion is hard to say. What we do know, however, is that we are 10 years plus into this bull market, the easy money seems to have been made (alright, maybe it wasn’t easy money), and with each passing day we inch closer to an inevitable end of the cycle.
During the past decade we have observed corporations across the globe add $5 trillion of debt to their balance sheets while concurrently announcing roughly equal amounts in share repurchase programs; in fact, announced buybacks in 2018 totaled $1.1 trillion. The liberal approach to levering up corporate balance sheets was a well-known consequence of central banks reducing lending rates to spur growth. The resulting lower yields enticed companies to borrow, invest and grow, thereby creating jobs and helping bolster economic activity. Increased borrowing, at the consumer or corporate level, helps drive the economy. Lower yields also pushed investors to reach farther for yield, creating a ready buyer of corporate bonds. But corporate behaviours may be changing.

As with every economic expansion, companies inevitably add debt; however, we note that the pace and magnitude of debt accumulation this cycle has been elevated. The overall net debt across S&P 500 constituent companies has been rising rather quickly since 2012, but in the most recent year this trend has slowed. This can also be seen in debt issuances that ran at very elevated levels for years; these too have slowed in the last full calendar year (Chart 11). Could corporate America be in the first innings of a pivot from debt accumulation to deleveraging or, at the very least, slower leveraging? In the high-yield debt market, issuances related to refinancing and debt repayment has reached a post-crisis high of ~80%, suggesting that net-new issuances are declining.
Hence, despite bond yields and spreads back down to rock-bottom prices, corporations don’t seem to be responding by piling on debt like they did in past years. From an individual company level, this would constitute healthy behaviour. De-lever the balance sheet and capital structure stabilization will yield future financial flexibility. Thus, we have increasing concerns that over-levered corporations could be especially hard hit in the next recession and corporate credit could be “ground zero”. This has led us to place larger emphasis on the liability side of the balance sheet and incorporating debt ratings and default probabilities into our fundamental analysis.
Few would really blame a company for wanting to become slightly more financially conservative from a balance sheet perspective amid slower earnings growth, late-cycle timing, the uncertainties surrounding trade and a plethora of other concerns. Moreover, the market appears to be rewarding deleveraging efforts. Debt accumulation to drive share buybacks is becoming less a driver of share price performance (see the next section). The acquisition landscape appears to be changing as well. We experienced many years during which it was common for the acquiring company’s share price to rise following an announced acquisition. Of course, the target would go up as well, and often to a higher degree. This certainly emboldened many companies to add debt and seek acquisitions. However, since early 2018, this trend appears to have ended. The share price of a target company still rises, but we are seeing the acquiror’s share price fall on takeover announcements. That makes it less appealing to go out and buy one of your competitors, as can be seen in the 7% drop in mergers and acquisitions so far this year.
An individual company that reduces financial leverage is often viewed as a good thing, but what is good for the goose is not good for the gander. If corporations start to de-lever or slow credit expansion en masse, lower economic activity and a not-so-friendly feedback loop will likely follow. While we still believe we are in the late innings of this cycle and there is still money to be made in equity markets, the credit market may prove to be ground zero for when this cycle ends.
V. Buybacks – A crumbling pillar of strength?
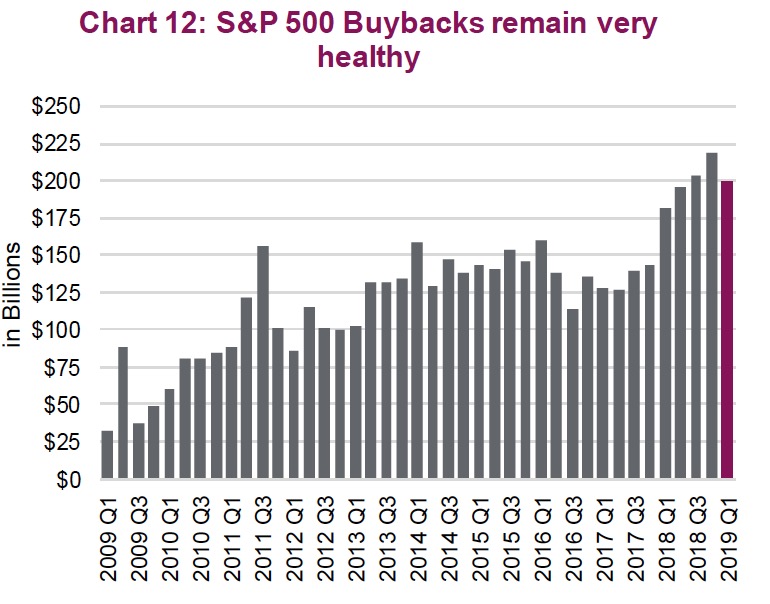
Few would deny this market cycle has been helped along, at the equity level, by the rising trend of share buybacks. 2018 was the year of the buyback, with S&P 500 companies repurchasing about $800 billion of their own shares. If that sounds like a big number, it is. For some context, Morningstar measured $207 billion flowing into equity ETFs in 2018. 2019 has seen a minor dip in activity so far, which would be expected as last year was goosed by tax cut savings that executives passed along to shareholders. This is the first quarterly decline in buyback activity in the past two years (Chart 12). Interestingly, Apple alone accounted for over 10% of that total, buying back $23.7 billion worth of its own stock. From a sector standpoint, technology companies accounted for a little over $66 billion of total buybacks for the quarter.
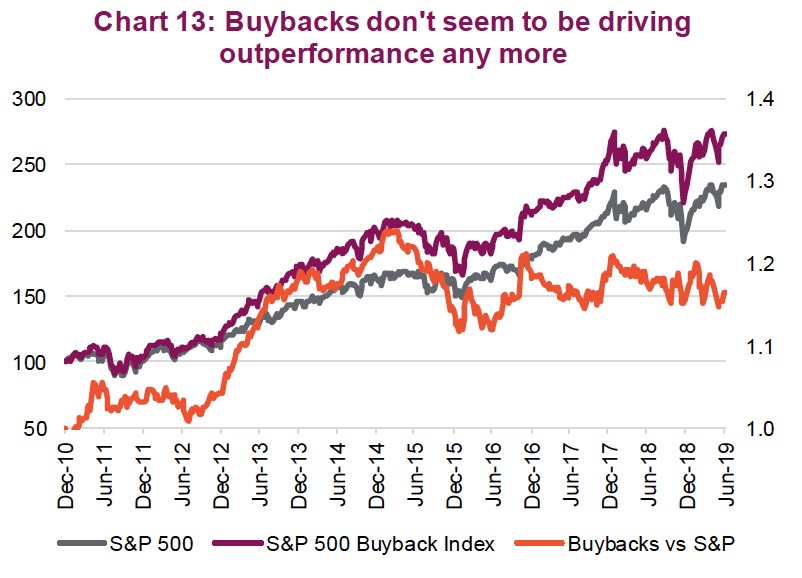
It also appears the market is beginning to reward companies less for their buyback activities. Chart 13 is both the S&P 500 and the S&P 500 Buyback Index. The Buyback Index is designed to measure the performance of the top 100 stocks with the highest buyback ratios. What is apparent is that despite 2018 being the year of the buyback in dollar terms, 2012/2013 represents the golden years of buyback outperformance. Investors just don’t seem to be rewarding companies embarking down the buyback road like they used to.
Stock buybacks are also increasingly becoming a future political issue, with some Democrats running in the 2020 presidential primaries voicing plans to restrict stock buybacks. Tax cuts increased corporate profits, but companies used a lot of that money to buy back stock. Owners of stock are typically characterized in an aura of affluence, so the move was largely seen as a giveback to the rich while employees failed to reap any expected benefits. To garner voter support, Democrats are promising to affect a certain type of influence upon companies that will force benefits upon employees. If companies begin to ease up on additional buybacks, this may potentially reduce a key structural pillar of support for the market. Though the pillar is still standing, it appears the foundation is beginning to get washed away.
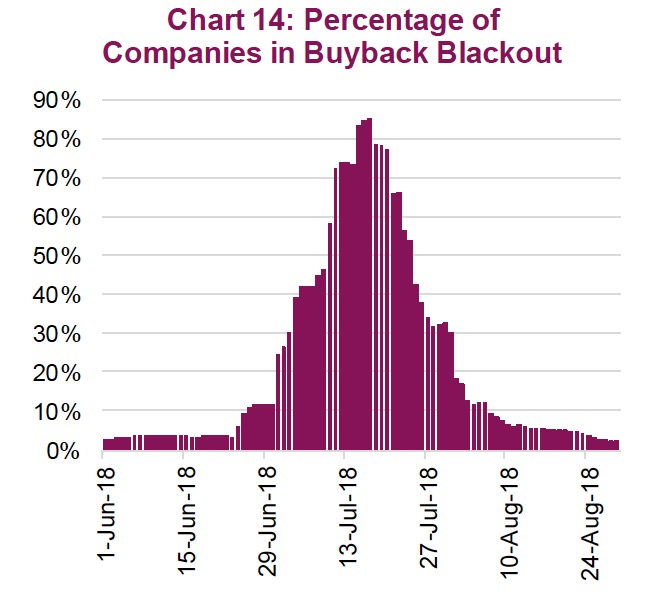
With earnings growth slowing, a rise in negative earnings pre-announcements, margin pressures rising and the lift from tax cuts rolling off, buyback activity may see declines in the quarters ahead. Given the sheer volume of buyback activity, any changes could easily translate into more volatile share prices. Add to this the seasonality of buybacks driven by “blackout” periods during earnings season, under the right (or wrong) circumstances this could lead to a period of equity market weakness (Chart 14).
VI. Portfolio positioning
While we clearly have a more cautious tone compared with the last few quarters, and even believe we could be at risk of another correction/bout of equity weakness in the coming months, we do not believe this market cycle is on its last legs. The economic data has been soft but does not appear to be falling off a cliff; in fact, it is starting to show some signs of stabilization. Given the low yield backdrop and dovish central banks, if the data does improve, we could see a much healthier back half.
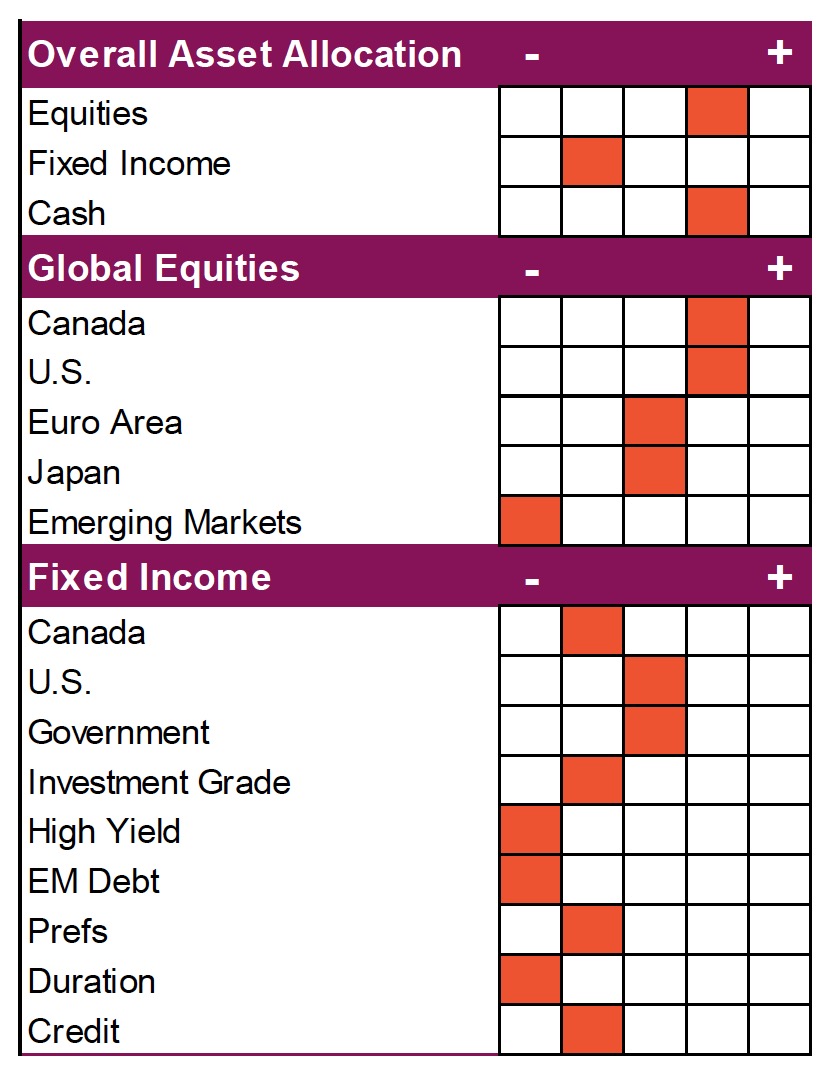
This has us remaining mildly overweight equities with a focus on Canada and the U.S. Indeed, we believe U.S. equity markets will continue to lead this cycle, until it ends that is. Canada is a bit more nuanced. Valuations are attractive, and our economy has enjoyed a good first half. In fact, our data has been decent relative to expectations. Longer term, however, we are concerned about the reliance on construction/housing and ongoing issues such as pipeline constraints.
International developed markets are market weight with no exposure to emerging markets. EM could do well if China continues to add stimulus and improve growth, but that would also benefit our mild overweight in Canada. Our concern about EM is the age of the cycle and level of corporate debt. Rest assured though, our longer-term plan has us being more active in EM and international markets after the next bear.
On the bond side, we remain cautious given low yields and low corporate spreads. Yes, this is boring, but we are staying short and high quality. Sorry, not much yield but then again in this world yield tends to come more and more from equities, not bonds.
In summary, we may see a summer correction or weakness followed by strong fall markets. Of course, if the economic data continues to weaken, we are going to change our minds.
*****
Charts are sourced to Bloomberg L.P. unless otherwise noted
This publication is intended to provide general information and is not to be construed as an offer or solicitation for the sale or purchase of any securities. Past performance of securities is no guarantee of future results. While effort has been made to compile this publication from sources believed to be reliable at the time of publishing, no representation or warranty, express or implied, is made as to this publication’s accuracy or completeness. The opinions, estimates and projections in this publication may change at any time based on market and other conditions, and are provided in good faith but without legal responsibility. This publication does not have regard to the circumstances or needs of any specific person who may read it and should not be considered specific financial or tax advice. Before acting on any of the information in this publication, please consult your financial advisor. Richardson GMP Limited is not liable for any errors or omissions contained in this publication, or for any loss or damage arising from any use or reliance on it. Richardson GMP Limited may as agent buy and sell securities mentioned in this publication, including options, futures or other derivative instruments based on them.
Richardson GMP Limited is a member of Canadian Investor Protection Fund. Richardson is a trade-mark of James Richardson & Sons, Limited. GMP is a registered trade-mark of GMP Securities L.P. Both used under license by Richardson GMP Limited.
RichardsonGMP © Copyright July 8, 2019. All rights reserved.