by Liz Ann Sonders, Senior Vice President, Chief Investment Strategist, Charles Schwab & Co
Key Points
- U.S. stocks are cheering the weekend trade truce in their latest march to new highs.
- Since early 2018, the S&P 500 has made little headway, but with a lot of interim lows and highs.
- Cyclicals led the market during last year’s first half, but have since given way to more defensive leadership.
During this holiday-shortened week, my report will be brief (you’re welcome). As I put this report to bed, markets are cheering the latest trade cease fire between the United States and China. Whether the truce ultimately leads to a comprehensive trade deal is yet to be seen; but for now, U.S. stocks continue to don their rally caps after the best June for the S&P 500 since 1955, and best first half since 1997.
Third time’s a charm?
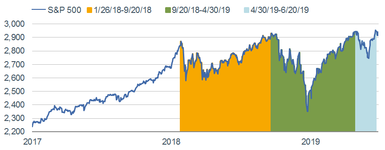
The latest break-out to new all-time highs for the S&P 500 is the third major peak since January 2018; which was marred by a correction in early 2018, a near-bear market in late 2018 and an ugly May 2019. As my colleague Omar Aguilar has been highlighting, the past 18 months feels like a roller coaster ride, with lots of steep ascents and descents, and loopty loop or two—with riders getting off at the same place they got on.
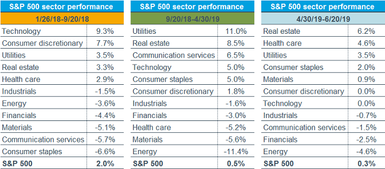
Looking under the hood of the market’s engine yields some interesting changes during the three round-trips, which are shown in the first chart below. As you can see in the accompanying tables, the first round trip—starting in January 2018 and ending in September 2018, leadership was quite cyclical. Technology and Consumer Discretionary stocks were the big sector winners—more than doubling the performance of the more defensive Utilities and REITs sectors, and trouncing the negative-returning and defensive Consumer Staples sector. The second round trip, which ended at the end of April this year, saw Utilities and REITs take the lead; with ultra-cyclical sectors like Energy and Materials bringing up the rear. Fast-forward to the latest round trip (currently through June 20, but today’s strength puts a new high in the cards as of this writing), and you see continued defensive leadership, with REITs and Health Care at the top, and Energy remaining the biggest laggard.
Three Round Trips


Source: Charles Schwab, Bloomberg, as of June 28, 2019.
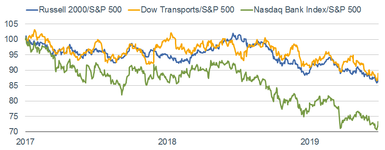
Another distinctive characteristic of the past 18 months is the lack of “confirmation” by small cap stocks, the transportation stocks and the bank stocks. Technicians like to look for those segments of the market to confirm the advance of the overall index. Just last week, all three indexes hit relative lows within days of the S&P 500 being at a new high, as you can see in the chart below. According to SentimenTrader, this is highly atypical and has historically not been a great sign for the market overall.
Non-Confirmations

Source: Charles Schwab, Bloomberg, SentimenTrader, as of June 28, 2019.
Since the mid-1980s, there were only two other periods when the aforementioned non-confirmations occurred—July 1990 and July 1998. Subsequent returns were not pretty: the S&P 500 was down double-digits one-to-two months later. Of course past performance is no guarantee of future results—and the sample size is tiny—but it may be a warning to curb some enthusiasm.
Living large
The underperformance by small caps is no surprise to us and has been fairly persistent over the past 18 months; with a reprieve during the first few months of last year. We remain tactically overweight large caps and tactically underweight small caps. The rationale continues to be small caps’ much higher debt and lower liquidity levels, less-nimble positioning with regard to the trade war, lower quality earnings/revenue characteristics, and weaker breadth statistics.
Key earnings season
Once this week’s holiday festivities conclude, the market will be embarking on second quarter earnings season. Investors and analysts are likely to key in on what company managements say about the impact of the trade war and global economic slowdown on their own bottom lines. The consensus estimate from Refinitiv for second quarter S&P 500 earnings growth is a meager 0.2%; with only a slight lift to 0.7% expected for the third quarter. The silver lining as we head into earnings season is that companies have been offering some positive guidance, so it’s certainly possible we could continue to skirt an earnings recession.
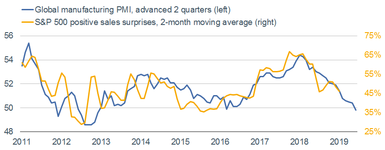
But top-line growth is unquestionably under pressure courtesy of the weak global economy and the trade war (which are related of course). The global Purchasing Managers’ Index (PMI) has been weakening for 14 straight months. As you can see in the chart below, the PMI (advanced two quarters) has historically had a close correlation to sales surprises for S&P 500 companies. This is yet another message about curbing enthusiasm.
Weak Global Growth Bodes Ill for Corporate Sales

Source: Charles Schwab, Bloomberg, Cornerstone Macro, as of May 31, 2019.
In sum
Over the past 18 months we have been recommending that investors remain tactically neutral to U.S. stocks, and use the market’s ongoing ascents and descents to rebalance around longer-term strategic equity targets. Late-cycle phases bring heightened risks; and notwithstanding the latest march to new highs, we continue to recommend investors don’t get out over their (water) skis.
Copyright © Charles Schwab & Co


