by Liz Ann Sonders, Senior Vice President, Chief Investment Strategist, Charles Schwab & Co
Key Points
- Investor sentiment has cracked and is moving toward extreme bearishness; though not quite to levels suggesting a clear contrarian opportunity.
- Sentiment can be measured by gauging investors’ attitudes; but importantly, by also looking at investors’ behaviors.
- Households’ exposure to equities suggests muted returns over the next decade.
Although trade remains top of mind for markets, my prior biweekly report was a comprehensive look at that topic (albeit before the latest Mexico salvo); so I’ll tackle a related topic today, which is how investor sentiment has fared through the latest market volatility and weakness.
Let’s start with the indirect message of sentiment being sent by the bond market. My colleague Kathy Jones, who is our Chief Fixed Income Strategist, had this to say in a note out Sunday evening: In comparison to a malfunctioning car, she noted that the “bond market has been flashing warning signs that we’re due for repairs since late last year, but the Fed and other markets were largely ignoring the red lights until recently.” Further, the “drop in real long-term yields is the clearest signal from the market that growth expectations are falling as the market prices in the risk of a recession.”
This has contributed to the inversion (again, like in March) of the 10-year Treasury minus 3-month Treasury yield curve—by more than 20 basis points presently—which has further alarmed investors. In fact, the market now is pricing in interest rate cuts beginning in September of this year; while the S&P 500 is down more than 6.5% from its late-April high.
Impact on investors’ psyche
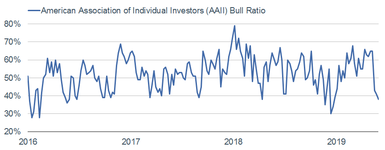
One of the most widely watched attitudinal measures of investor sentiment is generated by the weekly survey by the American Association of Individual Investors (AAII). It’s a simple weekly poll of their members gauging what percentage are bullish vs. bearish (there is a neutral category as well); and it’s been running continuously since 1989.
The chart below shows AAII’s latest “bull ratio” (the ratio of bulls to bears), and as you can see, it’s fallen off a cliff lately. Fewer than 25% of AAII investors now call themselves bullish, while more than 40% are bearish. It’s one of the lowest ratios in five years.
AAII’s Bulls Pull in Their Horns
Source: Charles Schwab, American Association of Individual Investors (AAII), as of May 31, 2019.
The ratio is especially low given the relatively mild pullback in stocks so far. SentimenTrader (ST) looked back at periods in history with a similar profile. By last Wednesday’s close—when the AAII survey closes, the S&P 500 was still within 5% of its 52-week high. Looking at every week’s “bull ratio” with those same background conditions, last week’s was one of the most extreme historically. What ST found in the past was that further weakness was seen sporadically over the next month or two, but then tended to dissipate thereafter—with 95% positive readings a year later for the 20 prior times these conditions occurred. A notable exception was in 2015, when investors pulled in their horns just as the market was embarking on a very rough patch.
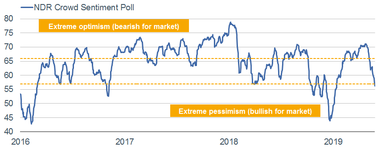
AAII is among seven sentiment indicators that make up the Ned Davis Research (NDR) Crowd Sentiment Poll (CSP), which represents the psychology of a broad array of investors. The other components include Investors Intelligence, CBOE Put/Call ratios, Rydex bull/bear fund assets, MBH Commodity Advisors Daily Sentiment and other surveys of investors and traders.
As you can see below, it too has recently plunged—moving from the “extreme optimism” zone which accompanied the late-April highs to the “extreme pessimism” zone just recently. This is relatively good news based on history, though not yet in the best zone.
Sentiment Dips Into Extreme Pessimism
Source: Charles Schwab, Ned Davis Research (NDR), Inc. (Further distribution prohibited without prior permission. Copyright 2019(c) Ned Davis Research, Inc. All rights reserved.), as of May 30, 2019.
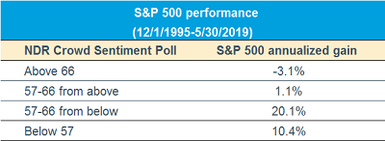
The table above shows the contrarian nature of sentiment at extremes, with market returns being weakest when investors are most optimistic. The contrary has an interesting wrinkle though. Also seen in the table above, the best zone for stocks is not while sentiment remains in the “extreme pessimism” zone, but when it has clawed its way out of that zone and moves up into the neutral zone. In other words, we may have to experience more market downside to trigger a better reading on this model.
Much of what is shown above represents attitudinal measures of sentiment; but there are also behavioral measures. A couple of them are captured in the CSP—the put/call ratio and Rydex flows—but there are others that I track as well.
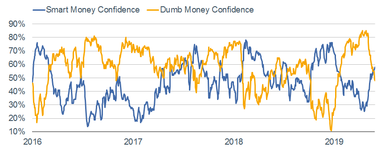
One that is a perennial favorite among readers is ST’s “Smart Money” and “Dumb Money” Confidence readings (see their definitions in the footnote below the chart shown below). As of May 1, Dumb Money Confidence hit a high rarely seen in history; yet shortly thereafter—in keeping with the rollover in stocks—the spread between Dumb Money and Smart Money started to converge. The market’s decline since late-April was enough to finally push Smart Money above Dumb Money as the two groups are changing their mentality from hedging to covering (the Smart Money); and from being extremely long to reducing their exposure (the Dumb Money).
Smart Money Crosses Above Dumb Money
Source: Charles Schwab, SentimenTrader, as of May 31, 2019.
The cross seen above marked the first occurrence in four months. That’s one of the longer streaks over the past 20 years according to ST. The longest streaks historically were typically during the starts of bull markets however—not typically this long into an existing bull market.
With one major exception, these crosses were mostly good signals for stocks, although continued weakness tended to be concentrated in the subsequent month. The exception was in 2000, when it triggered right at that cycle’s peak, leading to more than a 30% loss over the next year. The sooner we see Dumb Money retreat closer to 30%, the less likely further major losses will occur according to historical precedent (although past performance is no guarantee of future results).
Finally, there are two other behavioral measures of investor sentiment—fund flows and households’ positioning in equities. On the former, the latest data from the Investment Company Institute (ICI) shows that equity mutual funds suffered an outflow of more than $42 billion in April alone—one of the largest losses ever for a single month. What’s especially notable according to ST is that while investors were yanking those funds out of stocks, stocks were still rising at the time and the S&P 500 was firmly above its 12-month moving average.
The near-term results for stocks after prior occurrences like this were mixed; with a couple of notable times when investors’ contrary sense paid off: in July 2011, and more recently in January 2018. Both times, stocks struggled immediately and continued to suffer hefty pullbacks. But those were the exceptions; and looking at the subsequent one-year returns for the S&P 500 after 19 prior signals since the mid-1980s, 95% of the time, returns were higher.
Finally, we can look at households’ exposure to equities, as seen in the chart below. Partly due to some record-breaking outflows last December, households’ allocation to stocks has pulled back to about 52% from its recent near-record (which was 62% right at the market’s top in March 2000). That still puts exposure in the top quintile; and as you can see in the accompanying table below, it suggests a curbing of enthusiasm about equity market returns over the next 10 years.
Households’ Exposure to Stocks Dips From High
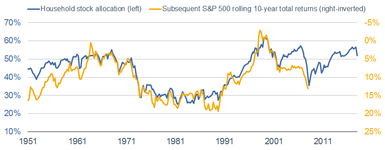
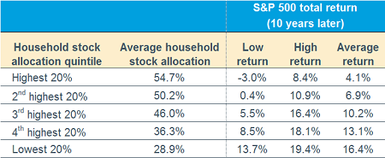
Source: Charles Schwab, FactSet, Ned Davis Research (NDR), Inc. (Further distribution prohibited without prior permission. Copyright 2019(c) Ned Davis Research, Inc. All rights reserved.), as of December 31, 2018. Equity allocation (includes mutual funds and pension funds) is % of total equites, bonds and cash.
In sum, we are beginning to see signs of a ramping of pessimism tied to the latest market weakness and concerns about recession. It may not be enough yet to suggest a contrarian case for a near-term bottom, but it may not take much additional weakness to get there given the heightened sensitivity toward even mild pullbacks. Longer-term though, an objective look at households’ exposure to equities suggests the likelihood of the next 10 years looking as good as the past 10 years is fairly low.
Copyright © Charles Schwab & Co


