by Craig Basinger, Derek Benedet, Chris Kerlow, Alexander Tjiang, RichardsonGMP
The active vs. passive debate has been raging for years now and there’s no denying the data of recent years certainly favours passive. Based off the annual SPIVA report from S&P, 2018 was no different. Only 36% of large cap U.S. equity funds managed to best the S&P 500. The chart below outlines the success in this broad category over the past couple decades.
To set the stage, active management is a fund that has a portfolio management team that is actively investing based on their investment process, endeavouring to beat the market or applicable benchmark. While beating is often viewed just from a performance perspective, many managers attempt to beat on a risk-adjusted basis. They balance performance and the amount of volatility a fund experiences over time.
Passive is usually implemented with an exchange traded fund (ETF) that tracks an index. These are usually market cap weighted indices and the investment process is replaced by how the index is constructed and rebalanced. It’s worth noting that not all ETFs are passive and not all funds are active, it depends on the investment mandate.
It’s pretty clear from the chart that over the past few years, actively managed funds have had a poor showing. One could excuse active management’s poor performance during a strong bull market run. Cash is a drag on performance in up markets and the S&P 500 has no cash management to handle from investors adding or redeeming. But 2018 was a down year, which should have been a better year for active.
Actually, looking back at down years (2000, 2001, 2002, 2008 & 2018), active management certainly did not dominate passive. There is more at play here than just active vs passive.
It’s more of a style thing
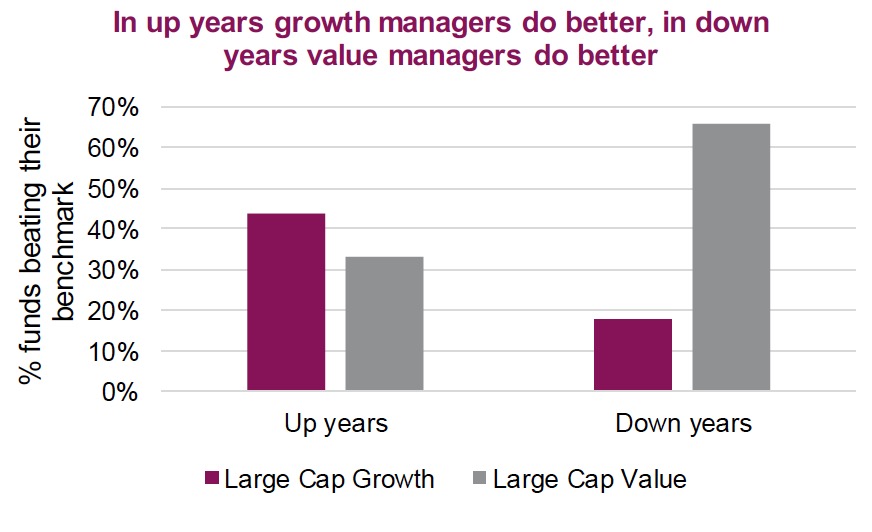
Grouping all large cap funds and comparing to the S&P 500 may be a tad unfair as some managers are focused on growth or higher momentum companies and some are more focused on value investing. While in totality, funds appear to not protect well in down markets, value managers tend to do much better than growth.
The top chart is how well value and growth managers perform relative to their benchmarks in up and down years. In up years, growth managers have an edge over value but this reverses very materially in down markets. We do not know if 2019 will prove to be an up year, but it is off to a great start. However, if you believe we are approaching a bear market, this may be a good reason to focus more on value investing over growth.
Or could it all just be a momentum thing
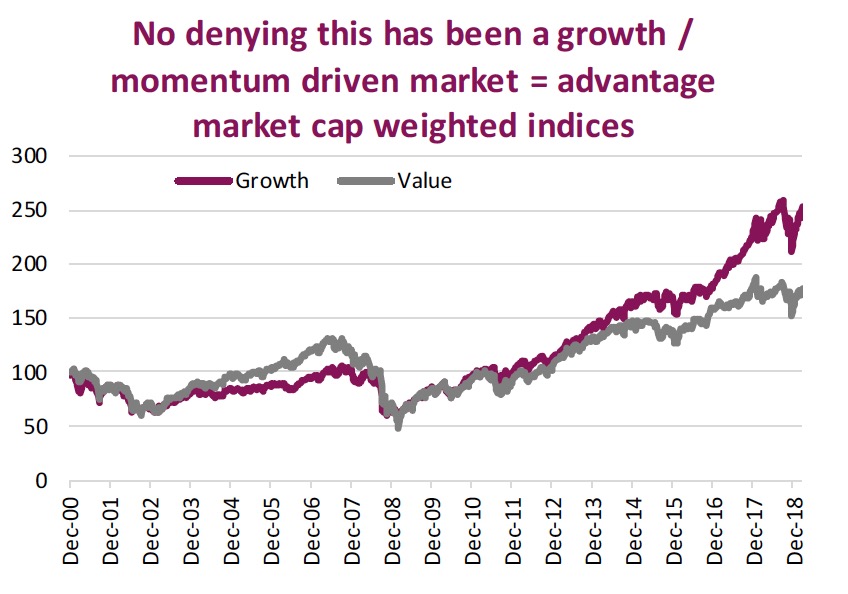
Most indices that passive ETFs attempt to replicate and benchmarks active managers try to beat are market capitalize weighted. Companies with a larger market cap carry a heavier weight in the index. For the S&P 500 for instance, Microsoft has a 3.9% weight, Apple is 3.7% and Amazon is 3.1%. There is nothing wrong with this methodology, though it can lead to greater risk. Everyone loves the Canadian banks but the big five carry a weight of over 21% of the TSX. That’s heavy, given the lack of other large market cap companies in Canada.
Market cap weighted indices and passive ETFs should do better in a momentum-driven market, especially if the momentum names are a bigger weighting in the index. This late in the market cycle, the index is certainly more heavily weighted to momentum/growth names relative to value. This does give the advantage to more momentum/growth strategies, including market cap weighted indices. But for those who know momentum investing, when the turn occurs, they often get crushed.
Active vs passive
We never believed this to be a binary debate. Passive provides great broad market exposure at a very attractive cost. Active, depending on the strategy, provides a different exposure, which is the crux of diversification. Combining a passive ETF that is more tilted towards momentum and an active value manager for diversification continues to be the best of both worlds. Given the choice of the current mix today, we are left considering the S&P 500 has appreciated 365% from the 2009 lows and is currently more momentum- tilted than most years past. We would tend to tilt a bit more towards non- momentum strategies.
This publication is intended to provide general information and is not to be construed as an offer or solicitation for the sale or purchase of any securities. Past performance of securities is no guarantee of future results. While effort has been made to compile this publication from sources believed to be reliable at the time of publishing, no representation or warranty, express or implied, is made as to this publication’s accuracy or completeness. The opinions, estimates and projections in this publication may change at any time based on market and other conditions, and are provided in good faith but without legal responsibility. This publication does not have regard to the circumstances or needs of any specific person who may read it and should not be considered specific financial or tax advice. Before acting on any of the information in this publication, please consult your financial advisor. Richardson GMP Limited is not liable for any errors or omissions contained in this publication, or for any loss or damage arising from any use or reliance on it. Richardson GMP Limited may as agent buy and sell securities mentioned in this publication, including options, futures or other derivative instruments based on them.
Richardson GMP Limited is a member of Canadian Investor Protection Fund. Richardson is a trade-mark of James Richardson & Sons, Limited. GMP is a registered trade-mark of GMP Securities L.P. Both used under license by Richardson GMP Limited.
RichardsonGMP © Copyright 2019. All rights reserved.


