


by Jurrien Timmer, Director of Global Macro, Fidelity Investments, LinkedIn: jurrien-timmer-fidelity Twitter: @TimmerFidelity
2018 was the year of the reset; 2019 is looking better to me.
Key takeaways
• A brief 20% drawdown in December triggered a familiar fight-or-flight response from investors, locking in losses in the process.
• Cash proved the best house in an expensive neighborhood in 2018, something we almost never see.
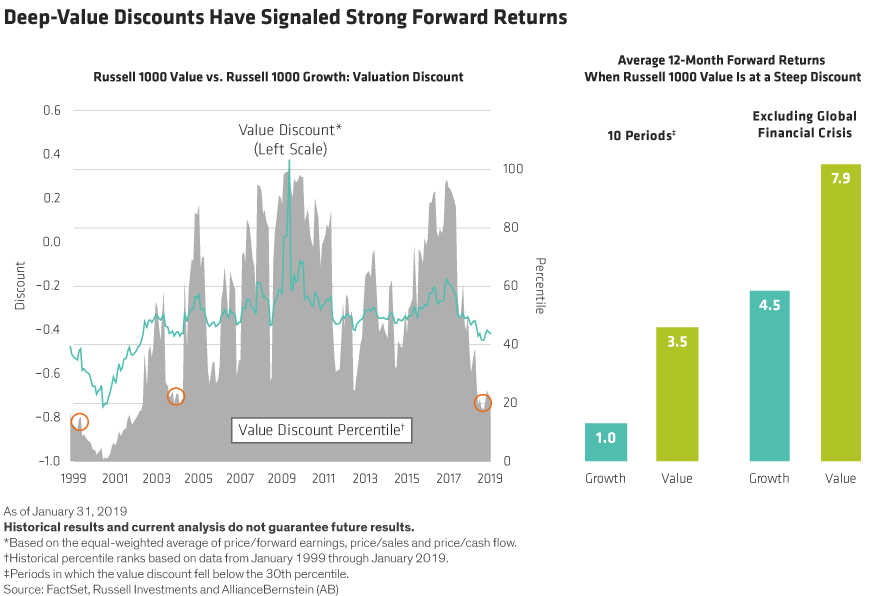
• With the S&P 500® down 20% and valuations down 30%, the market has priced in a lot of bad news and, in terms of the risk/reward balance, is now providing potentially better compensation for an uncertain future.
Loss aversion is an essential survival tool that is very much a part of the human condition. After all, our fightor.flight response comes in handy should we happen to find ourselves face-to-face with a large bear in the woods.
But when it comes to the financial markets, our tendency to want to “get out” whenever things go the wrong way can be detrimental to our financial health. This is why having a solid investment plan, sticking to it through thick and thin, and rebalancing on a regular basis is the way to go for most long-term investors.
When the stock market declines 5%, we tend to dismiss it as noise. When it falls 10%, we get a little nervous but explain it away as a “healthy correction” that hopefully will prove short-lived. But when that 10% turns into a 20% drop and the headlines start blaring “Bear Market!” it’s in our nature to want to sell when we should probably be considering the opposite (in the form of portfolio rebalancing).
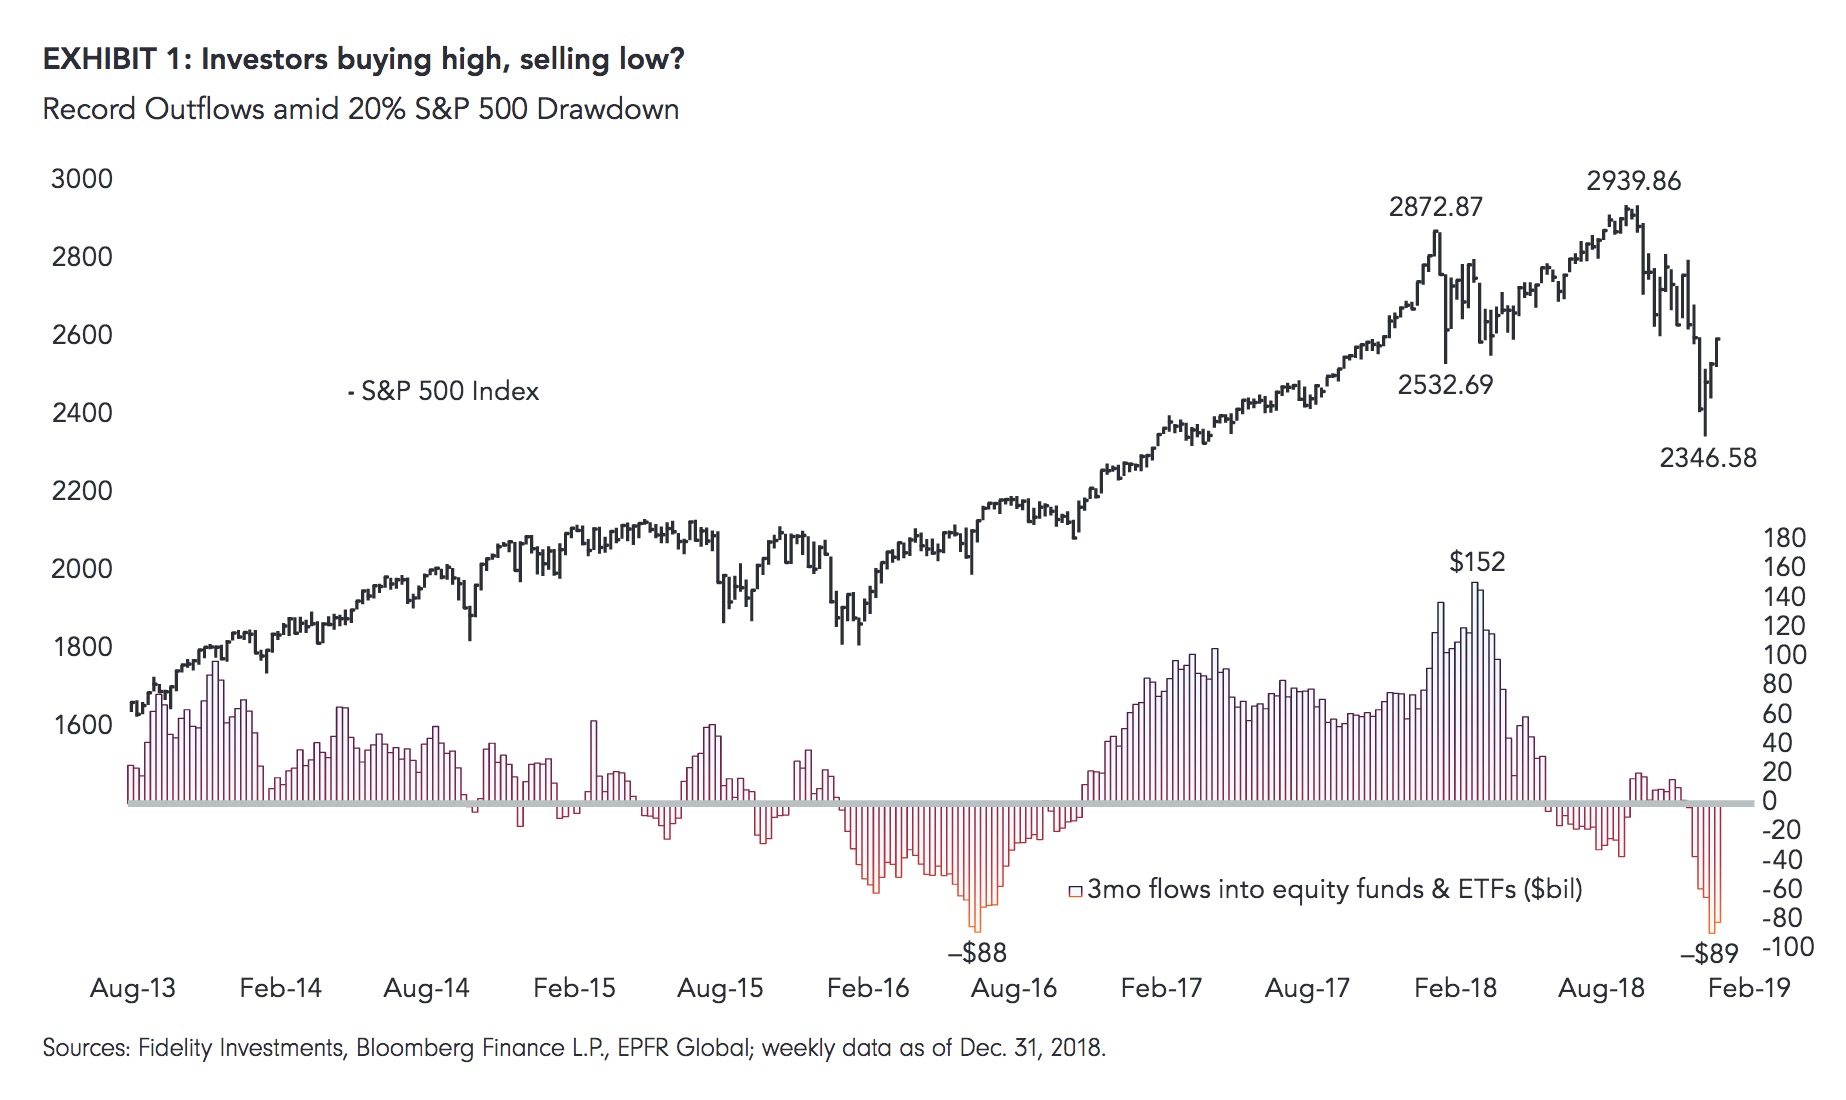
I mention this because the S&P 500® just logged a 20% drawdown, as measured from the 2940 high on October 3 to the 2347 low on December 26. And true to form, investors sold $83 billion worth of equity funds and ETFs in December (Exhibit 1). That’s a record outflow, according to data from EPFR Global. That 20% drawdown lasted only a New York minute, and subsequently the S&P 500® rallied 10% in just a few weeks. In other words, investors locked in $83 billion worth of losses. This is an unfortunate example of how market timing can cause many investors to underperform market indices over time.
So what caused the violent downturn in Q4?
During the past three months, the stock market got hit by a trifecta of negative conditions. First, a (justified) valuation de-rating of the price-to-earnings, or P/E, ratio on the basis of slowing earnings growth (driven partly by trade) and tightening financial conditions (due to actions by the U.S. Federal Reserve). The situation was made worse by the liquidation of crowded positions in the growth/momentum space, which in turn was further exacerbated by a lack of liquidity in the markets. In my view, the confluence of these three factors turned an otherwise sleepy 10% correction into a chaotic 20% drawdown.
My view at the beginning of 2018 was that the stock market would be stuck in a twilight zone for some time, unable to pull out until 2019. That part was right, but I did not see the 20% drawdown coming. I thought that the 10% retracements in late January and again in October would be all we would experience. But what was and is clear to me is that 2018’s poor returns across all long- term asset classes were a testament to the fact that, since the 2007–08 financial crisis, the era of quantitative easing (QE) has suppressed risk premiums and thereby elevated valuations and returns among long-term assets. Now that QE is in reverse (with the Fed raising rates and shrinking its balance sheet), risk premiums have come back down to earth for risk assets such as equities and credit—not so much for Treasuries, though, at least not yet.
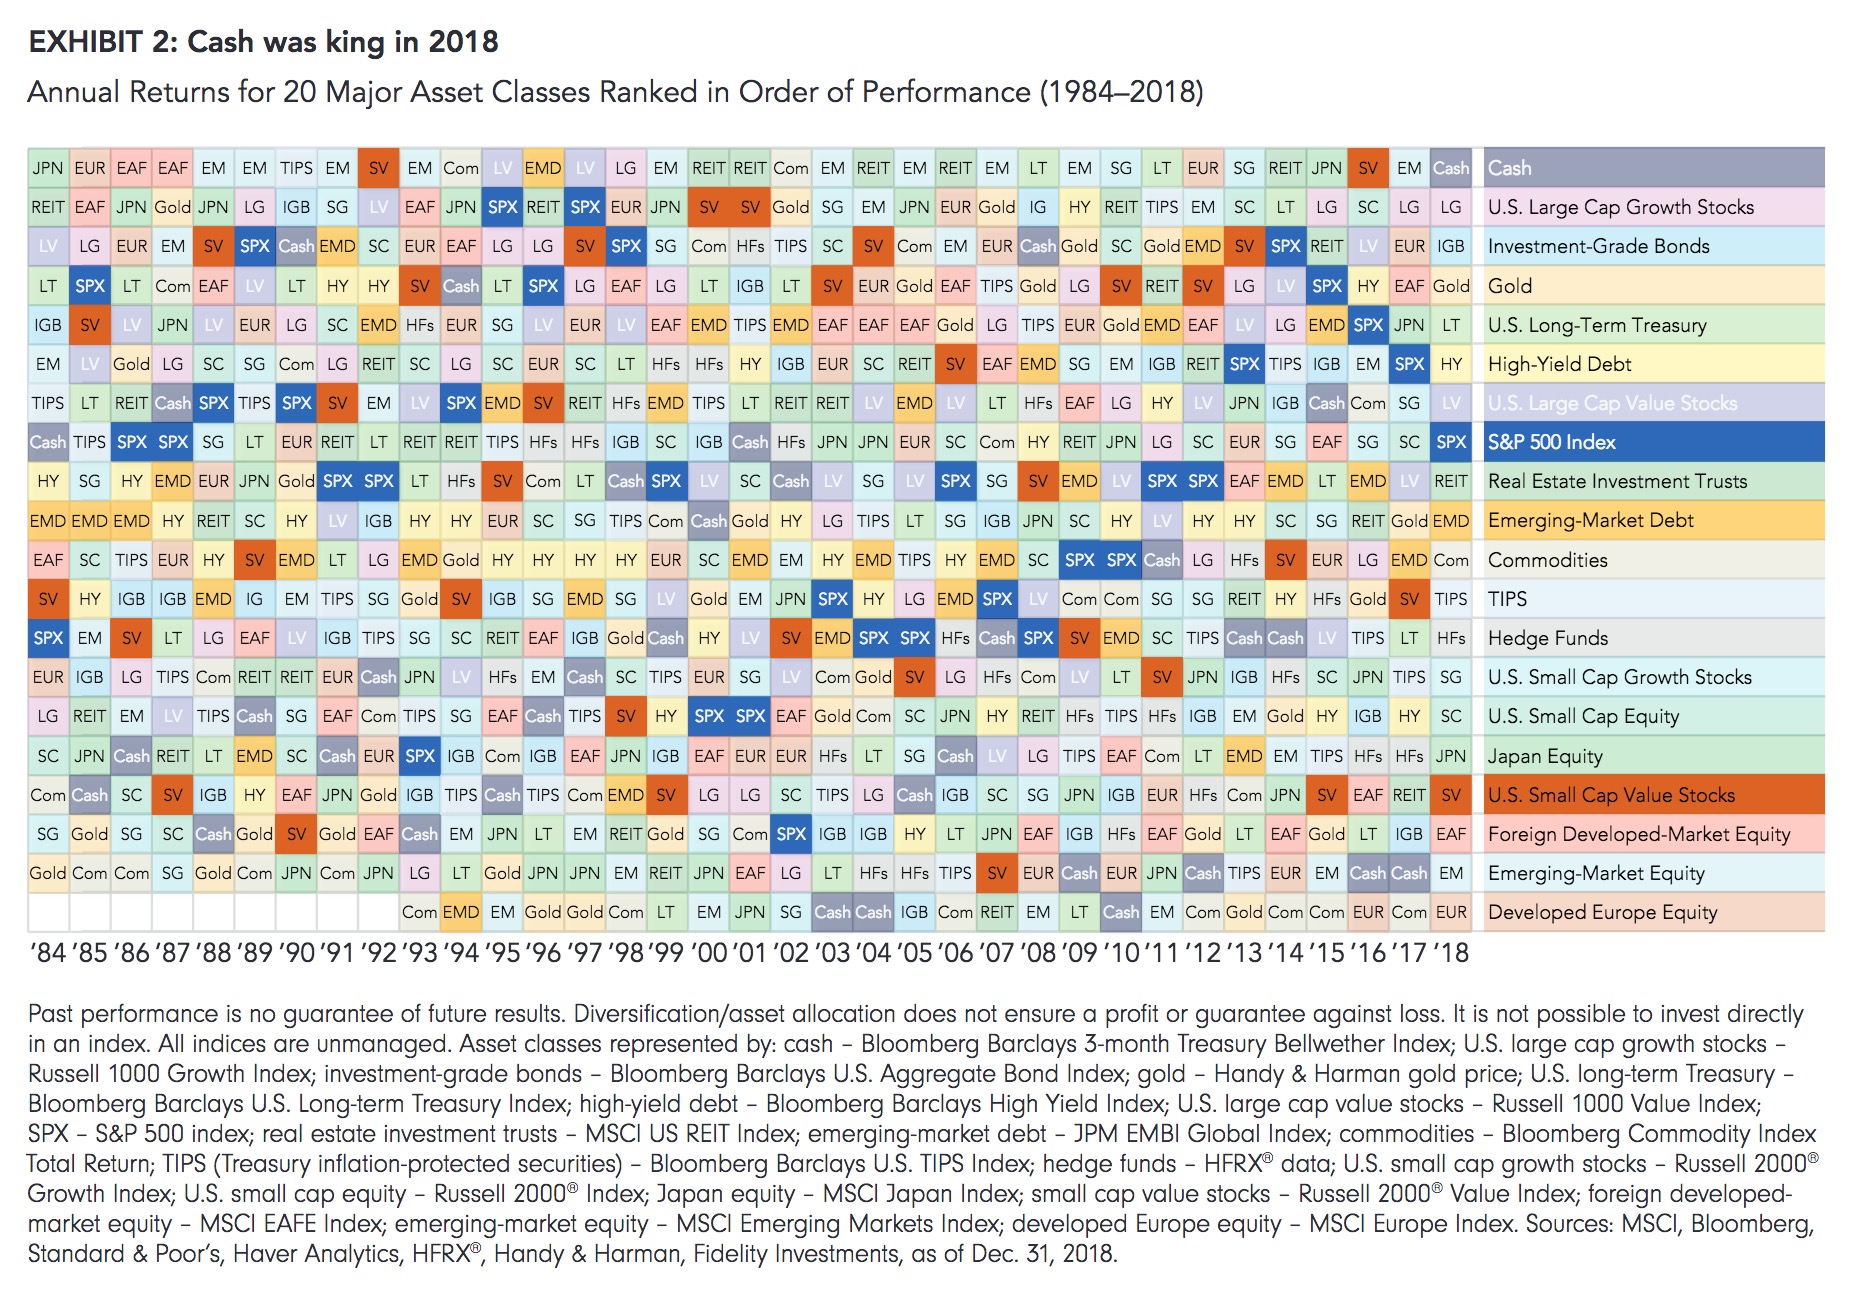
2018 was interesting in other ways too. For one, cash was king, topping the leaderboard of the 20 asset classes that I track. You can see that in the chart below, my “periodic table of investment returns” (Exhibit 2). The fact that cash was on top in 2018 is interesting for two reasons. First, the asset class returned only 1.7%, which is a pretty low hurdle for others to be unable to overcome. Second, this is the first time in 70 years that cash beat everything else: Hard to believe, but it’s true. If I narrow the universe of asset classes to just the eight majors—S&P 500, longterm Treasuries, high-yield debt, investment-grade bonds, TIPS, cash, gold, and commodities—we find only one other year when cash was king: 1981. That’s also interesting, because 1981 was the year when cash produced a stellar 14.7% return. So, that was a very high hurdle to overtake. Not so in 2018.
Corrections, common and uncommon
The value proposition for investing in stocks (as part of a diversified portfolio) is straightforward. The stock market historically has gone up more than it has gone down, and over the long term the S&P 500 has delivered a CAGR (compound annual growth rate) of around 10% nominal and 6.5% after inflation (based on Robert Shiller’s data sets linking back to 1871).1 At the same time, the historical odds of a 10% correction are four in ten, and the odds of a 20% “bear market” are one in five (Exhibit 3). In other words, the market goes through corrections all the time, yet still manages to deliver returns that, over the long run, are superior to a risk.free asset (i.e., cash or government bonds). It’s simple math really, a reversion to the mean. No one should ever be surprised when stock prices correct, because that is what they have done at regular intervals ever since there was a stock market. But loss aversion is part of our human nature, and sometimes our emotions get the best of us. Investing should always remain on the left side—the logical side—of the brain. Over the very long term—using daily data going back to 1900—the chart shows the stock market has been down 50% or more from its previous high only 2% of the time. It’s something to keep in mind when deciding whether to buy or sell at the point when the market is down 20%, as it was only a few weeks ago.
But many investors have been conditioned by the 2007–08 financial crisis and the dot-com bubble back in 2000 that a 20% correction can quickly turn into a 50% meltdown from which it can take years to recover. But these episodes are the exception, not the rule. The “lost decade” of the 2000s falls into a small bucket of market regimes called “secular” bear markets. Other secular bears include the 1970s and 1930s. Secular bears can last 10–15 years with little progress but elevated volatility.
At the same time, such periods can be interspersed with secular bull markets or “super cycles” that last, on average, 18 years and historically have produced almost double the average return (18% per annum versus 10%) while exhibiting shorter and shallower corrections. Whether we are currently in a secular bull market is unknowable in real time, but since its 2009 low the market so far sure has acted like we are in one. If that turns out to be the case, then December’s 20% “bear market” could prove to be short-lived, not unlike 1998, which saw a roughly 22% decline (using intraday values) reversed in only five months, or the 2011 correction, in which an almost 22% decline reversed in seven months.

Time will tell
We have a long year ahead, so let’s take a look at what’s next. For equities and credit, I think the valuation derating leaves risk assets on much better footing than a year ago. While the fundamentals remain uncertain, the much lower P/E ratio (30% lower than at the January peak) and wider credit spreads (high-yield spreads widened to 540 basis points in December) means that, in balancing the potential for gain against the potential for loss, investors are better-compensated for taking on risk:
We definitely could not say the same a year ago.
We still have earnings and the Fed to contend with, as we always do, of course. On the earnings side, things have gone from great to good and down to fair in a hurry. The third quarter was the high point, with Q3 earnings growing at a 24% rate, year over year. We are now getting into the Q4 earnings season and expectations are for 11% growth. But 2019’s Q1 and Q2 consensus earnings are now projected at only 2% to 4%, and the calendar.year 2019 estimate has been dropping steadily, from 12% a few months ago to around 7% today. At the rate that this growth estimate is falling, we may get only low singledigit growth in 2019.
Fortunately, against this weaker growth backdrop the Fed is now much more sensitive to downside surprises and has hinted that it may well be on hold for a while in terms of rate hikes—and perhaps even its balance sheet. That’s a step in the right direction, in my opinion, but for the markets the question is whether these measures are enough. Should the Fed be easing? I don’t think so, but this is where the debate is now going. It’s no longer a question of whether the Fed should hike two more times or four more times and over what period, but whether the
Fed should be tightening at all, or even easing. These are big unknowns that will take time to resolve. This suggests to me that the market is not going to break out any time soon. But “not breaking out” to new highs and “making new lows” are obviously not the same thing. In terms of the risk/reward ratio, though, one thing is clear in my mind: This most recent 20% drawdown priced in a lot of bad news and, with valuations brought back to earth, investors are getting better compensated to brace against an uncertain future.
Author
Jurrien Timmer | Director of Global Macro, Fidelity Global Asset Allocation Division
Jurrien Timmer is the director of Global Macro for the Global Asset Allocation Division of Fidelity Investments, specializing in global macro strategy and tactical asset allocation. He joined Fidelity in 1995 as a technical research analyst.
This is original content from Fidelity Investments in the U.S. The source of all factual information and data on markets, unless otherwise indicated, is Fidelity Investments. Commissions, trailing commissions, management fees and expenses all may be associated with mutual fund investments. Please read the prospectus, which contains detailed investment information, before investing. Mutual funds are not guaranteed, their values change frequently and past performance may not be repeated. Certain Statements in this commentary may contain forward-looking statements (“FLS”) that are predictive in nature and may include words such as “expects”, “anticipates”, “intends”, “plans”, “believes”, “estimates” and similar forward-looking expressions or negative versions thereof. FLS are based on current expectations and projections about future general economic, political and relevant market factors, such as interest and assuming no changes to applicable tax or other laws or government regulation. Expectations and projections about future events are inherently subject to, among other things, risks and uncertainties, some of which may be unforeseeable and, accordingly, may prove to be incorrect at a future date. FLS are not guarantees of future performance, and actual events could differ materially from those expressed or implied in any FLS. A number of important factors can contribute to these digressions, including, but not limited to, general economic, political and market factors in North America and internationally, interest and foreign exchange rates, global equity and capital markets, business competition and catastrophic events. You should avoid placing any undue reliance on FLS. Further, there is no specific intentional of updating any FLS whether as a result of new information, future events or otherwise.
From time to time a manager, analyst or other Fidelity employee may express views regarding a particular company, security, and industry or market sector. The views expressed by any such person are the views of only that individual as of the time expressed and do not necessarily represent the views of Fidelity or any other person in the Fidelity organization. Any such views are subject to change at any time, based upon markets and other conditions, and Fidelity disclaims any responsibility to update such views. These views may not be relied on as investment advice and, because investment decisions for a Fidelity Fund are based on numerous factors, may not be relied on as an indication of trading intent on behalf of any Fidelity Fund. Stock markets are volatile and can fluctuate significantly in response to company, industry, political, regulatory, market, or economic developments.
Investing involves risk, including risk of loss.
Past performance is no guarantee of future results.
Diversification and asset allocation do not ensure a profit or guarantee against loss.
All indices are unmanaged. You cannot invest directly in an index.
Endnote
1 Robert J. Shiller is a Yale economics professor and Nobel laureate, as well as the author of such books as Irrational Exuberance (2000), among others. He developed, alone or in partnership, the S&P/Case-Shiller Home Price Indices and the cyclically adjusted price-to-earnings ratio, also known as the CAPE or the Shiller P/E Ratio; his data series are available at http://www.econ.yale.edu/~shiller/data.htm.
Index definitions
Standard & Poor’s 500 (S&P 500®) index is a market capitalization-weighted index of 500 common stocks chosen for market size, liquidity, and industry group representation to represent U.S. equity performance.
Russell 1000 Value Index is a market capitalization-weighted index designed to measure the performance of the large-cap value segment of the U.S. equity market.
It includes those Russell 1000 Index companies with lower price-to-book ratios and lower expected growth rates.
Russell 1000 Growth Index is a market capitalization-weighted index designed to measure the performance of the large cap growth segment of the U.S. equity market. It includes those Russell 1000 Index companies with higher price-to-book ratios and higher forecasted growth rates.
Russell 2000 Index is a market capitalization-weighted index designed to measure the performance of the small cap segment of the U.S. equity market. It includes approximately 2,000 of the smallest securities in the Russell 3000 Index.
Russell 2000 Value Index is a market capitalization-weighted index designed to measure the performance of the small cap value segment of the U.S. equity market. It includes those Russell 2000 Index companies with lower price-to-book ratios and lower forecasted growth rates.
Russell 2000 Growth Index is a market capitalization-weighted index designed to measure the performance of the small cap growth segment of the U.S. equity market. It includes those Russell 2000 Index companies with higher price-to-book ratios and higher forecasted growth rates.
MSCI US REIT Index is a free float.adjusted market capitalization-weighted index that comprises equity real estate investments.
MSCI EAFE Index is a market capitalization-weighted index designed to measure the investable equity market performance for global investors in developed markets, excluding the U.S. & Canada.
MSCI Europe Index is a market capitalization-weighted index that is designed to measure the investable equity market performance for global investors of the developed markets in Europe.
MSCI Japan Index is a free float-adjusted market capitalization-weighted index designed to measure the performance of the large and mid cap segments of the Japanese market.
MSCI Emerging Markets Index is a market capitalization-weighted index that is designed to measure the investable equity.
Bloomberg Barclays U.S. Aggregate Bond Index is a broad-based, market value-weighted benchmark that measures the performance of the investment.grade, U.S. dollar-denominated, fixed-rate taxable bond market.
Sectors in the index include Treasuries, government-related and corporate securities, MBS (agency fixed-rate and hybrid ARM pass-throughs), ABS, and CMBS.
Bloomberg Barclays U.S. 3 Month Treasury Bellwether Index is a market value-weighted index of investment-grade fixed-rate public obligations of the U.S. Treasury with maturities of 3 months, excluding zero coupon strips.
Bloomberg Barclays U.S. Treasury Inflation Protected Securities (TIPS) Index (Series L) is a market value-weighted index that measures the performance of inflation-protected public obligations of the U.S. Treasury that have at least one year remaining to maturity.
JPM (JPMorgan) EMBI (Emerging Market Bond Index) Global Index tracks total returns for the U.S. dollar.denominated debt instruments issued by emerging-market sovereign and quasi-sovereign entities, such as Brady bonds, loans, and Eurobonds.
Bloomberg Commodity Index Total Return measures the performance of the commodities market. It consists of exchange-traded futures contracts on physical commodities that are weighted to account for the economic significance and market liquidity of each commodity.
Bloomberg Barclays U.S. High Yield Index is a market value-weighted index that covers the universe of dollar-denominated, fixed-rate, non-investment-grade debt.
Bloomberg Barclays Long-Term Treasury Index is an unmanaged index of obligations of the U.S. Treasury that have a remaining maturity of 10 years or more.
Third-party marks are the property of their respective owners; all other marks are the property of Fidelity Investments Canada ULC.
© 2019 Fidelity Investments Canada ULC. All rights reserved.
U.S.: 873000.1.0 CAN: 127227-v201927