Equity markets have started to advance again this week after spending the first part of February digesting their big January rebound. US earnings season has moved into the later phases featuring a large number of reports from small and mid-cap companies while senior companies continue to report results in Canada.
Recent gains by the Russell 2000 indicate that the market rebound has wide breadth with the troops following the generals upward. Unlike last summer when the US was trending upward and other regions were trending downward, this time markets in other regions are climbing alongside the US, including Canada and several Asia-Pacific markets such as Hong Kong, Taiwan, Singapore and Japan.
Some of the political forces which had loomed as potential headwinds for equity markets have faded in recent days. The US Congress has reached a budget deal to head off a second government shutdown that could have had a negative impact on stocks. US-China trade talks continue to progress, and President Trump has suggested the March 1st deal deadline could be extended if things keep moving in the right direction.
In this issue of Equity Leaders Weekly, we look at the impact of the shift in North American monetary policy from hawkish to neutral on bond prices, and investigate sector rotation in North American equity markets using the Sector Scopes feature in SIA Charts.
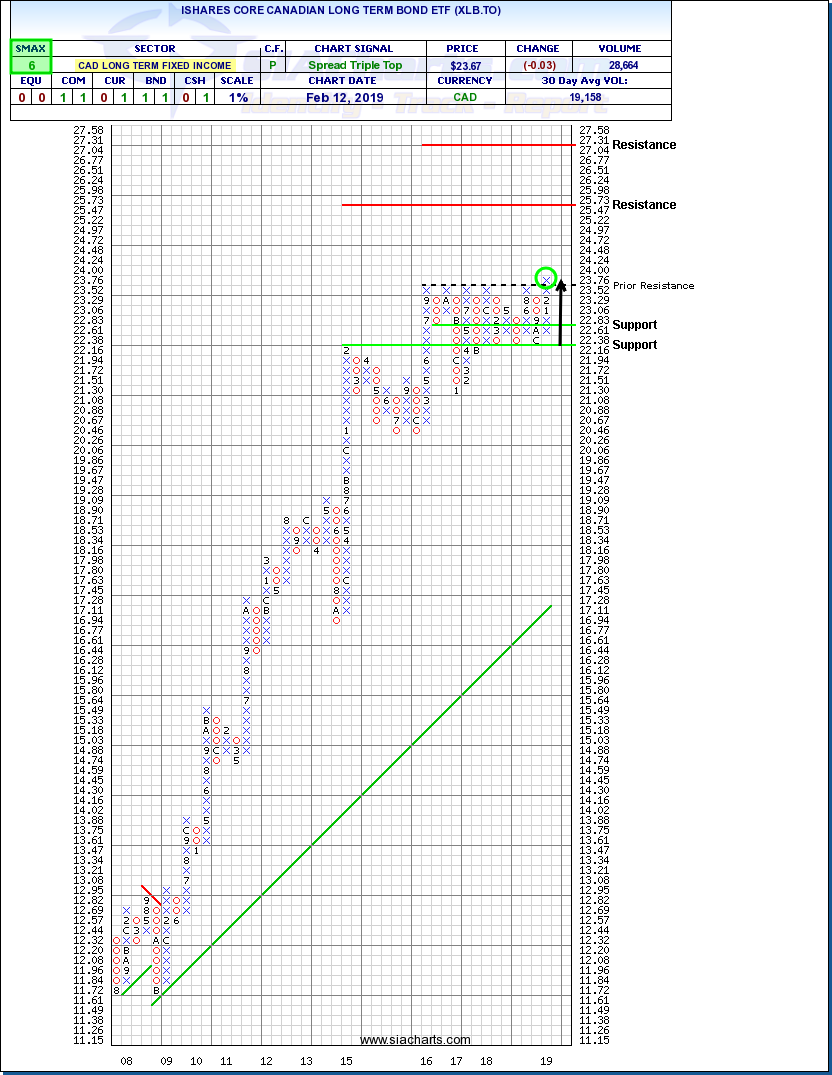
iShares Core Canadian Long-Term Bond ETF (XLB.TO)
In 2018, both the Bank of Canada and the US Federal Reserve Board were hawkish on monetary policy as both central banks raised interest rates several times during the year. Moving into 2019, the tone coming from the two central banks has shifted to neutral. Based on recent comments from Fed Chair Powell and Bank of Canada Governor Poloz, it appears that both central banks have paused their interest rate hike programs for the time being.
In the January 31st issue of Equity Leaders Weekly, we noted that this dovish shift in monetary policy has had a positive impact on interest-sensitive stocks, particularly real estate. This change has also had a positive impact on bond prices, which have moved upward as traded interest rates have come down.
US bonds have been moving up for a few weeks, and this week Canadian bonds have started to break out to the upside. One of the general rules of thumb in technical analysis is that the wider the base, the more significant the breakout and the larger the potential move. Based on this the current breakout in the iShares Core Canadian Long-Term Bond ETF (XLB.TO) appears particularly significant.
Readers of our Point and Figure reports at SIA Charts will recognize that we often comment on Double, Triple and Quadruple Top patterns as bullish. This week, by breaking through $23.76. XLB.TO has completed an extremely rare Spread Sextuple (6!) Top, signalling the end to a consolidation phase that dated back to September of 2016 and the start of a new uptrend. Vertical counts from previous advances suggest potential resistance near $25.73 or $27.31 with initial support possible near $22.61.
 Sector Scopes Monthly Review
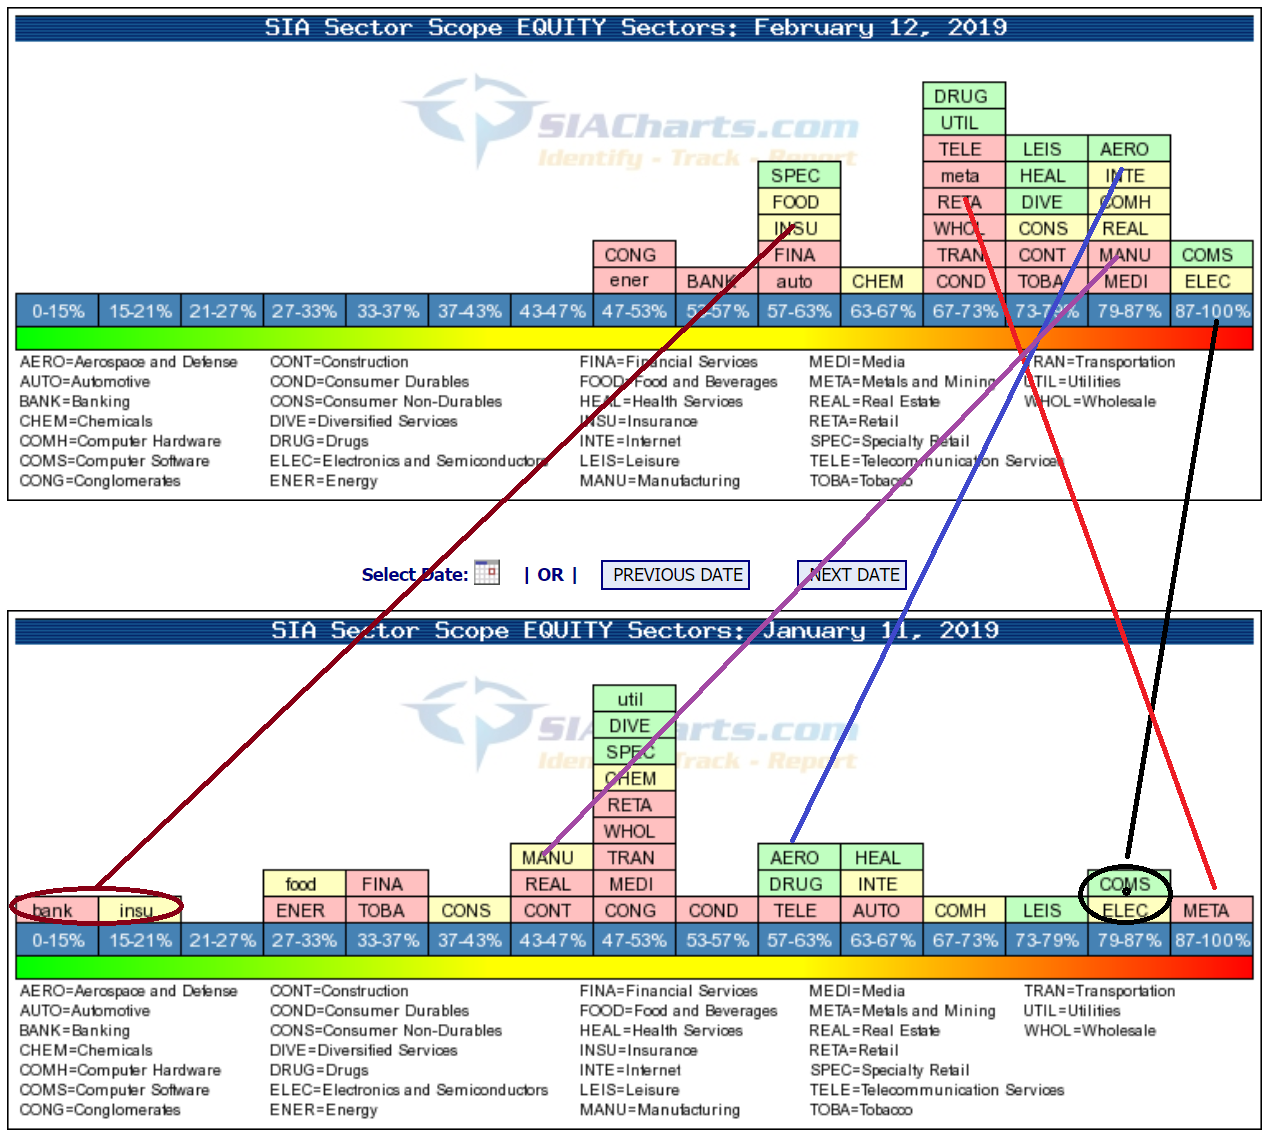
The Sector Scopes feature in the Markets section of SIA Charts provides a visual report on the bullish percent (percentage of stocks in a group on bullish point and figure signals) for 31 North American stock market industry groups. The Sector Scopes provide not only a snapshot of which groups are favored or unfavored at a given point in time but comparisons over time can indicate capital flows.
At the end of December, nearly all of the groups were piled up on the left side of the Sector Scopes chart (not shown), indicating that markets had become extremely oversold. By mid-January (lower chart), groups were spread out over the spectrum. Currently the majority of groups are on the right-hand side of the chart but are mainly in the 57% to 87% range. This indicates that investors are generally bullish currently but not to an extremely overbought degree.
Over the last month, many groups have shifted rightward (increasingly bullish) but for many groups their relative position has not changed much. Sectors which were leading a month ago like Computer Software and Electronics & Semiconductors remain among the leaders at the right, while lagging groups toward the left like Banks and Insurance continue to struggle relative to other sectors. One group that did see a weakening in its relative position was Metals and Mining which may be related to capital that had moved into gold producers in December as a defensive play moving back out as investor confidence has improved. Sectors that have shown increasing relative strength in the current market rebound include (but are not limited to) Aerospace & Defense and Manufacturing.
SIACharts.com specifically represents that it does not give investment advice or advocate the purchase or sale of any security or investment. None of the information contained in this website or document constitutes an offer to sell or the solicitation of an offer to buy any security or other investment or an offer to provide investment services of any kind. Neither SIACharts.com (FundCharts Inc.) nor its third party content providers shall be liable for any errors, inaccuracies or delays in content, or for any actions taken in reliance thereon.