by Liz Ann Sonders, Senior Vice President, Chief Investment Strategist, Charles Schwab & Co
Key Points
- Although a couple of components had to be estimated courtesy of the government shutdown, the LEI declined in December for the second time in three months.
- Trend often matters more than level, especially when it comes to leading indicators.
- Recessions 101: They are not (and have never been) defined as back-to-back quarters of negative real GDP.
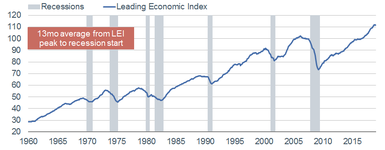
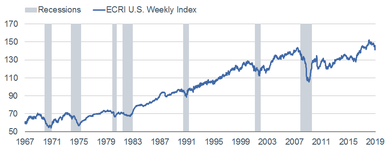
Most regular readers know that I keep a close eye on leading economic indicators, especially at possible economic inflection points. There are two popular indexes that track a multitude of individual leading indicators—one published by The Conference Board (TCB) and one published by the Economic Cycle Research Institute (ECRI). Both are shown below.
LEI’s Rollover?
Source: Charles Schwab, FactSet, The Conference Board, as of December 31, 2018.
WLI’s Rollover
Source: Charles Schwab, ECRI (Economic Cycle Research Institute), as of January 18, 2019.
I prefer the Leading Economic Index (LEI) from TCB because of the transparency of its calculation and components. ECRI’s Weekly Leading Index (WLI) methodology is more secretive; although one assumption most economists share is that it likely puts more emphasis on stock prices than TCB’s. That might explain why it has more clearly rolled over from its February 2018 peak.
Government shutdown
When the LEI for December 2018 was released last week it was noted that due to the government shutdown, data for several of its components were not published and had to be estimated by TCB. They included manufacturers’ new orders for consumer goods and materials for November and December, and building permits for December. In addition, TCB has postponed the regularly scheduled annual benchmark revision of the composite indicators until all underlying data are available.
Of note, the LEI fell again in December—the second decline in three months (October’s was down as well). The index fell 0.1%, with large negative contributions from stock prices and the ISM New Orders Index; offsetting the large positive contribution from average weekly unemployment claims. That said, six of the 10 indicators that make up the LEI increased in December. In the second half of 2018, the LEI was up 1.5%, which was notably slower than the growth rate of 2.7% in last year’s first half.
You’ll see in the red box inside the LEI chart above that the average span from an LEI peak to the subsequent recession’s start has been 13 months historically—with a range from eight to 16 months. Assuming the LEI peaked last September, it helps answer the question of why there is increased recession chatter recently.
Trend over level
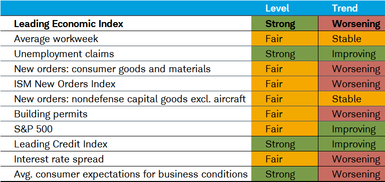
Every month, shortly after the LEI’s release, I put together a “dashboard” which includes the table below. It lists all 10 components that make up the LEI as well as their current level. More importantly, I also include the latest trend; which is often more telling than the level. It’s one of many visuals associated with my oft-expressed view that when it comes to the relationship between economic data and the stock market, “better or worse tends to matter more than good or bad.”
Source: Charles Schwab, FactSet, The Conference Board, as of December 31, 2018.
You can see that there is presently no red flashing in the “level” column; while there’s plenty of red flashing in the “trend” column, including the LEI itself. In fact, what’s interesting about the LEI is that a sub-indicator can make a positive contribution to the index overall, even if its trend has begun to deteriorate.
We’ve spilled much ink over the past few months on the trade war and the havoc it’s wreaked on certain measures of economic activity. There was a burst in activity (“front-running”) in advance of the bulk of tariffs on Chinese imports kicking in last September—hence net exports (especially soybeans) contributing a full percentage point to second quarter 2018’s lofty 4.2% real gross domestic product (GDP) growth. We are now likely experiencing the “give back” phase, witnessed in the new orders and other forward-looking expectations components of the LEI.
Soft catching down to hard
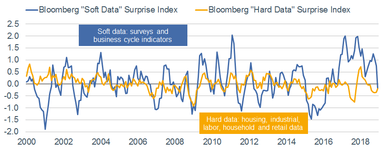
The trend weakness in the LEI’s new orders and expectations components is consistent with another notable deterioration—in the “soft,” or survey/confidence-based economic data. As you can see in the chart below, for an unprecedentedly extended time, business and consumer confidence readings on the economy remained in positive territory, as measured by the soft data “surprise factor” (better or worse than expectations).
Soft Data Catching Down to Hard Data
Source: Charles Schwab, Bloomberg, as of December 31, 2018.
Other than a quick spike in the hard economic data from September 2017 through January 2018, it’s been notably more subdued relative to expectations than the soft data. The convergence we’ve seen in these categories of indicators is in keeping with our expectation that the combination of the ongoing trade war and the recent government shutdown was likely to bring a convergence via the soft data catching down to the hard data.
CEI = NBER’s recession definition
Each month TCB also releases its Coincident Economic Index, made up of four components: non-farm payrolls, personal income less transfer payments, manufacturing and trade sales, and industrial production. Not coincidentally, these are also the metrics used by the National Bureau of Economic Research (NBER) to officially date recessions. For what it’s worth, and belying conventional wisdom, a recession has never been defined as two consecutive quarters of negative real GDP.
The NBER defines an economic recession as “a significant decline in economic activity spread across the economy, lasting more than a few months, normally visible in real GDP, real income, employment industrial production, and wholesale-retail sales.”
There are “proof points” to the misperception of recessions being consecutive quarters of negative real GDP:
- There were consecutive quarters of negative real GDP in the second and third quarters of 1947, but no recession was declared.
- There was a recession in 1960-1961, with no back-to-back negative real GDP quarters.
- There was a recession in 2001, with no back-to-back negative real GDP quarters.
Every end has a start
It’s customary for the LEI to begin to decline while the CEI is still rising; which is the case presently. Every end of a cycle has a start. It’s possible that the start of this cycle’s end began with the September peak in the LEI. It may be too soon to declare it probable, but not too soon to declare it possible.
Copyright © Charles Schwab & Co


