by Craig Basinger, Chris Kerlow, Derek Benedet, Alexander Tjiang, RichardsonGMP
Just a heads up: we will soon be publishing our Market Outlook for 2019 and beyond, entitled “Punch bowl hangover”. In the report, we provide a recap of 2018, a bull vs bear comparison for 2019, our baseline scenario, how we are positioned and a refresh on the Canadian dollar. It’s a good one, promise.
Also, in case you missed last week’s Ethos we did a top 8 of 2018 … in our eyes the best Ethos’es of the year. HERE
If no recession, this is a bargain
2019 looks to be lining up as a simple year. Either a) the bear has started and a negative wealth feedback loop is going to weigh on economic growth until it turns negative or b) not. If ‘A’ then there is much more pain ahead as the market cycle finally ends and we enter a bear market. In other words: you should sell, even with the S&P at 2,500 and the TSX at 14,400. If ‘B’ then this is could be yet another great buying opportunity of this aging bull market cycle.
We are going to try and not ruin the surprise in our upcoming Market Outlook report, but we are in the ‘B’ camp. This appears to be a soft patch in global economy, triggered by a number of factors including slowing China growth, trade tensions and the delayed impact of past rate hikes. These are weighing on growth but at this point don’t appear nearly strong enough to stop global growth. The U.S. adding 312k jobs today certainly is evidence there is some positive economic momentum out there.
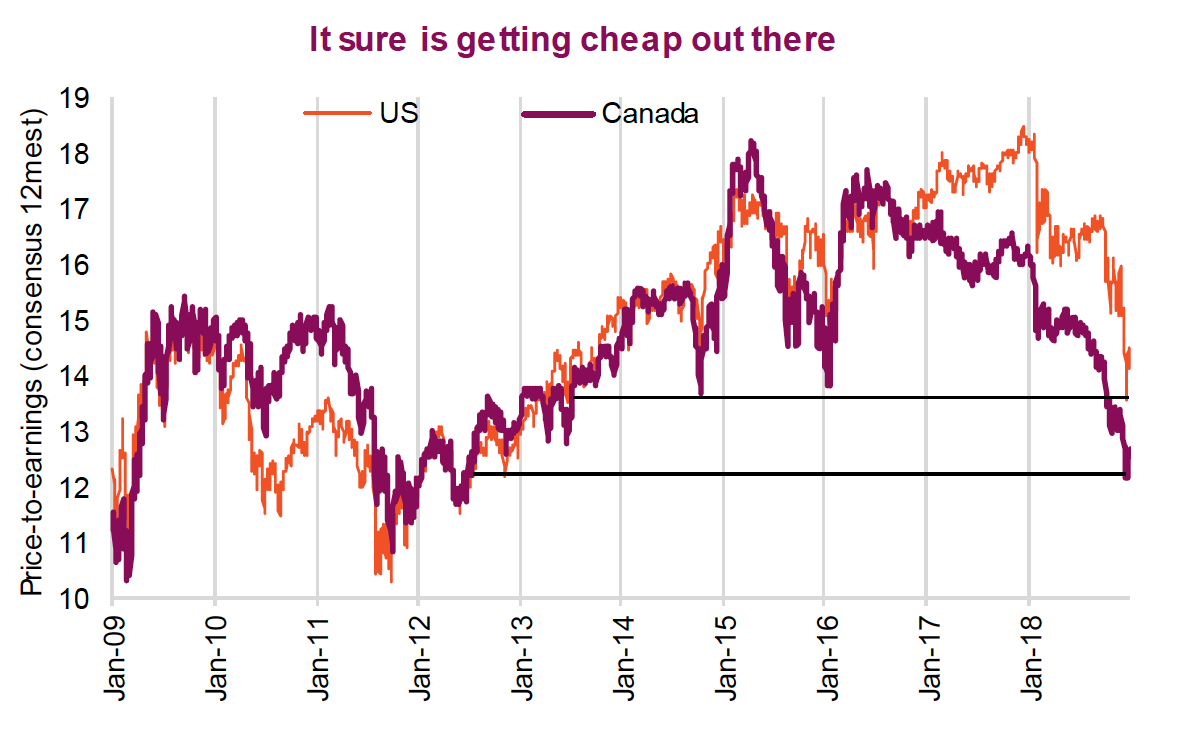
If you agree with scenario ‘B’ and this soft economic patch fades or even just doesn’t deteriorate materially, the markets are offering investors a big opportunity to start 2019. Bond yields have retreated, inflation fears have abated for now and valuations are cheap. The aggregate index price-to-earnings ratio for the S&P 500 and TSX touched their lowest levels in half a decade near the end of December (chart on page 1). Even with the rebound so far in 2019, this has the S&P 500 trading 14.5x and the TSX trading 12.7x.
An aggregate index price-to-earnings ratio is a rather obscure measurement. After all the index changes over time, the constituents change, the sector weights change.
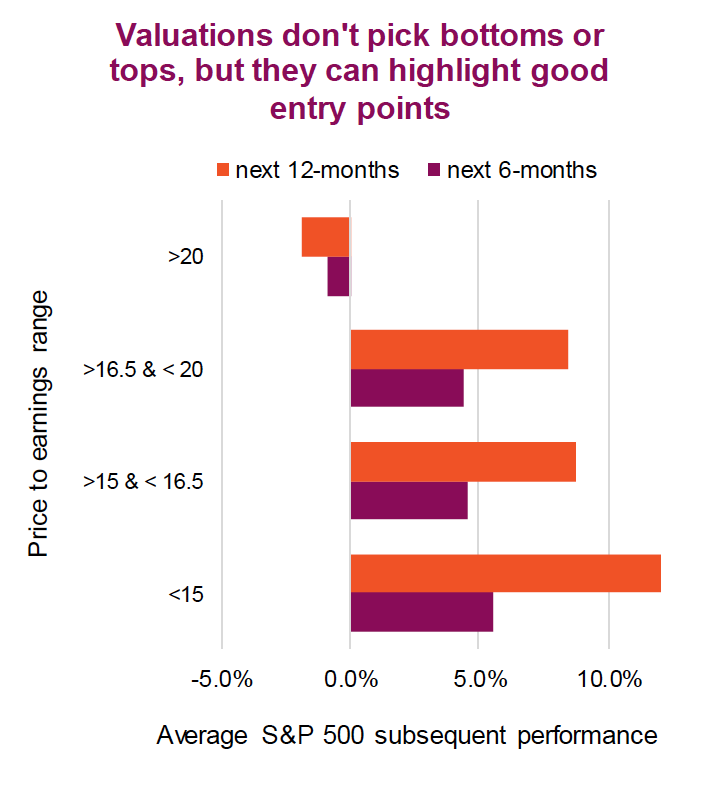
And there is no doubt valuations don’t help pick market tops or bottoms. However, they can provide a guide for entry points and expected returns. The top chart is for the S&P 500 from 1990 till present and breaks down 6 and 12-month subsequent performance based on various valuation entry points.
Clearly, buying the S&P 500 when it is trading below a 15x PE ratio does provide a better opportunity for gains compared to buying at higher valuation points. Given these are average performance measures, we also looked at the probability of positive vs negative returns. Again, below 15x, the odds are better that future returns will be positive.
We used 1990 till present as this is the history of forward earnings estimate data on Bloomberg. The same trend is evident when applied to a longer earnings history based on operating or reported earnings with data back to the mid-1930s.
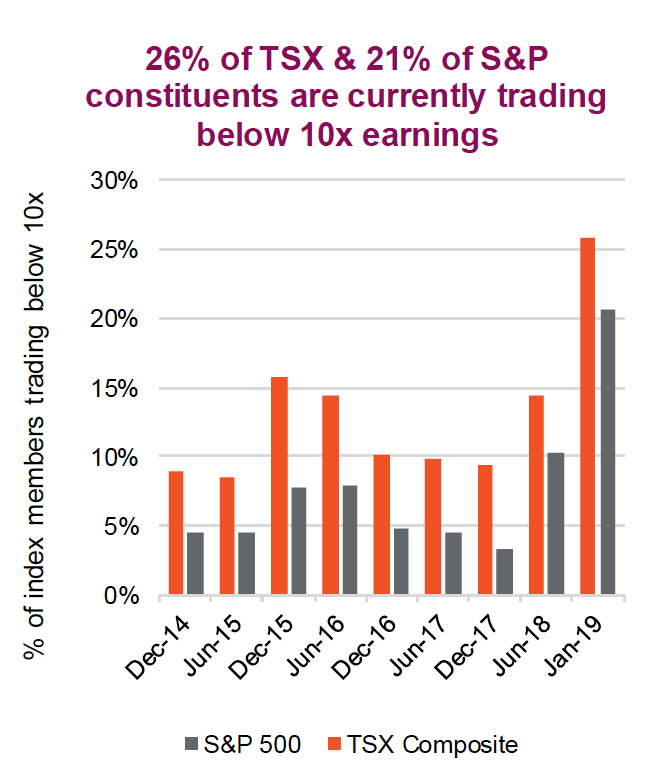
Looking at valuations a different way, we measured how many index members of the S&P 500 and TSX are trading below 10x earnings (chart 2). The TSX has 26% of its index members trading below 10x and the S&P is not far behind at 21%. That is by far the highest percentages in some time.
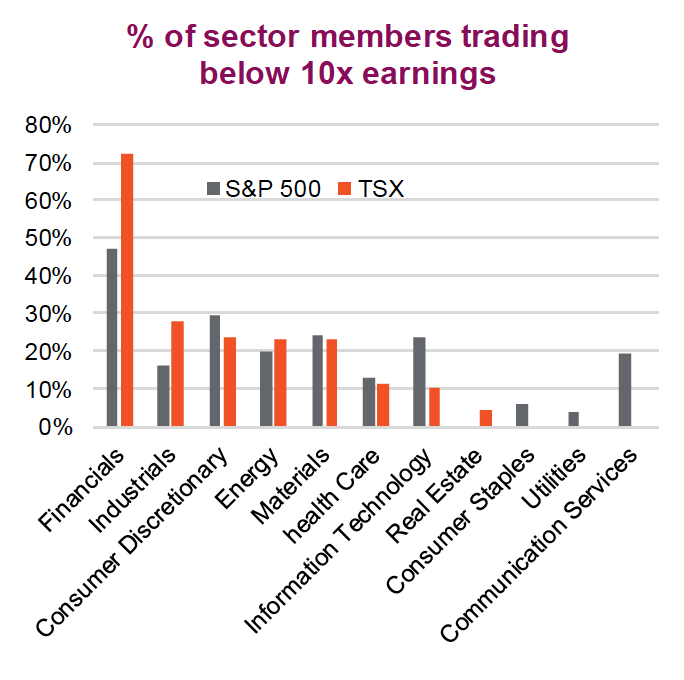
Digging a bit deeper, Financials are the source of many of these companies trading below 10x. 72% or 18 of 25 Financial companies in the TSX have PE ratios below 10x. For the S&P 500, almost half their Financial companies are below 10x (32 of 68). There seems to be value in most sectors, except the more interest rate sensitives including Real Estate, Consumer Staples and Utilities. The final chart is the percentage of each sector that is trading below 10x, to highlight where much of these cheap stocks are sitting.
Lots of deals out there
One of the tricky parts of investing is when there are deals to be fund, the narrative or market ‘issues’ are always front of mind. That is what keeps many from acting. And we can’t say with certainty that the economic weakness won’t spread. But at this point and with these valuations, it is rather compelling.


