


by John Lynch Chief Investment Strategist, LPL Financial and Jeffrey Buchbinder, CFA Equity Strategist, LPL Financial, and Ryan Detrick, CMT Senior Market Strategist, LPL Financial
• The S&P 500 Index came about as close as possible to the technical definition of a bear market without officially registering one.
• We offer some historical perspective on bear markets and our latest thoughts on fundamentals, the Fed, the government shutdown, and the market’s recent low.
• We encourage investors to remain focused on the fundamentals supporting growth in the economy and corporate profits, and stick with long-term strategies.
While technically not a bear market, it sure felt like one. From its September 20 high through Christmas Eve, the S&P 500 Index fell 19.8%, including a more than 7% one-week (December 14–21) decline unmatched since the 2008–09 financial crisis. Should the S&P 500 end the month where it closed on Christmas Eve, December would mark the third-worst month ever for stocks, behind only October 1987 (-21.8%) and October 2008 (-16.9%).
Market participants have had a lot to digest, including the risk of a policy mistake by the Federal Reserve (Fed), the China trade dispute, a government shutdown, cabinet-level departures from the White House (notably Defense Secretary James Mattis), the United States’ decision to pull troops out of Syria and Afghanistan, and communication mishaps by the Fed and Treasury Secretary.
These issues have given market participants too much uncertainty to shrug off. Here we offer some historical perspective on bear markets that were not accompanied by recessions, which suggests the worst of this sell-off may be behind us. We also include our latest thoughts on stock fundamentals, the Fed, the government shutdown, and whether Christmas Eve marked a major market low.
For more of our views on the U.S. economy, please see today’s Weekly Economic Commentary.
BEAR MARKET PERSPECTIVE
The S&P 500 Index came about as close as possible to the technical definition of a bear market (defined as a 20% or larger decline based on closing prices) without officially registering one. Based on that definition and going back to World War II, there have been 14 bear markets, with 7 of them accompanied by a U.S. economic recession and 7 without an accompanying recession. As shown in Figure 1, the recessionary bear markets were quite painful for stock investors, with an average S&P 500 decline of 37%.
THAT SURE FELT LIKE A BEAR KEY TAKEAWAYS
Please see our Outlook 2019: FUNDAMENTAL: How to Focus on What Really Matters publication for insights on the economy, stock, and bond markets, and investments for the year ahead.
A look at the non-recessionary bear markets offers some reassurance. Three of the past four nonrecessionary bears ended at 19% corrections (reaching the 20% threshold during intraday trading). The fourth, the 34% decline in 1987, occurred under very different conditions. The S&P 500 was up more than 40% year to date in August 1987, compared to just below 10% through the September 20, 2018, high, while long-term interest rates shot up from 6% to 9% in 1987. So while bear markets can occur without a recession, if the economy is still growing, market declines tend to stop at around a 20% decline.
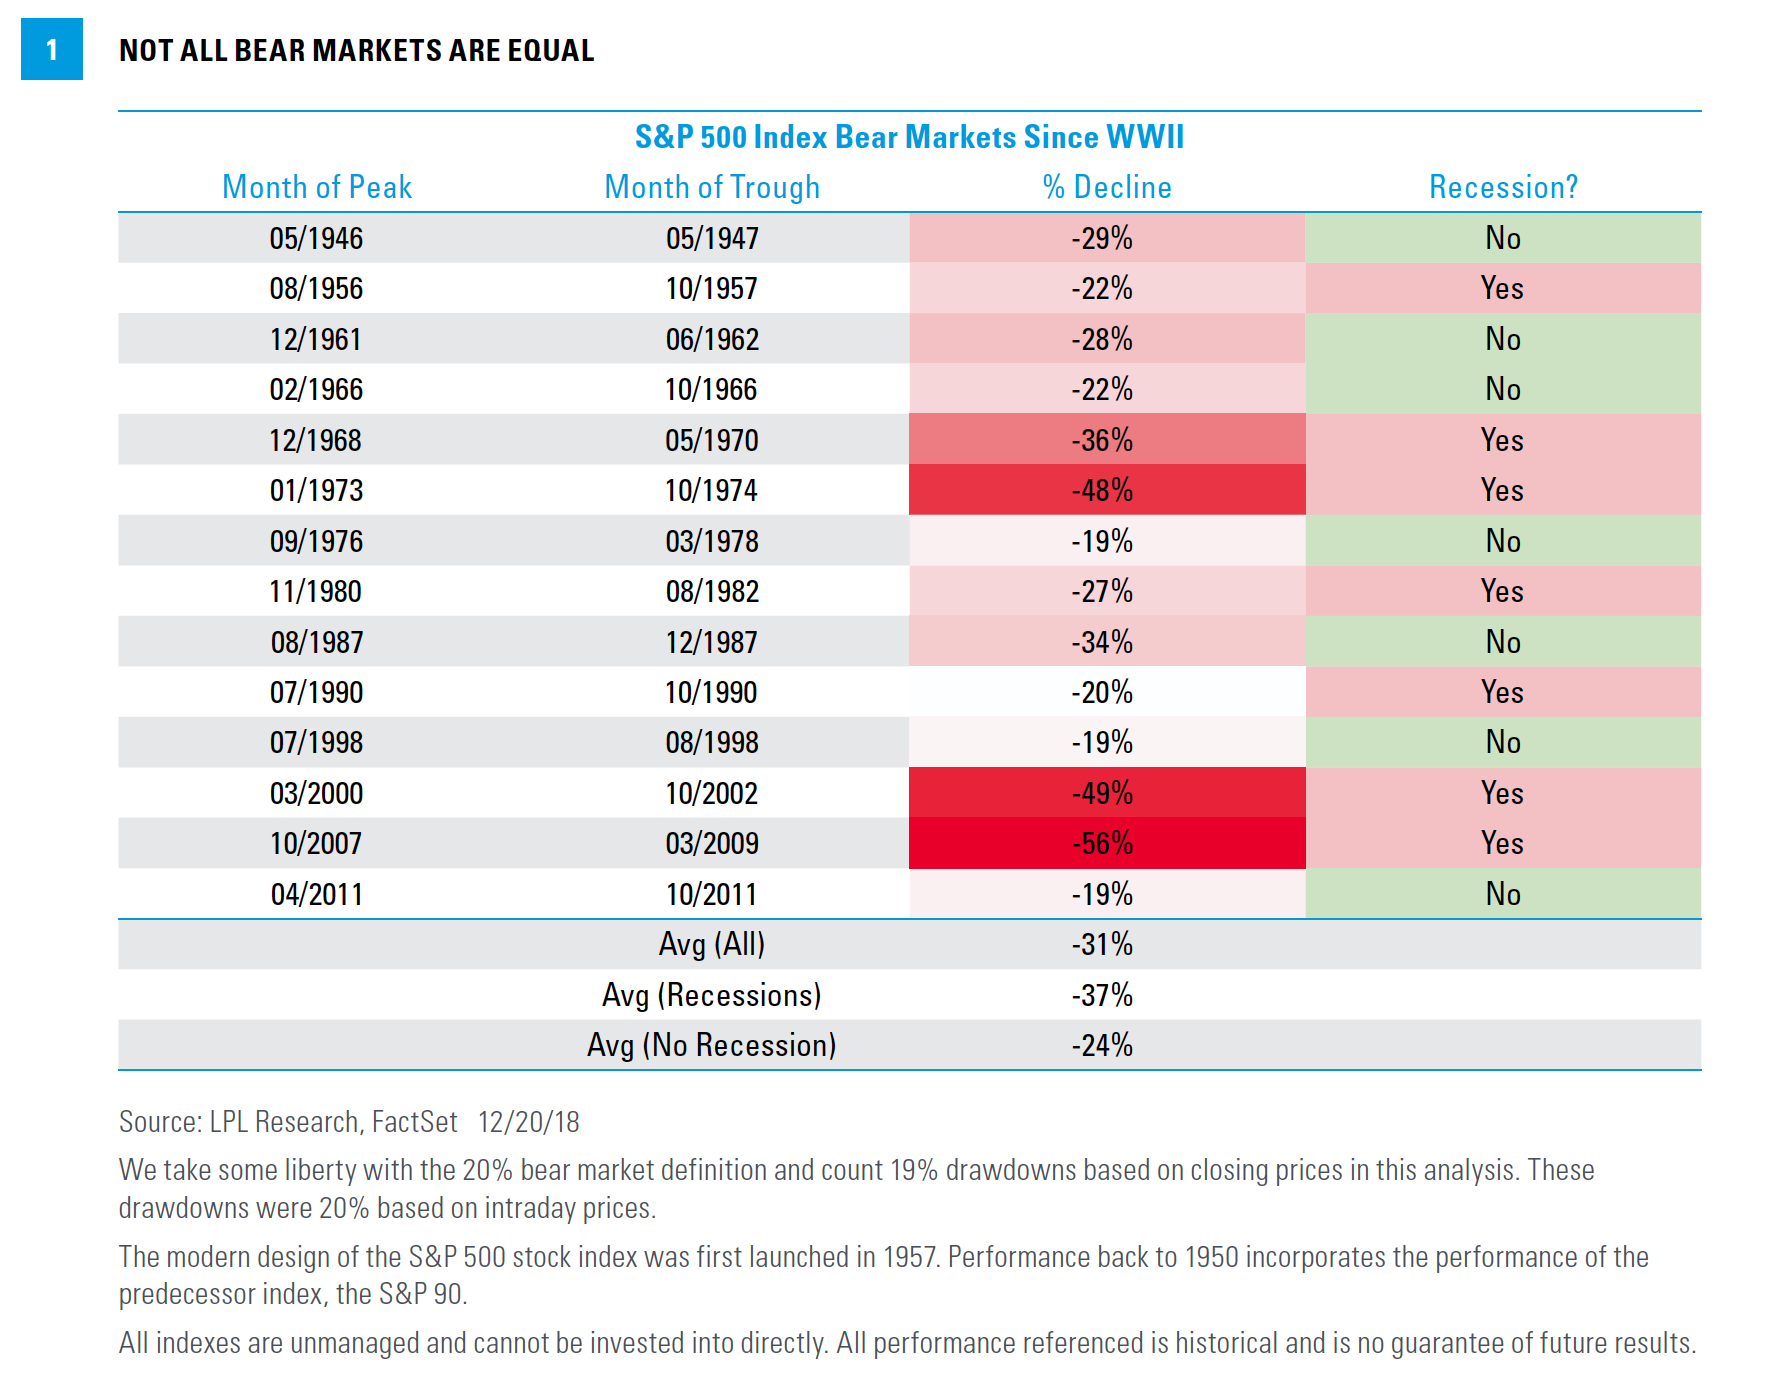
Including 1987 and the four other non-recessionary bears before then (1947, 1962, 1966, and 1978), the average non-recessionary bear market decline is 24%. With stocks having nearly reached that point, the selling appears overdone to us, especially when considering the solid fundamentals supporting growth in the economy and corporate profits for 2019.
While the S&P 500 Index technically did not enter a bear market through December 24 by the most widely used definition, it is important to recognize that the index did fall more than 20% from its record intraday high on September 20 through the December 24 intraday low. Also consider that both the Nasdaq Composite and Russell 2000 Index are in bear markets, and the average stock is down more than 20%, making this experience feel like a bear market, especially when considering the ferocity of the December sell-off.
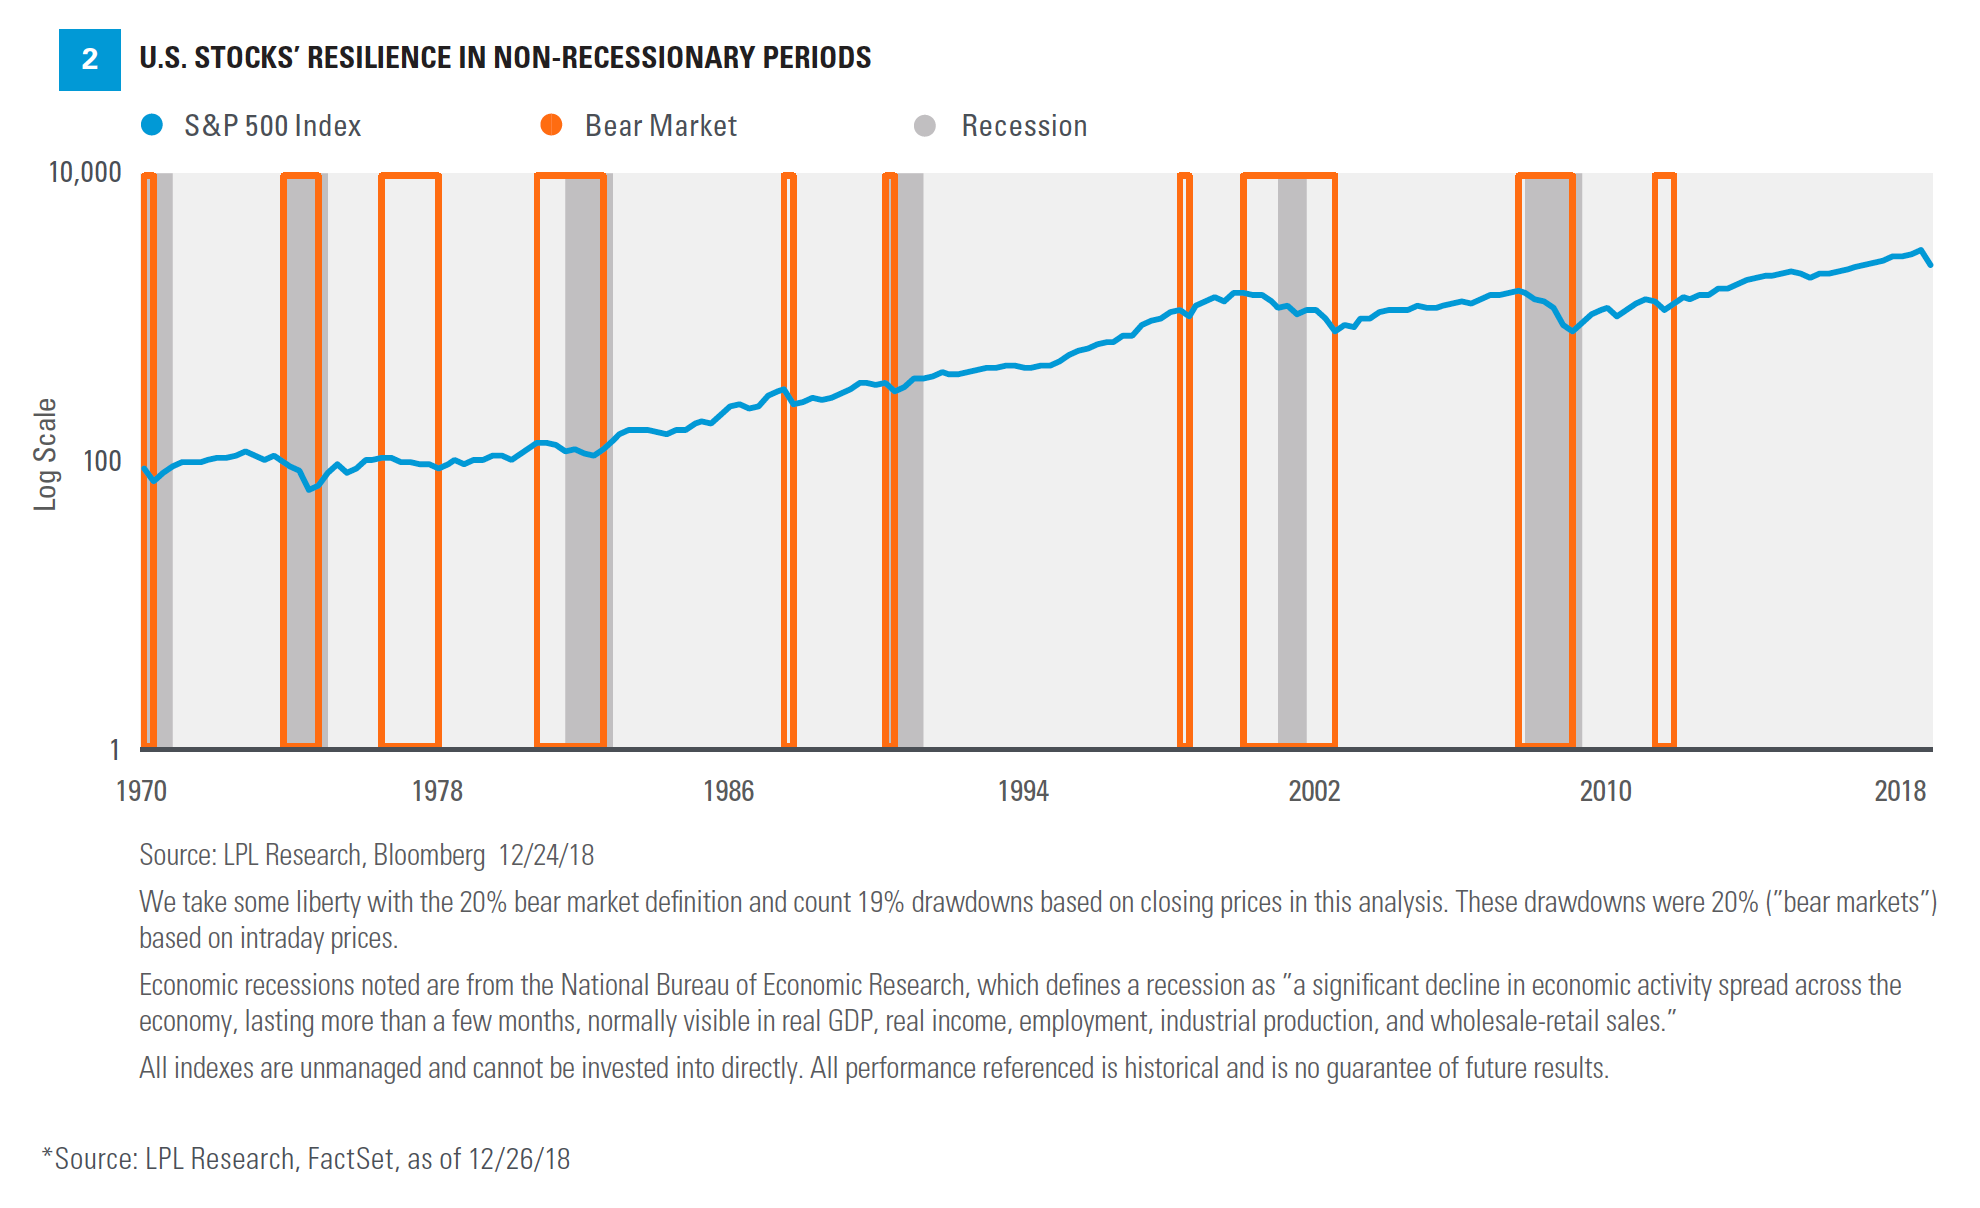
A look at a long-term chart of the S&P 500 does provide some reassurance. As shown in Figure 2, stocks have bounced back relatively quickly from non-recessionary bear markets. In the past four bear markets without recessions, the S&P 500 has taken an average of about 11 months to recover its prior peak. In the last two bear markets without recessions, the S&P 500 recovered in 3 months (1998) and 5 months (2011).
We believe that over longer periods, valuations serve as good indicators of stock market performance. As of December 26, the S&P 500 price-to-earnings ratio (PE) of about 15 times trailing 12-months earnings has historically been consistent with above-average 10-year stock market returns. Shorter-term valuation measures, admittedly less reliable, are also supportive: Sharp drops in the S&P 500 PE have been followed by above-average oneyear returns, with particularly strong rallies starting in August 1998, October 2008, July 2010, and August 2011.
FOCUS ON FUNDAMENTALS
Despite the many pressures on investor confidence, we continue to believe the fundamental backdrop supporting growth in the economy and corporate profits remains sound, suggesting that this market weakness may not lead to a recession in 2019. The U.S. economy remains solid, and we expect continued growth, bolstered by fiscal stimulus, to support potential stock gains in 2019. The Conference Board’s Leading Economic Indicator index is up a solid 5.2% year over year based on the latest reading (November), indicating a low probability of a recession.
The earnings backdrop also remains supportive. Although expectations for 2019 have come down a bit over the past month, we have been encouraged by the resilience of those estimates. Month to date, consensus earnings estimates for the S&P 500 in 2019 are down just 0.9%, while quarter to date, those estimates are flat.* We expect a 6–7% increase in S&P 500 earnings in 2019, slightly below consensus at 7.6%, driven by solid U.S. economic growth and fiscal stimulus. The U.S. economy has never experienced a recession while earnings were growing, as corporate profits typically lead to growth in business investment, productivity, employment, and consumption.
Bottom line: When we look at these and our other favorite leading indicators, we believe the odds of a recession in the U.S. in the coming year are low; therefore, we project continued earnings gains in the year ahead, albeit at a slower pace than that achieved in 2018.
FED POLICY RISK
Perhaps the biggest policy uncertainty weighing on the markets has been the Fed. At its December 19 policy meeting, the Fed didn’t pull back projected 2019 rate hikes as far as the market would have liked, but we are encouraged by the increased flexibility reflected in Fed Chair Powell’s comments.
In addition, we continue to take comfort in his capital markets background and the rarity of Fed rate hikes during stock market corrections. We believe the combination of falling asset prices, slower economic growth overseas, tariffs, housing market softness, falling oil prices, weaker auto sales, and lower inflation expectations all add to the Fed’s “cover” to ease up on expected rate hikes, which could be a positive stock market catalyst in the coming weeks and months. Note that the bond market is pricing in only a one-in-three chance of a one-quarter-point rate hike next year, compared to the Fed’s guidance for two more in 2019.
Also keep in mind that the real fed funds rate (the Fed’s target interest rate minus core consumer inflation excluding food and energy) has not been below 2% ahead of any of the past eight recessions going back to 1960. The current rate is now between 0.25% and 0.5%.
On a related note, while the flat yield curve is of concern to some, the key Treasury yield curve that we focus on—the 2-year and 10-year yield spread— has not inverted yet. And history shows that stocks can continue to go higher for a year or two even after long-term yields fall below short-term yields.
We believe the bond market is sending a slowergrowth signal, not signaling recession in 2019.
GOVERNMENT SHUTDOWN
We remain in the midst of the third government shutdown of 2018. Funding for the proposed wall on the border with Mexico remains the key hurdle in the impasse. While dysfunction in Washington, D.C., is clearly one of the reasons for the market turmoil, keep in mind that these events have historically been resolved quickly and have not had much, if any, impact on the stock market (for more, see our recent blog, “Stocks Tend to Ignore Shutdowns”). In fact, the S&P 500 has risen during each of the five previous shutdowns, while the median performance during shutdowns over the past 40 years is unchanged; on average, the S&P 500 was down a negligible 0.4% and rose exactly 50% of the time.
We discourage investors from keeping government shutdown on their lists of concerns. But remember that the debt limit will have to be raised this summer, which on its own may have more market impact, as deficit spending and rolling back corporate tax cuts may be on the table for House Democrats.
CAPITULATION?
We have been looking for signs of fear in the markets comparable to prior major market lows in order to declare that the majority of the stock market bottoming process is behind us. Being on track for the third-worst month in modern stock market history, after the worst Christmas Eve ever for stocks, certainly had a capitulatory feel to it—suggesting the bargain hunters outnumber fresh bears.
Beyond that, we achieved several other “fear” milestones:
• Just 10% of S&P 500 stocks are now trading above their respective 200-day moving averages, an extreme reading reached only once (in 2011) since the financial crisis.
• Half of S&P 500 constituents closed at a 52-week low December 24 for the first time since the financial crisis.
• The S&P 500 Index put/call ratio (a measure of fear expressed by the options market) registered a more negative reading than either the 2011 or 2015–2016 corrections.
• The American Association of Individual Investors survey is extremely pessimistic with only 25% bulls as of December 20, down from 60% in January of this year. Over the past 20 years, the weekly bullish reading has dipped below 20% just seven times.
Of course no one can predict a market bottom with a high degree of confidence, but these signs of capitulation, consistent with prior major market lows, are important for investors to consider during periods of extreme weakness.
CONCLUSION
This has no doubt been a difficult time for investors. We understand that market weakness can be alarming and cause investors to question their strategy. There are clearly risks among many potential positive developments. A recession could be a potential self-fulfilling prophecy. Worries about the future could prevent companies from investing or consumers from spending in 2019. Trade tensions could re-escalate. While the strong holiday shopping season reflects a healthy consumer, lower asset values can drag on consumer sentiment. A Fed policy mistake is still possible. It is times like these when it is most critical to focus on the long term. Declines are not losses until they are realized.
As we all anxiously watch each stock market tick on our screens, there are plenty of potential catalysts to push stocks higher. We’re already down about as much as we have historically seen during a typical non-recessionary bear market, which is what we think this is. Technical and sentiment measures are extremely negative, suggesting a potential rebound may be in the offing. Valuations are very reasonable, if not cheap. The Fed’s language and actions will likely get more market friendly. Gas prices are down.
Corporate buyback activity is strong and poised to accelerate, supported by strong corporate balance sheets. The turn of the calendar marks the end of the tax-loss selling period. We should see progress on trade next year. And the S&P 500 Index has never been down during the 12-month period after the midterm elections—that’s 18 in a row back to WWII. The average gain for the S&P 500 during the 12 months after a midterm year is 14.5%, and the average 12-month gain from the midterm-year low is 32%.
In closing, we encourage investors to remain focused on the many fundamentals supporting growth in the economy and corporate profits, and stick with your long-term strategy. Happy New Year everyone!
*****