by Don Vialoux, Timingthemarket.ca
Observation
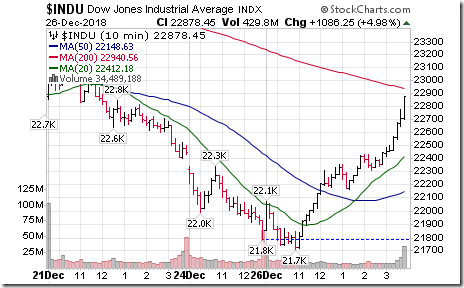
Another wild day, this time in a bullish way! The Dow Jones Industrial Average advanced 1,086.25, an all-time record daily point gain. U.S. equity index shook off early weakness with a gain of 5%.
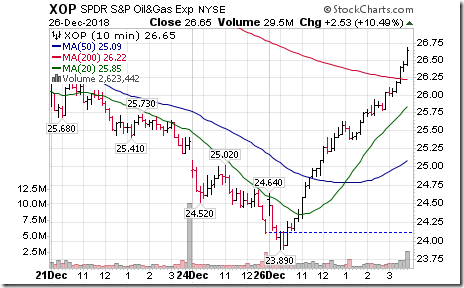
Strongest sector/subsector was energy thanks to an 8.68% jump in the price of WTI Crude Oil
StockTwits Released Yesterday @EquityClock
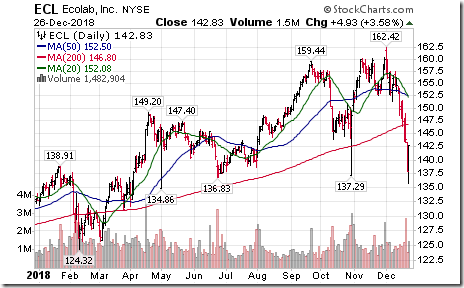
Technical action by S&P 500 stocks to 10:00: Quietly bearish. No intermediate breakouts. Breakdowns: $ECL $AEE $NEE
Editor’s Note: Equities moved lower until 11:00 AM EST before launching higher. Additional breakdowns between 10:00 and 11:00 AM EST included LEG, OMC, CVS, RE, CB, CBOE, MAS, AMD, ECL, GRMN, AVB, PSA, AEE, CMS, AWK, NEE and DLR.
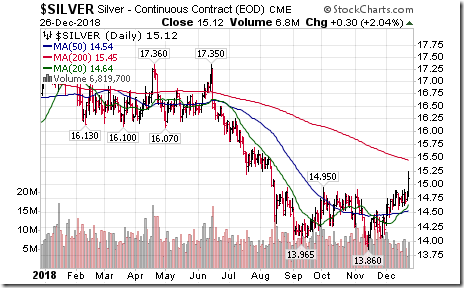
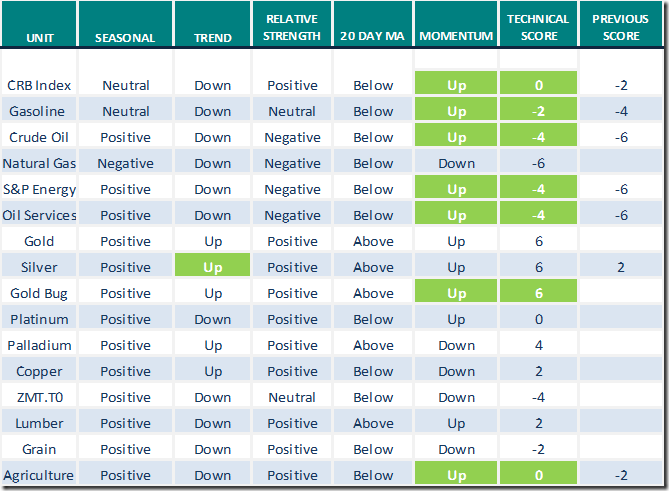
Silver $SILVER moved above $14.95 and its ETN $SLV moved above $14.02 completing a double bottom pattern.
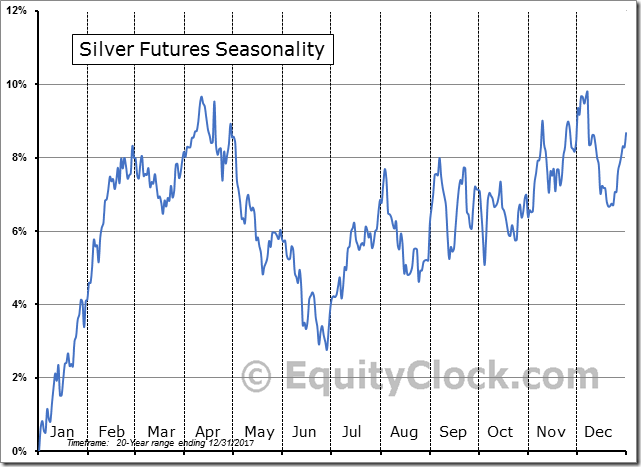
‘Tis the season for strength in $Silver from Mid-December to at least the end of February. $SLV
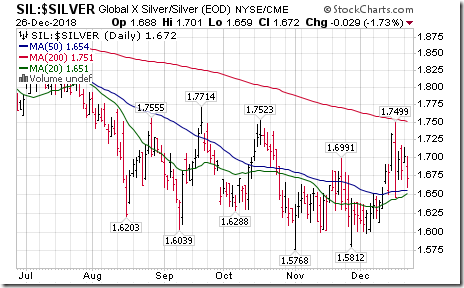
Silver stocks and their related ETNs $SIL continue to outperform Silver $Silver $SLV.
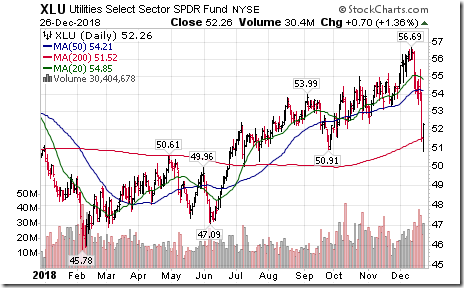
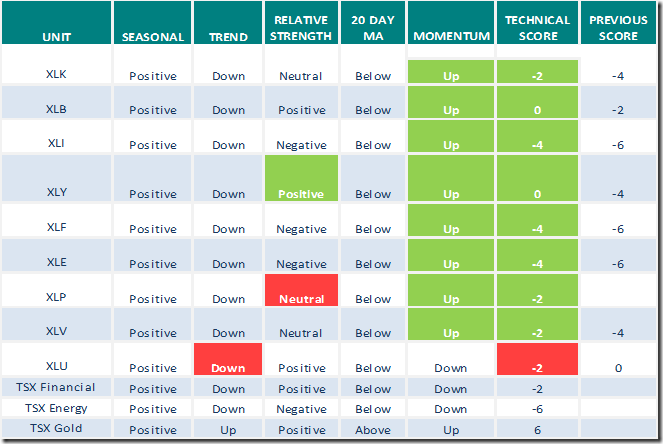
Utilities SPDRs $XLU moved below $50.91 extending an intermediate downtrend. Individual S&P utilities breakdowns: $AEE $CMS $AWK $NEE
Trader’s Corner
Equity Indices and related ETFs
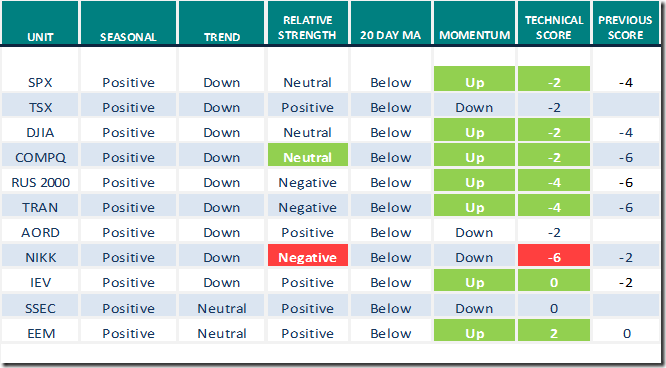
Daily Seasonal/Technical Equity Trends for December 26th 2018
Green: Increase from previous day
Red: Decrease from previous day
Commodities
Daily Seasonal/Technical Commodities Trends for December 26th 2018
Green: Increase from previous day
Red: Decrease from previous day
Sectors
Daily Seasonal/Technical Sector Trends for December 26th 2018
Green: Increase from previous day
Red: Decrease from previous day
http://www.equityclock.com/about/seasonal-advantage-portfolio/
S&P Momentum Barometer
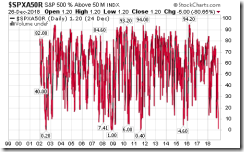
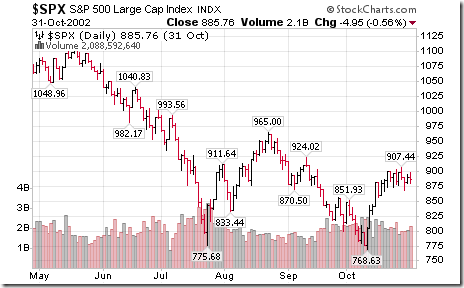
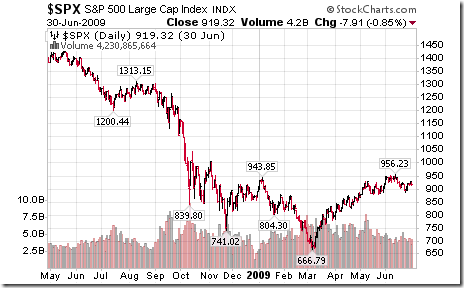
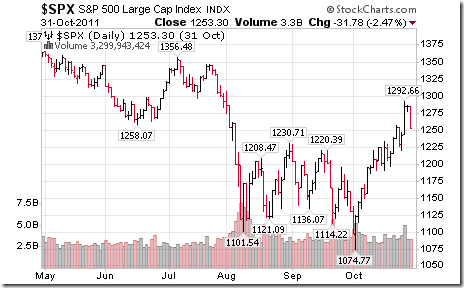
The Barometer dropped 5.00 to 1.20 yesterday, forth lowest level reached in the history of this indicator. After the Barometer dropped to 0.20 in July 2002, the S&P 500 Index gained 24.4% during the next two months. After the Barometer dropped to 1.00 in November 2008, the S&P 500 Index gained 24.4% during the next two months. After the Barometer dropped to 0.40 in August 2011, the S&P 500 Index advanced 11.8% during the next month. A word of caution! Lows set by the S&P 500 Index on those dates subsequently were broken on the downside. The ultimate lows for the cycle (e.g. March 2009) were set several months later. The bottom line: Play the trade on the upside that could last until spring, but expect the lows set midday yesterday to be tested in 2019.
Following are charts showing S&P 500 performance during the periods indicated:
Disclaimer: Seasonality and technical ratings offered in this report and at
www.equityclock.com are for information only. They should not be considered as advice to purchase or to sell mentioned securities. Data offered in this report is believed to be accurate, but is not guaranteed


