by Craig Basinger, Chris Kerlow, Shane Obata, Derek Benedet, Connected Wealth, RichardsonGMP
For decades, the foundational bedrock of portfolio management has been asset allocation, essentially how your investments are diversified across different asset classes. Undoubtedly, the asset mix will remain the most important decision when building and managing portfolios for decades to come. It is not going away.
While an increasing variety asset classes are becoming available thanks to changing regulations and innovative product manufacturers, at its core asset allocation is still the mix between equities and bonds. The higher the ratio of equities to bonds, the higher the expected return, and the higher the volatility.
One of the greatest strengths of asset allocation has been the negative correlation between equities and bonds. When equities prices would fall, bond prices would rise (and vice versa). Those boring bonds in your portfolio helped take the sting out of periods of equity weakness.
However, in this latest spat of equity market weakness, it wasn’t lost on investors that bond prices also fell. The drop didn’t reach the same magnitude as equities, but that cozy relationship of bonds offsetting equity market weakness was not present.
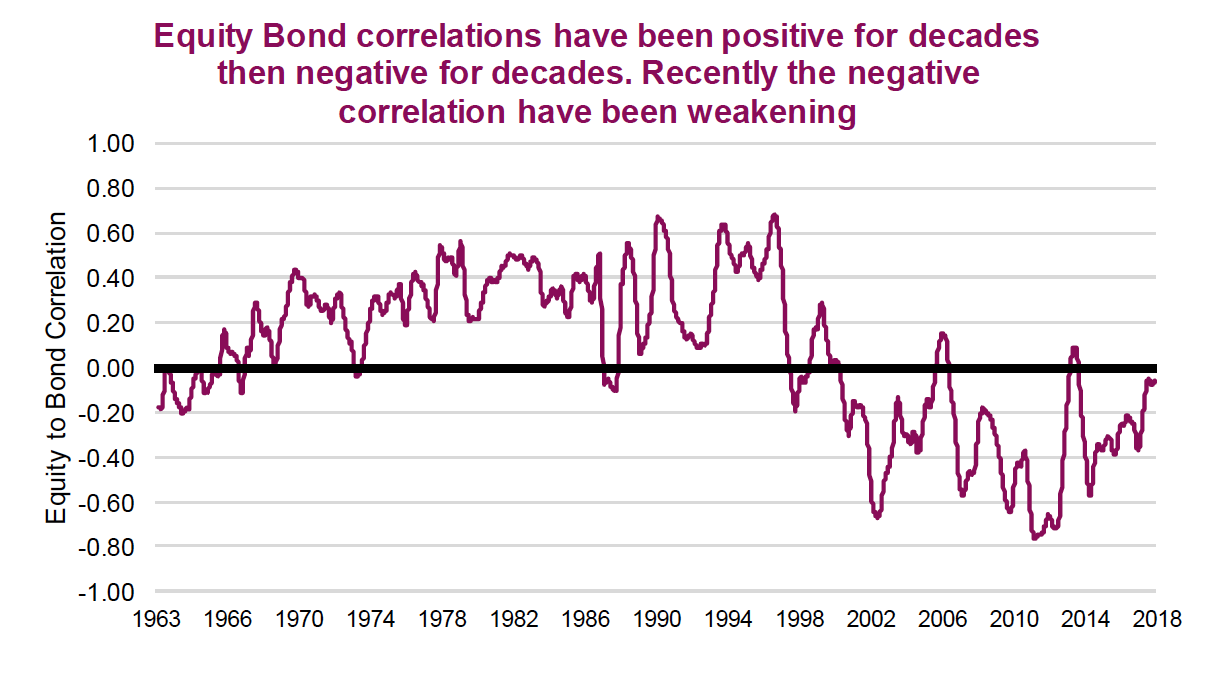
The chart below is the correlation of U.S. equity prices and U.S. bond prices over the past half-century. Correlations certainly do oscillate. This is the trailing annual correlation based on weekly price changes. The strong negative correlation that enhanced the benefits of asset allocation since the mid-1990s seems to be waning.
This does not discredit the main benefit of asset allocation, which is volatility reduction, as the magnitude of fluctuations still tends to be much larger for equities. However, a smaller correlation reduces the benefit.
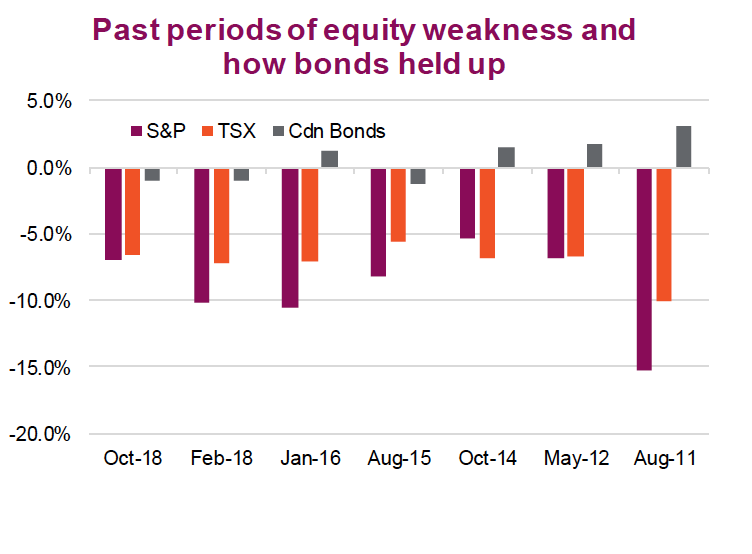
The October correction we have all just experienced (assuming it’s over) is what triggered this topic for Market Ethos. Unlike many of the past corrections or periods of market weakness, bond prices did not rise. Instead they fell, clearly reducing the diversification benefits of asset allocation.
This is becoming more the norm. The top chart shows how equity markets made out during the past six periods of market weakness and how bonds performed. Note that in previous years, bonds consistently rose during corrections, but not so much in the past few corrections. This provides further evidence of the weakening negative correlation between equity and bonds.
We should stress that holding bonds was certainly better than holding equities during these periods of weakness, as the decline was comparatively minor. Hence our view that traditional asset allocation remains the choice foundation for portfolio management. But the benefits are not as good as they used to be.
Correlations have never been constant
The correlation between equities and bonds clearly oscillates over time. The correlation was positive from the mid-1960s to mid-1990s, and negative from the 1990s to mid-2010s. This pattern is not native to just the U.S. market. The UK, Germany, France and Canada followed roughly the same pattern over the years.
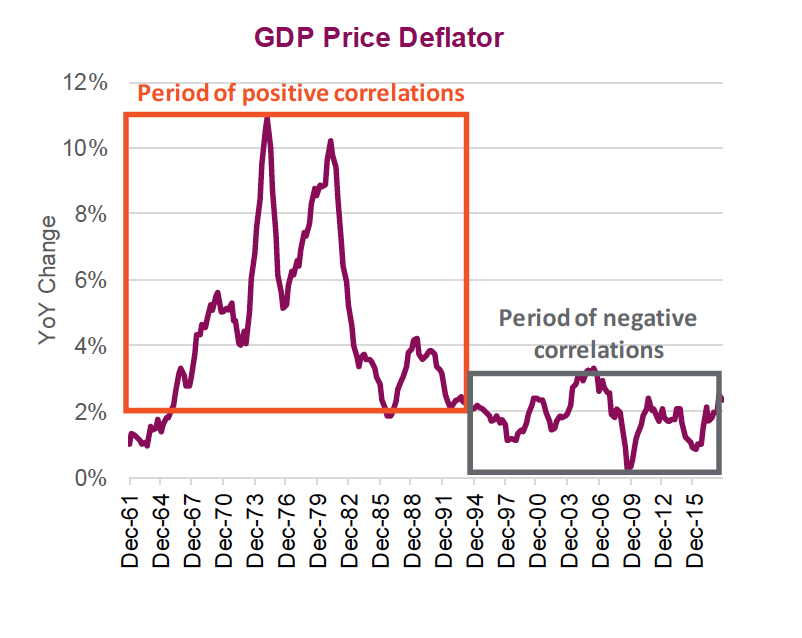
Given the similar patterns across many countries, it’s probably safe to assume the degree of correlation between equities and bonds is driven more by global factors than country-specific factors. Which begs the question, why were correlations so consistently positive from 1966-1985 and consistently negative from 2000-2018?
One simple answer may be inflation. Supporting evidence points to a tendency towards a positive equity / bond correlation, in a more inflationary world. Conversely, in a low-growth, low-inflation environment, the correlation tends to be negative. Which leads to the tricky, and important question: “Are we entering a more inflationary environment?”
If so, it may be time to rethink how we build our portfolios, giving more weight to other asset classes, especially those that did well in the 1960s to early 1990s. Even the U.S. dollar, as a safe-haven currency in past sell-offs, didn’t provide much help this past October. Gold did though.
This is part 1 in a series on asset allocation that we will be publishing sporadically over the next couple months. This will include rethinking the 60/40 mix, other asset classes, alternatives and more.
*****
Charts are sourced to Bloomberg unless otherwise noted.
This publication is intended to provide general information and is not to be construed as an offer or solicitation for the sale or purchase of any securities. Past performance of securities is no guarantee of future results. While effort has been made to compile this publication from sources believed to be reliable at the time of publishing, no representation or warranty, express or implied, is made as to this publication’s accuracy or completeness. The opinions, estimates and projections in this publication may change at any time based on market and other conditions, and are provided in good faith but without legal responsibility. This publication does not have regard to the circumstances or needs of any specific person who may read it and should not be considered specific financial or tax advice. Before acting on any of the information in this publication, please consult your financial advisor. Richardson GMP Limited is not liable for any errors or omissions contained in this publication, or for any loss or damage arising from any use or reliance on it. Richardson GMP Limited may as agent buy and sell securities mentioned in this publication, including options, futures or other derivative instruments based on them.
Richardson GMP Limited is a member of Canadian Investor Protection Fund. Richardson is a trade-mark of James Richardson & Sons, Limited. GMP is a registered trade-mark of GMP Securities L.P. Both used under license by Richardson GMP Limited.
Connected Wealth, RichardsonGMP © Copyright 2018. All rights reserved.


