


by Charles Roth, Thornburg Investment Management
Even before the market selloff, downtrodden value stocks were perking up as pricey growth stocks stumbled. But durable index-level shifts are harder to call than individual stock price disconnects from business fundamentals.
The mid-October selloff in stocks has only fueled market chatter about an incipient rotation from growth to value equities. After a decade in which returns in growth stocks have run rampant over those of asset-heavy, stable earners and cyclical industrials, perhaps it’s time for a breather in growth and, after the dust settles from the current broad-market rout, a rebound in value. This month’s exchange-traded fund flows and value vs. growth index return differentials certainly suggest that a shift in investor sentiment is well underway.
Yet it’s always perilous to call inflection points, particularly when market volatility is spiking. Investors would do well to see the bigger picture, which the International Monetary Fund just revealed in its fall 2018 World Economic Outlook. It sees global growth continuing at a solid 3.7% clip this year and next, and 4.7% in emerging markets in 2018 and again next year, with global trade volumes rising at or above 4%, trade disputes notwithstanding. Third-quarter U.S. corporate earnings growth is expected to come in close to 20%. The sky is not falling.
The selling in risk assets may be unnerving, but after a decade in which the S&P 500 has returned an annualized 14.4% and the MSCI ACWI ex-US 8%, corrections aren’t only to be expected, but welcomed, as they create better price values for risk assets. Value can be assessed at the individual security or index levels, though we think it’s far easier at the security level. As we recently noted in a piece examining the efficiency of bottom-up stock analysis compared to top-down index mean reversion estimates, correctly timing inflection points is extraordinarily hard at the index level. It can look easy in hindsight, but there are plenty of headfakes along the way.
Value and Growth’s Alternating Leads
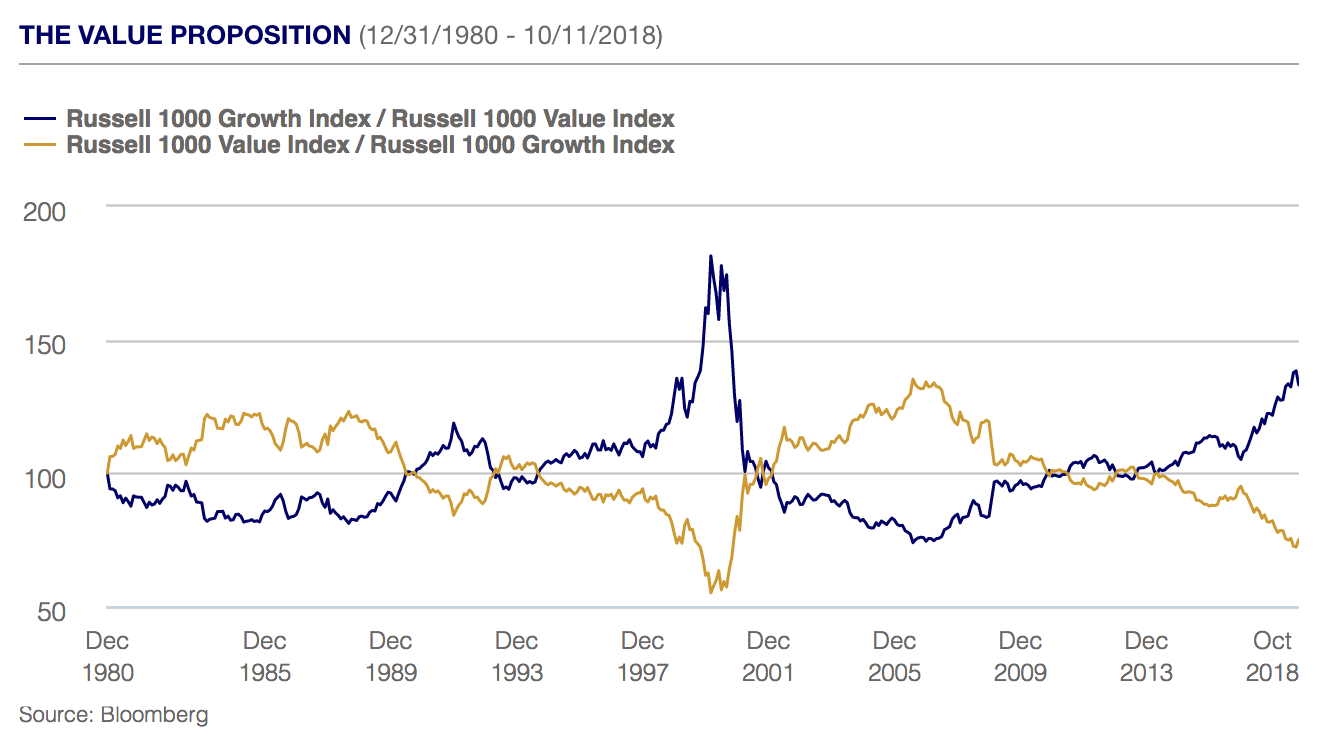
Take, for example, the Russell 1000 Value Index (RLV) relative to its Russell 1000 Growth Index (RLG) sibling, and the inverse RLG/RLV ratio. The mean reversions appear clear: as the Federal funds rate and the 10-year Treasury yield zig-zagged their way down from the beginning 1981 through the middle of 2008, value outperformed growth point-to-point. Over the course of those nearly three decades, though value outperformed in the first 10 years, then mostly lagged in the prelude to the Tech bubble. But after that burst, value resumed beating growth until just before the Financial Crisis.
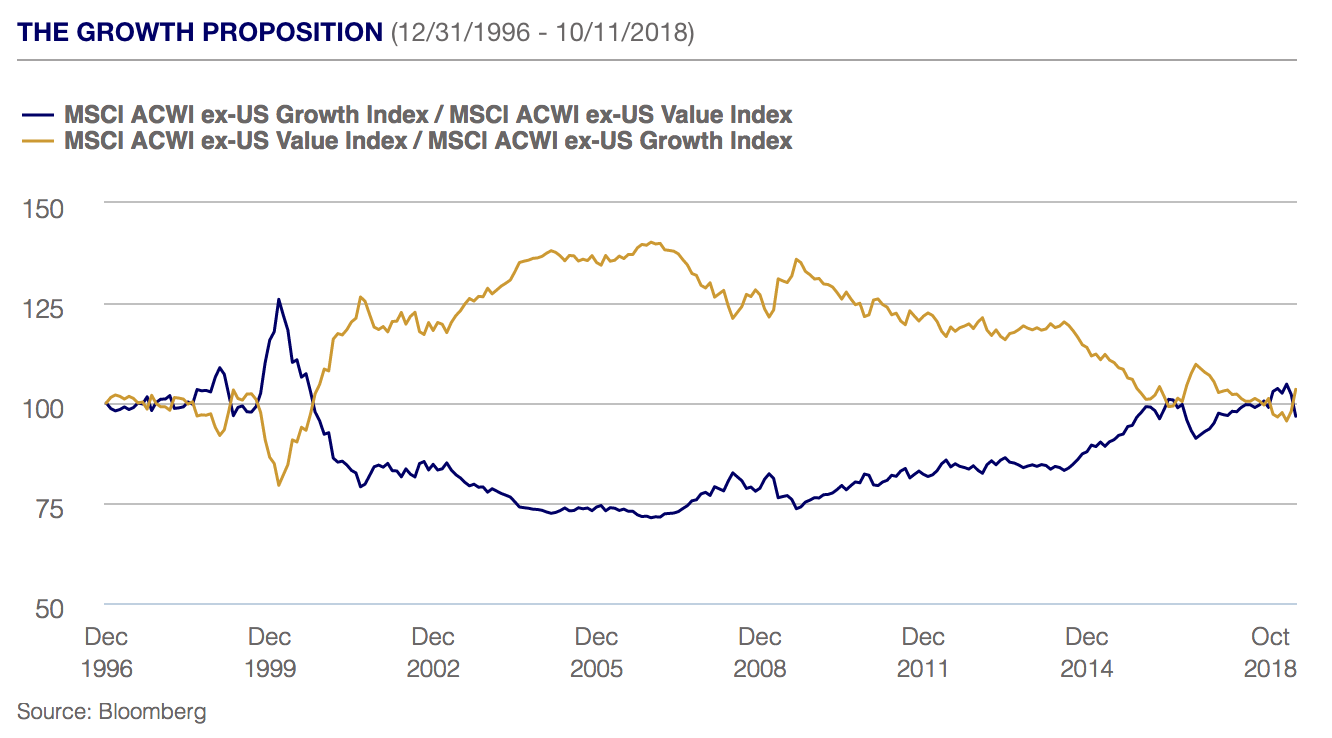
From the bottom of the Financial Crisis, growth then shifted into overdrive. It was fueled in part by unprecedented monetary policy: rock-bottom or negative benchmark interest rates and major central bank asset purchases, which kept long-term rates at lowly levels for years to come. Until, perhaps, this fall: from September 11 to October 10, the Russell 1000 Value Index and S&P 500 Value Index both beat their growth counterparts by well over three percentage points, while the MSCI ACWI ex-US Value Index returned a positive 1.6%, contrasting smartly with the ACWI ex-U.S. growth’s 3.5% decline in the same period.
Though the index history is somewhat shorter, similar mean reversions can be seen over the last 22 years in the MSCI ex-US Growth and MSCI ex-USA Value Indices.
Plenty of explanations have been bandied about for value’s long outperformance before the Financial Crisis and subsequent underperformance since. Declining long-term Treasury yields combined with falling household savings created tailwinds for expanding consumption that boosted old industry goods producers and infrastructure companies.
Valuation and Index Reality Checks
The Financial crisis then induced consumer deleveraging, and a key valuation metric for these assets—price/book—didn’t really apply in a brave new, digital world. “Price/book isn’t that relevant for tech companies,” says Thornburg Portfolio Manager Lei Wang. “It’s still important in valuing cyclical, industrial, and fixed-asset business models, but not for tech’s intangible assets—intellectual property and patents.”
For Rob MacDonald, another Thornburg PM, “the interesting part is how the new economy has altered the productivity of assets in the old economy.” Tech has created incremental value of existing assets by increasing their efficiency and up-time, he says. Uber and Airbnb are the obvious examples. But new tech applications have been reaching across the old economy. “Traditionally, value was created with incremental increases in the amount of, say, machines produced. Now the value is created more by the sensors that go into the machines than by the number of machines per se. The sensors increase the efficiency and productivity of assets, enabling better and greater utilization of them,” he explains.
Telecoms are at risk of becoming just “dumb” pipe, MacDonald says. While their relevance in facilitating the movement of data is clear, there’s a reason why S&P Dow Jones and MSCI recently replaced the old telecommunications sector with a newly minted “Communications Services” sector under the Global Industry Classification Standards (GICS). A quarter-century ago, the telecommunications sector’s weighting was 9% of the S&P 500 Index, but by the end of August it had dwindled to less than 2%. In the same period, information technology’s weighting went from around 6% to 26%, and that didn’t include tech giants such as Amazon and Netflix, which were classified as consumer discretionary.
As a result of the index revamping, Netflix was moved to communications services, but not Amazon, which remains in consumer discretionary. Google parent Alphabet and Facebook were moved to communication services from information technology, while Comcast, Walt Disney, Twenty-First Century Fox, and Charter Communications also migrated to communication services from consumer discretionary. The upshot: a number of effectively tech-driven behemoths are now divided into three separate sectors, while those big firms that own “pipes” are trying to leverage them with more valuable media and content offerings. The new-born communications services sector weighs in at a strapping 10% of the blue-chip index.
Share Buybacks Meet Passive Flows
Beyond old-school telecoms, other sectors populated by “value” stocks that have lost noticeable weight over the years include consumer staples and materials, and to lesser extents, energy, industrials, and financials, all which have tended to have lower price-to-earnings and higher-dividend yields. By contrast tech companies typically have higher price/earnings ratios, higher earnings, and far better margins. Moreover, they have also aggressively repurchased shares. S&P Dow Jones data show that over the five years to June 2018, S&P 500 information technology sector share buybacks totaled $744 billion, while those of the consumer discretionary hit $429.26 billion, lifting their per-share multiples.
Then there’s passive flows. Bloomberg reports that over the last five years, roughly $1.1 trillion departed actively managed mutual funds. At the same time, ETFs received about $950 billion and index funds got more than $780 billion in inflows. Much of those no doubt flowed to large-cap growth stocks, which can readily absorb the flows and are included in numerous indices. Apple, Amazon, and Microsoft, for example, are all members of more than 200 indices, according to Bloomberg. “As money comes out of active funds, much of it goes into passive growth funds.” MacDonald points out. “The active value portfolio manager hasn’t been getting such flows, which would support value stocks.”
That may now be changing if the rotation is indeed underway. The U.S. Federal Reserve ended its “quantitative easing” asset purchases in 2014 and began raising its key interest rate a year later and has since lifted it eight times. As the cost of capital goes up, rate hikes can represent a headwind for many growth companies, particularly those on the smaller side. Some cyclical stocks, banks among them, will benefit as rates rise, though rate-sensitive, dividend-paying bond proxies may not. Still, stable earners such as utilities, consumer staples and telecoms should prove defensive in a volatile equity market and strong economy.
The Value in Value
There’s also the valuation differentials. Whether growth or value stocks, if a company’s share price significantly diverges from its business fundamentals, opportunities to buy or sell are created. “When the market gets too greedy and pushes growth stock prices too high, there’s downside risk, as we’re now seeing,” Wang points out. “Conversely, when the market is too bearish on value stocks and their prices have fallen too far, there’s more downside protection and upside risk.” Moreover, if emerging market central banks are also hiking domestic interest rates to keep the differentials with U.S. rates from overly widening, U.S. and global growth, as noted, are still healthy and corporate earnings generally strong.
So what does that mean for the potential growth vs. value rotation? “Historical index patterns persist, but market cycles don’t repeat themselves in the same ways,” Wang cautions. “Technology changes, consumer tastes change, and indexes change, as we saw with the new telecommunications services index. That suggests it’s hard to time index mean reversions.”
MacDonald agrees. “It’s easier to assess if a company’s share price reflects its business fundamentals and earnings prospects, whether it’s classified as a growth or value stock, than it is to judge where in the cycle an index is. Our expertise is in assessing individual stocks, and using portfolio baskets of growth, value and stable earners to avoid trying to time the market. We can focus on the return prospects of individual stocks better than we can predict where an index will be down the road.”
Copyright © Thornburg Investment Management